Theses and Dissertations from 2019 Student Research and Publications
Spring 5-7-2019
A Study of Marshallese Student Attendance in a
Northwest Arkansas Secondary School
Paula Lynn Floyd-Faught
Arkansas Tech University
Follow this and additional works at:https://orc.library.atu.edu/etds_2019
Part of theBilingual, Multilingual, and Multicultural Education Commons
This Dissertation is brought to you for free and open access by the Student Research and Publications at Online Research Commons @ ATU. It has been accepted for inclusion in Theses and Dissertations from 2019 by an authorized administrator of Online Research Commons @ ATU. For more information, please contactcpark@atu.edu.
Recommended Citation
Floyd-Faught, Paula Lynn, "A Study of Marshallese Student Attendance in a Northwest Arkansas Secondary School" (2019).Theses and Dissertations from 2019. 4.
2
A Dissertation Submitted to the Graduate College Arkansas Tech University
in partial fulfillment of requirements for the degree of
DOCTORATE OF EDUCATION in School Leadership
in the Department of Leadership and Learning of the College of Education
May 2019
Paula Lynn Floyd-Faught
Educational Specialist, Arkansas State University, 2017 Master of Arts, Arkansas Tech University, 2009 Bachelor of Arts, Arkansas Tech University, 1999
This dissertation, "A Stgdy of Marshallese Student Attendance Secondary School"
by Paula L. Faught, is aPProved bY:
Dissertation Chair:
in a Northu,est Arkansas
Ccnter for Lcadership and Learning
Professor and Intcrim Depaftment Head Center for Leadership and Learning
Cllristv SIni
Consultant rvith Script, LLC
Professor end Interirn Department Head Center for Leadership and Leaming
Dissert盤lon Commlttee
Prograrn Director:
Ellen Treadr,vay
Associate Professor of TeachiXg, Leaming, and Leadership
ohn Freeman
」er R
Interirn Dean Graduate Collcgc Dean:
iii
iv
ACKNOWLEDGEMENTS
I would first like to thank my family for all of their support and understanding throughout the process of writing this dissertation. Landyn and Travis, you both have encouraged me countless times, and that encouragement helped me push past barriers and frustrations to achieve this goal. Landyn, it has always been my goal to set a positive example for you as a human being, but it has also been a goal of mine to show you that you can pursue your dreams and accomplish whatever you set your mind to despite challenges you may face along the way. Travis, I could not have done this without you. As you always say, I have been in school since you have known me, and without your continued support, I would not have reached this goal of mine. Thank you for being a wonderful father and example to our son.
To my inspirations, my mother and my grandmother, I deeply appreciate the examples you set for me in pursuing my education. You were both dedicated educators who continually encouraged me to pursue my own education to the fullest. Mom, even though you are not here to see it, I know I have made you proud, and that brings
indescribable joy to my heart. Grandma, thank you for teaching me to read and setting the stage for the rest of my academic career.
To my dad, I know first and foremost, you have told me that you are proud of me for being a good mother and wife who models a Christian attitude for Landyn, but I want to thank you for your support in pursuing my dreams on a personal and professional level. Papa, I also want to thank you for loving and encouraging me throughout my life.
v
To my in-laws, Larry and Trudy, thank you for your help with making sure Landyn had all the love, guidance, and support he needs, even when I was able to be there.
I would also like to thank my cousins and aunts for always encouraging me to be a strong female who is not afraid to follow her dreams. To my school family, thank you for always encouraging me and for being understanding of my shortcomings. To my support group (Angie, Candra, Karla, and Missy), thank you for always helping me stay on track and for encouraging me to never give up. To my committee, Dr. Treadway, Dr. Freeman, and Dr. Smith, thank you for all of your help in guiding and refining my work. I would not have reached this milestone without your leadership.
vi Abstract
Northwest Arkansas has one of the largest populations of Marshall Islanders outside of the Republic of the Marshall Islands. The first know Marshallese immigrant arrived in the 1986, and the first Marshallese student in Northwest Public Schools arrived in the late 1980’s. Since that time, an estimated 10,000–12,000 Marshallese have settled in
Northwest Arkansas (McElfish, 2016, p. 2). Almost 3,000 Marshallese students attend Northwest Public Schools, with Northwest High School having the largest population in the state. There is a perception that Marshallese students have lower attendance rates than peers, and this study was conducted to determine which factors most impact the attendance of Marshallese students attending NHS. Research was conducted through analysis of archival data and one-on-one interviews with stakeholders. Archival data included attendance as well as English language proficiency scores, standardized assessment scores, graduation rate, and disciplinary infractions. Stakeholders interviewed included recent Marshallese graduates (five years or less), Marshallese parents/guardians, Marshallese community liaisons, and non-Marshallese school
personnel to capture a diverse set of perspectives. Findings were analyzed, and the data revealed that family and connectivity to school were the major factors impacting the attendance of Marshallese students at this Northwest Arkansas high school. Based on these findings, implications and recommendations for future research were discussed. As stated by Helen Keller, “Alone we can do so little. Together we can do so much.” I could not have reached this point without the love, support, and guidance from each of you, and I offer my most sincere appreciation to you all.
vii Table of Contents Page AKNOWLEDGEMENTS ... iv ABSTRACT ... vi LIST OF TABLES ... ix LIST OF FIGURES ...x I. INTRODUCTION ...1
II. LITERATURE REVIEW ...22
Schooling in the Marshall Islands ...32
Special Education Identification ...46
Theoretical Frameworks ...55
Implications...57
III. METHODOLOGY ...58
Research Design...60
Data Collection / Data Analysis ...61
Participants ...62
Reflexivity and Ethical Considerations ...64
Interviews ...69
Summary ...78
IV. RESEARCH FINDINGS ...79
Findings from Archival Data ...79
Summary of Archival Data ...97
viii
Conclusions ...150
V. CONCLUSIONS ...151
Summary of Findings ...151
Recommendations for Future Research ...163
Summary ...164
Conclusion ...165
REFERENCES ...167
APPENDICES ...179
Appendix A. Letter of Informed Consent ...179
ix List of Tables
Table 2. 1: Student Enrollment and Teacher Count by Location ...36
Table 2. 2: Elementary Student Enrollment Trends by Location ...36
Table 2. 3: Student Distribution by Grade Level and Age ...39
Table 2. 4: Proficient and Above Scores on the Grade 3 MISAT from 2012-2017 ...43
Table 2. 5: Proficient and Above Scores on the Grade 6 MISAT from 2012-2017 ...43
Table 2. 6: Proficient and Above Scores on the Grade 8 MISAT from 2012-2017 ...43
Table 2. 7: Proficient and Above Scores on the Grade 10 and Grade 12 MISAT from 2012-2017 ...44
Table 2. 8: 2017 MISAT Proficiency by School Type ...44
Table 2. 9: Highest Level of Education for Teachers in the 2016-2017 Academic Year .46 Table 4. 1: ELDA to ELPA21 Conversion Chart ...90
x List of Figures
Figure 1. 1: Race/Ethnicity for NPS ...2
Figure 1. 2: Race/Ethnicity for NHS ...3
Figure 1. 3: Map of the Republic of the Marshall Islands ...5
Figure 2. 1: 2017 Enrollment by Grade Level ...37
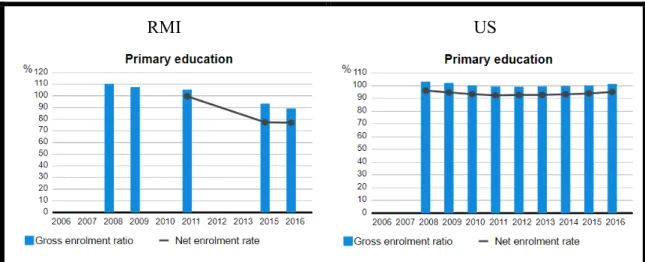
Figure 2. 2: RMI and US Primary Education Gross and Net Enrollment...39
Figure 2. 3: RMI and US Secondary Education Gross and Net Enrollment...40
Figure 2. 4: English Proficiency Levels at the College of the Marshall Islands ...45
Figure 4. 1: Enrollment for Grades Pre-K through 12, 1999-2018 ...81
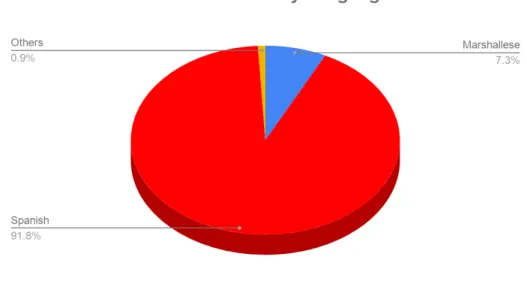
Figure 4. 2: 2018-19 Exits by Language ...83
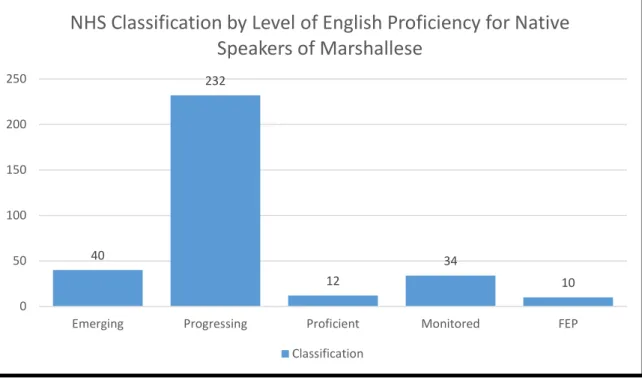
Figure 4. 3: NHS Classification by Level of English Proficiency ...85
Figure 4. 4: Birth Country and Level of English Proficiency ...86
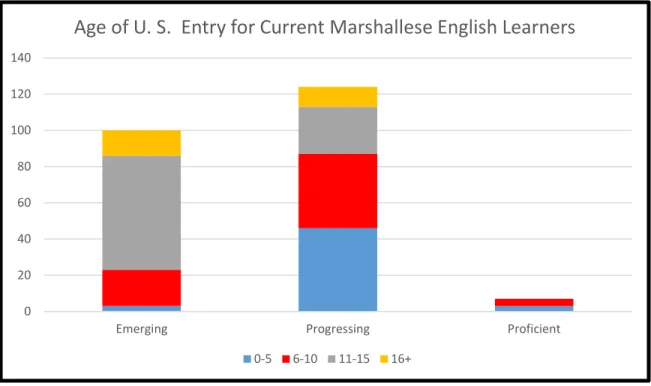
Figure 4. 5: Age of Entry for Current Marshallese English Learners ...87
Figure 4. 6: Age of U. S. Entry for Marshallese Former English Learners ...88
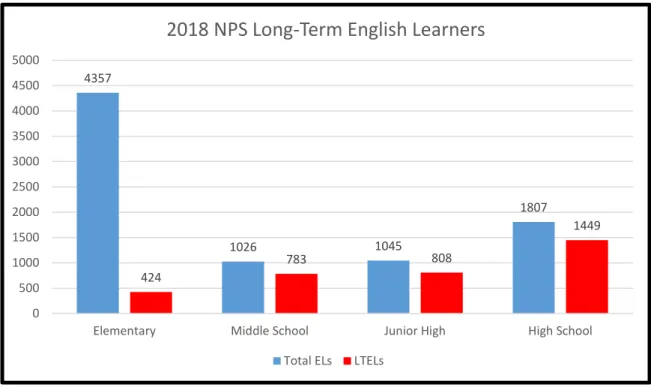
Figure 4. 7: 2018 NPS Long-Term English Learners ...89
Figure 4. 8: NHS Graduation Rates, 2014-2017 ...92
Figure 4. 9: 2018 Act Results for NHS 11th Grade Students ...94
1 CHAPTER 1
Introduction
English Learners (ELs) compose an increasing number of the K-12 student population in the United States (US), with an increase of 84% from 1992 to 2002, when the overall K-12 population only grew by 10%, and these numbers continue to rise (Walqui, 2006). In 2015, the percentage of students attending public schools in the US who are identified as ELs was 9.5%, or 4.8 million students, an increase from 8.1%, or 3.8 million, in the fall of 2000 (National Center for Education Statistics [NCES], 2018). The percentage of ELs in each state varies, ranging “from 1.0 percent in West Virginia to 21.0 percent in California” (NCES, 2018).
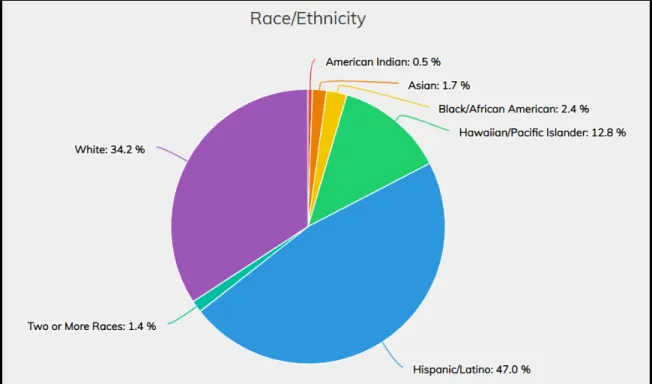
The population of Northwest Arkansas reflects that growth, and one school district in the area educates the highest EL population in the state: Northwest Public Schools (NPS). The Arkansas Department of Education (ADE) Data Center reports that Arkansas public schools educated a total of 479,258 students in the 2017-18 academic year, with 8%, or over 38,000, of those students designated as English Learners; approximately 10,000 of those ELs attend NPS (2018). In 2017-18, NPS had a total enrollment of 21,828 students in Grades K-12, with 45% of those students designated as ELs (Arkansas Department of Education [ADE], 2018). The predominate race/ethnicity of students attending NPS was Hispanic/Latino, at 47% (ADE, 2018). The next largest demographic group was White, with 34. 2%, followed by Hawaiian/Pacific Islanders, who constituted 12.8% of the population (ADE, 2018), with higher concentrations at certain schools within the district. Of the total student population in the state, only 0.8%, or approximately 3,800, were Hawaiian/Pacific Islanders, with 2,793 attending NPS.
2
This number is up from Watts’ 2010 study that revealed a Hawaiian/Pacific Islander population of 1,579 students attending NPS schools, when they comprised 8.39% of the population (p. 1). Jung (2016) reported that those numbers have steadily grown,
reporting that “the Pacific Islander population in the schools has increased steadily by 200 to 300 students each year since 2009” (para. 15).
Figure 1. 1:2017-18 Race/Ethnicity for NPS (ADE, 2018)
One secondary school in NPS educated the largest concentration of
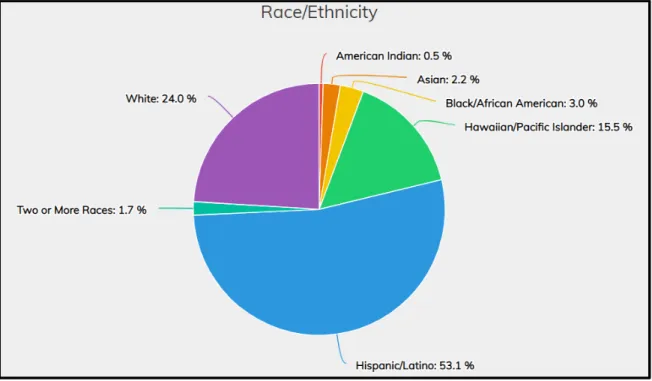
Hawaiian/Pacific Islanders in the state. This particular school, Northwest Arkansas High School (NHS), is the site of this study. NHS educated 2,155 students in the 2017-18 school year, with 46% of students qualifying for services as English Learners. NHS’s predominate race/ethnicity was Hispanic/Latino (53.1%), followed by White (24.0%) and Hawaiian/Pacific Islander (15.5%).
3
Figure 1.2:2017-18 Race/Ethnicity for NHS (ADE, 2018)
The US Office of Management and Budget (OMB) defines the term "native Hawaiian and Other Pacific Islander" as “people who are descended from any of the original peoples of Hawaii, Guam, Samoa, or other Pacific Islands” (U.S. Census Bureau [USCB], 2008, p. 2). Due to the variation among the islands, “Pacific Islanders include diverse populations that differ in language and culture. They are of Polynesian,
Micronesian, and Melanesian cultural backgrounds” (American
Speech-Language-Hearing Association [ASHA], 2010, para. 1). Estimates by the USCB indicate that of the 301.2 million individuals living in the US, “446,164 or 0.1 percent, reported Native Hawaiian and Other Pacific Islander” (ASHA, 2010, para. 1). The National Center for Education Statistics (NCES) reported that in 2015 the student populations of Pacific Islanders, American Indians/Alaska Natives, and individuals of “Two or More Races” comprised less than 40,000 English Learners across the US for each group (National Center for Education Statistics [NCES], 2018).
4
The total Native Hawaiian and Other Pacific Islander (NHPI) population “grew 40% between 2000 and 2010, a rate that approached that of Asian Americans and Latinos,” with over 1.2 million NHPI living in the US at that time (Empowering Pacific Islander Communities and Asian Americans Advancing Justice [EPIC/AAAJ], 2014, p. 5). Approximately 43% of this population is Native Hawaiian, but
the NHPI racial group is incredibly diverse and includes over 20 distinct ethnic groups, all of which are growing at a faster pace than the total population. Micronesian groups such as Chuukese, Kosraean, Marshallese, Carolinian, and Pohnpeian are some of the fastest-growing NHPI ethnic groups. NHPI live in every state in the country, with a majority residing in Hawai‘i and California. Arkansas, Nevada, and Alaska had the fastest-growing populations over the decade. (EPIC/AAAJ, 2014, p. 5)
The estimated total NHPI population in Arkansas according to the 2010 census was 7,849, a 151% increase from 2000; the Marshallese population was 4,324,
constituting the majority of the NHPI population in the state (EPIC/AAAJ, 2014, p.66-67).
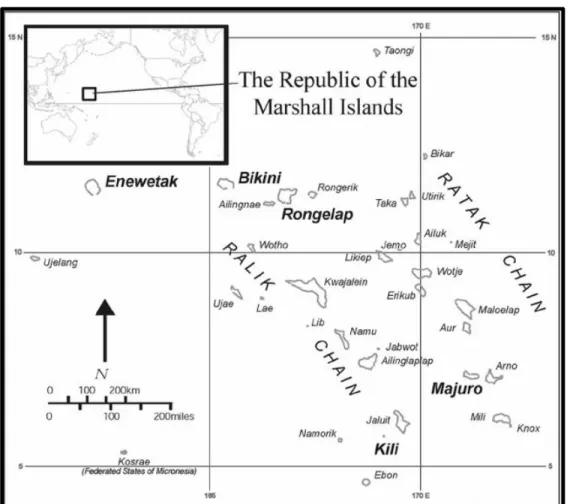
The majority of the Pacific Islander students attending Arkansas schools originate in the Republic of the Marshall Islands (RMI). The Marshall Islands are located about 2,400 miles southwest of Honolulu, Hawaii, and consist of widely dispersed, low-lying coral islands and atolls (Duke, 2014). The territory is isolated and sparsely populated, with the highest point at ten meters above sea level (United States Department of State [DOS], n.d., para. 4). The territory of RMI covers more than 750,000 square miles of ocean, yet the country’s total land
5
mass is only 113 square miles, approximately the size of Washington, DC (Duke, 2014, para. 3).
Figure 1.3. Map of the Republic of the Marshall Islands (Sasha Davis, 2007, p. 216)
Following World War II, the United States gained military and administrative control of the Marshall Islands. From 1946 to 1958, the US conducted 67 nuclear explosive tests in the Marshall Islands, and these tests have had long-lasting ramifications (U.S. Embassy Marshall Islands [USEMI],
2012). Since 1944, the US has occupied the Kwajalein Atoll, and the United States Army (US Army) has maintained a military base with 1,250 residents on the Kwajalein Atoll to conduct base operations and installation management
6
functions. As part of an agreement resulting from the hardships caused by US nuclear testing, the Marshall Islands signed a Compact of Free Association (COFA) with the US in 1983, and this compact allows Marshallese citizens to serve in the US military as well providing them with the opportunity to work, live, and study in the United States without a visa (DOS, n.d.). In 2010, a total of 22,434 Marshallese lived in the United States, a 237% increase from 2000, and 48% of those individuals were under the age of 18 (EPIC/AAAJ, 2014, p. 9-10).
Arkansas is reported to be home to the largest community of Marshallese in the continental United States, and one man, John Moody, is credited for establishing the Marshallese community in Northwest Arkansas (EPIC/AAAJ, 2014). Moody moved from the Marshall Islands to Oklahoma to attend college in 1979 but did not feel that his education in the Marshall Islands adequately
prepared him for college classes in the US. He ended up leaving college to work in a chicken plant in Oklahoma, eventually moving to Springdale, Arkansas, in 1986 to work at Tyson Foods (Leonard, 2005). According to Moody, he told his friends and family back in the Marshall Islands, “If they want a better life, they better come here. So I start bringing them over, little by little. All those people I brought, they still live there today” (Leonard, 2005, para. 37). Moody also stated that he thought his people would return to the RMI, but instead, they brought their family, neighbors, and friends as well (Leonard, 2005, para. 37).
Migration from the RMI to Arkansas first began in the 1980’s, but US census estimates report that Marshallese migration to Arkansas and other areas of the US grew rapidly between 2000 and 2010, growing from 6,700 to 22,434.
7
However, because RMI citizens can travel freely between the RMI and the US without a visa or other resident card, the exact number of Marshallese migrants is unknown (McElfish, 2016). McElfish (2016) utilized school enrollment data to estimate that “~10,000-12,000 live in Arkansas and ~40,000 COFA migrants live in the US” (para. 2). The Marshallese population in Arkansas is so significant that the Empowering Pacific Islander Communities and Asian Americans Advancing Justice (EPIC/AAAJ) organizations included them as one of six areas in the United States with a large enough population to study. As defined by the US Office of Management and Budget, the Fayetteville Metropolitan Statistical Area (MSA) includes Benton County, Arkansas; Madison County, Arkansas;
Washington County, Arkansas; and McDonald County, Missouri. A 2014 report from EPIC/AAAJ noted that the NHPI population in the Fayetteville Metropolitan Statistical Area (MSA) grew 294% over the decade, more than any other racial group. The report identified an NHPI population of 6,000 in the Fayetteville MSA, constituting nearly 87% of the region’s Marshallese American population.
Marshall Islanders migrate to the US for varied reasons, but health, education, and economic hardship are among the leading causes. EPIC/AAAJ suggested that the Marshallese American community in Arkansas continues to grow due to opportunities for education, health care, and jobs in the poultry industry. In 2015, Dan Zak of The Washington Post reported that of students in the RMI, the “most promising students often emigrate — or enlist in the US military — and rarely return. They settle in Hawaii, on the West Coast or in northwest Arkansas, where Marshallese expats represent up to 38 percent of the
8
workforce at major poultry producers such as Tyson Foods” (para. 42). Many reasons contribute to the decision to leave the islands, but Zak (2015) argues “young Marshallese confront problems more emergent than the past: rampant alcohol abuse, schools that don’t provide lunches, and an ongoing suicide
epidemic” (para. 40). Bret Schulte of The New York Times (2012) investigated the massive influx of Marshallese to Northwest Arkansas and found that opportunities for a steady income not always found in the RMI attract many Marshall Islanders, and the $8.70 an hour starting wage at Tyson Foods is “a relative fortune for Marshallese” (para. 7). Schulte (2012) identified the majority of the Marshallese population in Arkansas moved to the northwest corner of the state in hopes of escaping poverty and obtaining access to health care, leaving a home which ranks third in tuberculosis deaths per capita, continues to have cases of leprosy, and abounds with diabetes. The number one cause of death in the RMI is obesity-related diabetes, and researchers attribute high rates of obesity and diabetes to US food aid that contains heavily process food items, such as chicken and white rice (Zak, 2015, para. 40).
Health concerns on the islands stem from nuclear testing as well as a shift in diet due to reliance on processed foods from the US. Marshall Islanders initially became heavily dependent upon such processed foods when nuclear testing poisoned much of their natural food supply, and the continued lack of natural food sources has perpetuated this dependence upon unhealthy processed foods. Nuclear testing conducted by the US caused numerous Marshall Islanders to be exposed to dangerous levels of radiation because residents of the atolls near
9
the test sites were not relocated prior to the detonations. Nearby islanders suffered radiation exposure both due to nuclear fallout and the consumption of
contaminated water and food (McElfish, 2016). Food and water contamination as well as urbanization due to the relocation of citizens from one island to another caused a dramatic change in Marshall Islanders’ diet and lifestyle. McElfish (2016) correlates these changes to disproportionately high incidences of chronic diseases such as obesity, cardiovascular disease, and diabetes. McElfish further suggests that the residual effects of nuclear testing have resulted in the
continuation infectious diseases that are less common in other parts of the world, such as Hansen’s disease (leprosy), tuberculosis, and types of hepatitis. Duke (2014) claims that “[a]ccess to education and health care—critically important for a population that has reduced life expectancy and significant health indicators— also represent key factors that propel a sizeable share of the Marshall Island’s population of 68,000 to the United States” (Duke, 2014, para. 2).
In addition to health care, many Marshallese citizens migrate to the US due to economic hardship. One factor that has negatively affected economic
opportunities in RMI can be traced to the heavy US military presence on the islands. When the US military began to occupy the Kwajalein Atoll, Marshallese citizens were relocated to other islands. Additional Marshallese citizens were relocated due to nuclear testing; both of these relocations led to increased populations on the receiving islands. Prior to the arrival of the United States military, most Marshall Islanders existed on a subsistence lifestyle, eating fish from the bountiful sea and breadfruit grown on the island. Overpopulation has
10
had a detrimental effect on the islanders’ ability to survive on the subsistence lifestyle they had previously enjoyed, as the RMI’s geographic isolation, lack of healthy soil, and inconsistent access to fresh water sources have limited
agricultural production (Duke, 2014). For this reason, it became essential for the Marshallese to earn an income in order to provide food for their families, when previously, fishing and gathering food had successfully sustained them. Duke (2014) reported that the RMI government has had limited success in attracting industry or business investments critical for providing job opportunities for its citizens, and the nation’s ecosystem of coral atolls is extremely fragile
significantly limits other forms of economic development, such as large-scale tourism prominent on other island nations. Climate change has also damaged the RMI’s economy, as rising sea levels pose a significant threat to the low-lying coral islands and atolls. For this reason, the RMI has played a prominent role in the United Nations’ international efforts to reduce greenhouse gases and fight the climate change threatening their native land (Duke, 2014). These challenges have limited the economic opportunities of the Marshallese in their homeland, and McElfish (2016) predicts the combination of climate change and limited employment opportunities in the Marshall Islands would cause increased migration to the United States in the next few decades.
Another significant factor in the high number of Marshallese relocating to the US is the pursuit of education, which Duke (2014) attributes to a “relative absence of educational opportunities in the RMI” (Duke, 2014, para. 4). Hirata (2015) reports receiving an adequate education in the Marshall Islands “is
11
difficult, where schools are underfunded and children have to live on islands away from their families in order to attend school” (p. 20). In his interviews with Marshallese parents in NPS, all of the parents stated education played a role in their decision to come to the United States, believing “completing formal
education in the US will earn their children institutionalized cultural capital (e.g., diplomas and college degrees) that can be translated into economic capital by enabling them to get better-paying jobs” (Hirata, 2015, p. 29). Hirata’s interviews revealed many Marshallese living in Northwest Arkansas have not obtained a high school diploma, and even fewer had pursued post-secondary education. Those interviewed reported a perception that an education obtained in the US is superior to that of the Marshall Islands, viewing the attainment of a US education as the key to financial success for their children. Interview participants expressed a perception that Marshallese who attain post-graduate and professional degrees are seen in even higher regard by their community (Hirata, 2015). Opportunities for completing high school in RMI is difficult due to limited secondary school opportunities, and earning these post-secondary degrees at home in the Marshall Islands is even more of a challenge. Majuro, the RMI capital, includes the College of the Marshall Islands (CMI) as well as a branch of the University of the South Pacific (USP), but their academic programs are rather limited when compared to those offered in the US. Even when a program of study is offered by CMI or USP, “there remains a widely held perception among Marshall Islanders that educational institutions in the United States are of better quality and more prestigious” (Duke, 2014, para. 10).
12
According to current Arkansas Governor Asa Hutchinson, “Arkansas contains the largest Marshallese population in the continental United States with the highest concentrations in Carroll, Madison, Washington, and Benton counties” (Gaps in Services to Marshallese Task Force [GAPS], 2016, p. 3). This growing Marshallese workforce has drastically increased the number of Pacific Islander students in Northwest Arkansas schools. One district, Northwest Arkansas School District (NPS) has seen a dramatic influx of Pacific Islander students in the past two decades; of the 3,800 Hawaiian/Pacific Islander students in the state, over 2,600 of those students attend NPS(ADE, 2018).
Statement of the Problem
Many factors impact the success of Marshallese students attending Arkansas schools. Marshallese culture and language differ greatly from that of the United States. Jung (2016) states “[l]anguage is the greatest and most obvious barrier for the
Marshallese population, and Arkansas does not allow the use of languages other than English in its classrooms — the state has been English-only by law since 1987” (para. 16). Arkansas is not the only English-only state in the US. Jung (2016) reported that four other states (Mississippi, North Carolina, North Dakota, and South Carolina) joined Arkansas in 1987 in banning the use of another language in the classroom. In 1998, California passed a law that significantly limited the implementation of bilingual education programs in the state. In the 1980’s, Massachusetts and Arizona played prominent roles in the dual-language movement but have begun moving toward a model where English abilities determine a student’s placement for instruction. At this time,
13
only 19 states allow the use of languages other than English in the classroom (Jung, 2016).
Among all NHPI ethnic groups in the US, Marshallese (78%) are the most likely to speak a language other than English at home, with rates higher than any racial group (EPIC/AAAJ, 2014, p. 24). In the Fayetteville Arkansas Metropolitan Statistical Area (MSA), the number is even higher, with 85% of Marshallese Americans speaking a language other than English in their homes (EPIC/AAAJ, 2014, p. 57). Forty-one percent of all Marshallese in the US are considered Limited English Proficient (LEP), again the highest of all racial groups (EPIC/AAAJ, 2014, p. 24). Once again, the percentage in the Fayetteville MSA is even higher at 55% (EPIC/AAAJ, 2014, p. 57).
More challenging than simply having another language in the home, 26% of
“Marshallese American households are linguistically isolated, meaning that everyone in the household over the age of 14 is LEP,” significantly limiting these students’ access to proficient English language models to school (EPIC/AAAJ, 2014, p. 24). In the
Fayetteville MSA, this number is 47%, again higher than any racial group (EPIC/AAAJ, 2014, p. 57).
In addition to language barriers, research conducted by Portland State University suggests that certain cultural traits specific to the Marshallese “may be in contrast to the American ideals of status equality, individualism, nuclear family, and future-focused time orientation” (Feuerherd, Hunt, & Virani, n.d.). These differences can impact a student’s ability to adapt to social, cultural, and academic expectations in the United States.
Outside factors impact students’ ability to learn English and achieve
14
impact their acclimation to Arkansas schools. Cultural factors stemming from a move from an island to a landlocked region impact adjustment when “islanders discover that they will need to buy a car to get to work and, before that, they will need to pass a driver’s test, which is not offered in their language. Many must pay rent for the first time. They puzzle over the American obsession of time, and they are ignorant of bureacracy and health care systems” (Schulte, 2012, para. 7). Additionally, many of NPS’s Marshallese students fall into a segment of the EL population that is frequently excluded from research, “namely older English-learner students with interrupted formal education . . . including unaccompanied minors separated from parents and other family” (Mitchell, 2016, para. 3). In many cases, their families make great sacrifices to send their children ahead to live with relatives while they save money to relocate themselves to the US. At times, these students face additional challenges with adjustment, as they do not always have strong parental support in the home.
There is limited research available about Marshallese students attending US schools. In one study conducted in the Spokane School District in Spokane, Washington, the 2016 four-year graduation rate for Native Hawaiian/Other Pacific Islanders was an astonishing 51.4%, while the rate for the general population was 85.4% (Francovich, 2017). A 2014 EPIC/AAAJ study found that Marshallese, Fijian, and Tongan Americans are the NHPI ethnic groups who are least likely to earn a high school diploma or GED. The study found that in the Fayetteville MSA, roughly 51% of NHPI students in the 2011 four-year cohort graduated from high school, lower than any other racial group and significantly below the average rate of 81%. Study findings suggest that Marshallese American adults in the area
15
have low levels of educational attainment, with 54% possessing a high school degree or GED and only 1% holding a bachelor’s degree (EPIC/AAAJ, 2014). This data suggests that Marshallese students lag dramatically behind their non-Marshallese counterparts in a four-year graduation rate, which is a significant indicator of student achievement.
Claudio Sanchez (2017) of National Public Radio reports that the national graduation rate for English Learners (63%) lags significantly behind that on non-English Learners (82%). In Arkansas, the graduation rate is slightly lower than that of non-English Leaners, at 84% for ELs compared to 86.9% for non-ELs, but this number does not identify the graduation rate of different language minority groups. This achievement gap for the combined ELL population is enough to warrant investigation, but data from other states suggest that the achievement gap for Marshallese students is drastic, making an investigation into Marshallese student achievement in Arkansas schools especially significant.
One factor that can significantly inhibit a student’s ability to achieve in an Arkansas schools is a high rate of absenteeism. If students are not at school, teachers do not have the opportunity to support the students in moving forward in their academic development. For this study, the researcher is a scholar practitioner practicing in a large high school, Northwest Arkansas High School (NHS), in Northwest Arkansas with a large population of Marshallese students and has observed a significant number of absences for Marshallese students. I hypothesize that school systems in Arkansas may not provide the highest yield services to optimize student attendance for Marshallese students due to a lack of understanding of the students’ culture.
16
Students who are not academically successful may experience social, legal, and academic consequences. One area of concern is students referred for special education. Cultural and linguistic differences that result in comparatively low achievement may lead schools to over-refer Marshallese students for special education services and under-refer them for advanced studies.
Teachers deeply desire their students to be successful, and when a student exhibits a lack of expected progress, schools may be prone to refer students for special education services. Educators, in an effort to support struggling learners, may mistake stages of second language acquisition for learning disabilities, resulting in inappropriate referrals. When that happens, schools may struggle to conduct valid eligibility evaluations that can distinguish between language differences and language disabilities. Once a student is referred, the student may then be subjected to culturally biased assessments performed by psychological examiners who are not knowledgeable about typical second language acquisition phases or about the culture of the student. If students are inaccurately identified for special education services, they may be subjected to inappropriate
educational services, which can prevent them from reaching their full academic potential. The National Research Council, as cited by Raj (2016), suggests that the label required for a student to receive additional resources indicates substandard performance, and even though special education identification is meant to provide a student with access to supplemental resources, the label may also be harmful to the child, as it comes with lowered expectations by the teacher, peers, and the student himself. Raj further claims “the harm of being labeled and subsequently treated as a child with a disability can be
17
significant. It can equate to stigma, lowered educational opportunity, and increased contact with the juvenile justice system (Raj, 2016, p. 387).
Research is not available regarding the number of Marshallese students who may have been over-referred for special education, and this study will investigate the number of Marshallese special education students as compared to the total number of students identified for special education services in the district.
Purpose of the Study
The purpose of the study is to examine the factors that impact the attendance of Marshallese students in NHS. The researcher works at NHS, the secondary school with the highest population of Marshallese students in the state, making the topic significant to me as an educator as well as contributing to the educational field at large.
Significance of the Study
The intent of this study is to contribute to the education field by providing useful information regarding how to appropriately educate Marshallese students attending schools in Arkansas. The researcher will collect and analyze data regarding Marshallese students in an urban secondary school in Northwest Arkansas through surveys and interviews. The goal of the study is to deepen educators’ understanding of the needs of Marshallese students and families attending schools in this area of the United States.
Definition of Terms
Asian – a person having origins in any of the original peoples of the Far East, Southeast Asia, or the Indian subcontinent, including, for example, Cambodia, China, India, Japan, Korea, Malaysia, Pakistan, the Philippine Islands, Thailand, and Vietnam (Musu-Gillette et al., 2017, p. 161)
18
Culturally and Linguistically Diverse (CLD) – an education term used by the US Department of Education to define students enrolled in education programs who are either non-English proficient (NEP) or limited-English proficient (LEP). The term is also used to identify students from homes and communities where English is not the primary language of communication. (Gonzalez, Pagan, Wendell, & Love, 2011, p. xiii)
Compact of Free Association (COFA) – an agreement signed between the United States and the Republic of the Marshall Islands giving the United States full authority and responsibility for security and defense of the Marshall Islands. The Government of the Marshall Islands is obligated to refrain from taking actions that would be incompatible with these security and defense responsibilities. Eligible Marshallese citizens may work, live, and study in the United States without a visa, and serve in the US military (DOS, n. d., para. 2).
Child Study Team (CST) – a multidisciplinary group of school personnel who meet to identify the academic, behavioral, emotional and/or needs of a struggling student who has not shown significant progress with prior interventions (Austin Independent School District Learning Support Services [AISDLSSD], n.d.)
English Learner (EL) – a student who is unable to communicate fluently or learn
effectively in English, often coming from non-English-speaking homes and backgrounds. These students who typically require specialized or modified instruction in both the English language and in their academic courses (https://www.edglossary.org/english-language-learner/)
English as a Second Language (ESL) – also known as English Language Development (ELD), a program of techniques, methodology, and special curriculum designed to teach
19
EL students explicitly about the English language, including the academic vocabulary needed to access content instruction, and to develop their English language proficiency in all four language domains (i.e., speaking, listening, reading, and writing). ESL
instruction is usually in English with little use of the EL students’ primary language(s). (United States Department of Justice and United States Department of Education USDOJ/USDOE], 2015)
English to Speakers of Other Languages (ESOL) – a program for teaching English to individuals who do not have English as their first language
Individuals with Disabilities Education Act (IDEA) – a law that makes available a free, appropriate public education to eligible children with disabilities throughout the nation and ensures special education and related services to those children.
The IDEA governs how states and public agencies provide early intervention, special education, and related services to more than 6.5 million eligible infants, toddlers,
children, and youth with disabilities. (United States Department of Education [USDOE], n.d.)
Individualized Education Program (IEP) – a written document that is developed for each eligible child with a disability addressing current level of performance, annual goals, special education and related services, participation with nondisabled students,
participation in state and district-wide tests, dates and places, measuring progress, and transition service needs (when age appropriate) (United States Department of Education Office of Special Education and Rehabilitative Services [OSERS], 2000)
L1 – an individual’s native or primary language L2 – an individual’s second language
20
Language Minority Student (LMS) – a student who speaks a language other than English, whether or not the student also speaks English. The student may have grown up, or lived in, an environment where a non-English language was present and influential (whether they were born in the United States or any of its jurisdictions, or because they were born and raised in a different country). (Encyclopedia of Education, n.d.)
Marshallese – a native or inhabitant of the Marshall Islands
Native Hawaiian or Pacific Islander (NHPI) – a person having origins in any of the original peoples of Hawaii, Guam, Samoa, or other Pacific Islands (Musu-Gillette et al., 2017, p. 161)
National Center for Educational Statistics (NCES) – the primary federal entity for collecting and analyzing data related to education (National Center for Education Statistics, n.d.)
Northwest Arkansas High School (NHS) – pseudonym for the high school used in this study
Northwest Arkansas Public Schools (NPS) – pseudonym for the school district used in this study
Office of Civil Rights (OCR) – The US Department of Health and Human Services (HHS) Office for Civil Rights (OCR) enforces federal civil rights laws, conscience and religious freedom laws, the Health Insurance Portability and Accountability Act (HIPAA) Privacy, Security, and Breach Notification Rules, and the Patient Safety Act and Rule (United States Department of Health and Human Services [HHS], n.d.)
21
Republic of the Marshall Islands (RMI) – The Republic of the Marshall Islands (RMI) is a nation of about 60,000 people living on 29 coral atolls and five low-lying islands in the central Pacific, mid-way between Hawaii and Australia. The RMI adopted its
Constitution in 1979 and signed the Compact of Free Association with the United States in 1986. (Embassy of the Republic of the Marshall Islands to the United States of America, n.d.)
Response to Intervention (RTI) – a multi-tier approach to the early identification and support of students with learning and behavior needs. The RTI process begins with high-quality instruction and universal screening of all children in the general education
classroom. Struggling learners are provided with interventions at increasing levels of intensity to accelerate their rate of learning. These services may be provided by a variety of personnel, including general education teachers, special educators, and specialists. Progress is closely monitored to assess both the learning rate and level of performance of individual students. Educational decisions about the intensity and duration of
interventions are based on individual student response to instruction. RTI is designed for use when making decisions in both general education and special education, creating a well-integrated system of instruction and intervention guided by child outcome data. (RTI Action Network, n.d.)
22
CHAPTER 2 Review of the Literature
The purpose of this literature review is to research possible factors that impact the attendance of Marshallese students in US schools. The topic is significant due to its potential impact on the academic achievement among Marshallese students attending Northwest Arkansas High School (NHS). The Marshallese race/ethnicity is not well-known across the United States, and federal reporting combines it with other students of Native Hawaiian/Pacific Islander (NHPI) heritage, but a large population of Marshallese students attend NHS.
A major source for this review is Status and Trends in the Education of Racial and Ethnic Group 2017 (Status and Trends), a report from the National Center for Education Statistics (NCES). This report examines the educational progress of US students by analyzing differences in educational participation and attainment of students in the racial/ethnic groups of White, Black, Hispanic, Asian, Native Hawaiian or Other Pacific Islander, American Indian/ Alaska Native, and Two or more races (Musu-Gillette et al., 2017, p. 1). In Higher Education: Gaps in Access and Persistence Study (2012), Ross et al. argues that racial/ethnic groups in the United States experience disparate levels of educational participation and attainment of achievement measures. Citing Reardon and Portilla, Musu-Gillette et al. (2017) acknowledge school readiness gaps narrowed between 1998 and 2010, but they note progress was uneven among
racial/ethnic groups. The success of all students is critical, yet it does not occur equally across demographics, making the measurement of population growth, diversity, and
23
achievement critical for anticipating the tools necessary for schools to meet the needs of a diversifying student population (Musu-Gillette et al., 2017).
Status and Trends analyzes recent data collected on demographics, student achievement, student behaviors and persistence, postsecondary education, and outcomes among preprimary, elementary, and secondary education to highlight targeted areas of improvement necessary to better serve segments of the student population who may be underserved (Musu-Gillette et al., 2017). National information specific to Marshallese is difficult to obtain, but it can also be challenging to obtain accurate information for the broader group of NHPI students. For the Status and Trends report, certain indicators provide details for Native Hawaiian/Pacific Islanders, while other indicators include Native Hawaiian/Pacific Island in the Asian racial/ethnic category. In 2003, NCES expanded race/ethnicity questions to include information on people of two or more races, and Native Hawaiian/Pacific Islander data was collected separately from Asian data. For the Status and Trends report, individuals self-report the race/ethnicity with which they identify, but Native Hawaiian/Pacific Islanders are not specifically included in all indicators. The report defines Asian as a person having origins in any of the original peoples of the Far East, Southeast Asia, or the Indian subcontinent, including, for example, Cambodia, China, India, Japan, Korea, Malaysia, Pakistan, the Philippine Islands, Thailand, and Vietnam (Musu-Gillette et al., 2017). Native Hawaiian or Other Pacific Islanders are defined as a “person having origins in any of the original peoples of Hawaii, Guam, Samoa, or other Pacific Islands, and the shortened form used is Pacific Islander” (Musu-Gillette et al., 2017).
24
For the purpose of reporting the data analyzed, Musu-Gillette et al. selected 28 indicators of educational performance by which to compare students from diverse racial and ethnic backgrounds, and the 28 indicators were divided into six categories, including Demographics, Education Participation, Achievement, Student Behaviors and
Persistence, Postsecondary Education, and Outcomes of Education. Due to relatively small populations of American Indian/Alaska Native and Pacific Islander, limited data exists specifically for NHPI students, resulting in measurement difficulties when
conducting statistical analyses, and these small sample sizes diminish the reliability of the results. Musu-Gillette et al. (2017) report that the data for NHPI students tend to have higher standard errors than data for other populations which results in differences that appear significant even when they are not statistically significant, and these statistics are excluded in the NCES report.
Further complicating educational research of NHPI students is the inclusion of Asian students who are not of NHPI origin in the published data. When the data for Asian and Pacific Islander students are combined into one category, the combined category masks significant variances between subgroups (Musu-Gillette et al., 2017, p. 4). The 1997 “Revisions to the Standards for the Classification of Federal Data on Race and Ethnicity” released by the US Office of Management and Budget (OMB) reported that the organization, which conducts US census efforts, elected to follow the Interagency Committee for the Review of the Racial and Ethnic Standards’ recommendation to
modify its practice of combining Asian and Pacific Islanders and create two distinct categories, “Asian” and “Native Hawaiian or Other Pacific Islander” (p. 58782). The two categories remain combined in some data sources, yet 96% of all Asian/ Pacific Islander
25
5- to 24-year-olds are Asian, not Pacific Islander; therefore, the Asian/Pacific Islander combined category predominately represents the Asian population, not Pacific Islanders (Musu-Gillette et al., 2017, p. 4). Certain data sources began collected separate data for the two subgroups in 2000, as prescribed by the OMB, and when the two subgroups are separated, significant gaps appear. The majority of data reviewed during this literature review suggest a discrepancy in student achievement between NHPI students and their non-NHPI Asian peers on indicators of educational performance.
Data collected by Musu-Gillette et al. (2017) reports that from 2000 to 2016, the percentage of school-age children who were White and Black decreased while the
percentage of school-age children from other racial/ ethnic groups increased. In this time period, the percentage of Asian students grew slightly from 3% to 5%, and the percentage of Pacific Islanders students remained at less than 1% during this time (Musu-Gillette et al., 2017, p. 10). The traditional college-age population of 18- to 24-year-olds increased, and the percentage of Whites in this age group decreased while the population
percentages of other races/ethnicities increased. The percentage of college-age Asians grew from 4% to 6%, while the percentage of college-age Pacific Islanders remained less than 1%, even with an increase since 2000 (Gillette et al., 2017, p. 11). Musu-Gillete et al. (2017) also reported that during that same time, the overall US Asian population increased by 72%, climbing from 10.5 to 18.0 million, while the Pacific Islander population increased by 55%, with a climb from 370,000 to 572,000 (p. 6). The percentage of Asians in the total population increased from 4% to 6%, while the
percentage of Pacific Islanders remained below less than 0.5% (Musu-Gillette et al., 2017, p. 9). There is a significant difference between the amount of individuals residing
26
in the US from Asian and from Pacific Islander populations, and lumping these two groups together provides dangerously misleading information.
One indicator in the Status and Trends report examines the relationship between absenteeism and achievement. Musu-Gillette et al. (2017) identify a strong relationship between absenteeism and achievement, stating students with high rates of absenteeism have a higher likelihood of suffering academic difficulties, making them less likely to complete school if no intervention takes place. The National Assessment of Educational Progress (NAEP) gathers information regarding student performance in the areas of mathematics and reading in grades four, eight, and 12 across the United States. In order to analyze the relationship between absenteeism and achievement, NAEP collected data from eighth grade students, focusing on students who reported zero absences as well as those reporting over ten absences in the last month of school prior to taking the
assessment. NAEP then disaggregated the data by race/ethnicity and analyzed differences in the achievement of eighth grade students on reading and mathematics portions of the NAEP by the number of absences and race/ethnicity. This indicator revealed a significant discrepancy between the data of Asian and NHPI students. In 2015, the percentage of Asian eighth grade students who reported that they had zero absences from school in the last month was 65%, while the percentage of NHPI students was only 47% (Musu-Gillette et al., 2017, p. 54). Had these two categories been
averaged together, the much lower perfect attendance percentage for the NHPI students would have been masked by the much higher percentage for Asian students. The percentage of NHPI students reporting zero absences was three points higher than those for White students; however, 5% of NHPI students reported missing more than ten days
27
in the last month, while only 1% of White and Asian students reported this level of absences (Musu-Gillette et al., 2017, p. 54). While a higher percentage of NHPI students reported zero absences than their White peers (gap of 3), a higher percentage of NHPI students than their White or Asian peers (gap of 5) also reported having more than ten absences(Musu-Gillette et al., 2017, p. 54). NAEP data identified correlation between students with fewer absences achieving higher scores than their peers with more absences on the NAEP 2015 mathematics assessment. Reporting standards were not met for NHPI students with more than ten absences on the reading assessment, but a comparison can be made between those missing zero days, 1-2 days, 3-4 days, and 5-10 days.
NAEP data revealed that eighth-grade White, Black, Hispanic, and Pacific Islander students who self-reported zero absences from school in the last month had higher reading scale scores than eighth-grade students who had any other number of absences; however, even with NHPI students had zero absences, they still scored 13 points lower than White students and 19 points lower than Asian students with zero absences (Musu-Gillette et al., 2017, p. 55-56). With 1-2 absences, NHPI students scored 26 points lower than their White peers and 31 points lower than their Asian peers with the same absences; when the NHPI students missed 3-4 days, they were outscored by their White and Asian peers by 16 and 18 points, respectively (Musu-Gillette et al., 2017, p. 55-56). White students with 5-10 absences outscored NHPIs by 26 points, and Asian students with the same absences outscored NHPI students by 35 points (Musu-Gillette et al., 2017, p. 55-56). These data suggest that higher attendance rates lead to higher achievement on standardized measurements of reading and mathematics.
28
Another area in which differences between Asian and NHPI students arise is living arrangements. Musu-Gillette et al. (2017) examined the living arrangements and poverty status of children under the age of 18, revealing a lower percentage of NHPI children (65%) than of Asian children (82%) who lived with married parents (p.6). In 2014, 25% of NHPI children lived with a female parent with no spouse present, more than double the percentage for Asian children, and the percentage of children living with a male parent with no spouse present was lower for Asian children (5%) than any other racial/ethnic group (NCES, 2017, p. 6-16). Despite the fact that only 65% of NHPI children live in a home with married parents, Marshallese families have an average household size of 5.7, compared to an average of 3.4 for the combined NHPI community (EPIC/AAAJ, 2014, p. 20). In the Fayetteville MSA, the average Marshallese American household included 6.0 individuals, significantly higher than the regional average of 2.6. This number was the highest of all racial/ethnic groups (EPIC/AAAJ, 2014, p. 58).
Poverty levels also vary greatly between Asian and NHPI students. Musu-Gillette et al. (2017) reported that in 2014, approximately 21% of all US children under age 18 were living in poverty, which is significant because research identifies a correlation between early childhood poverty and lower-than-average academic performance, beginning in kindergarten and extending through high school, leading to lower-than-average rates of school completion (p. 20-24). The report further revealed that in 2014, 27% of NHPI children in the US were living in poverty, which is more than double the number of Asian students (12%) living in poverty (Musu-Gillette et al., 2017, p. 24). From 2007 to 2011, the number of NHPI living in poverty increased 56%, this highest of any racial/ethnic group, and of the NHPI group, Marshallese, Tongan, Samoan, and
29
Palauan Americans had higher-than-average poverty rates and lower per capita incomes than any other racial/ethnic (EPIC/AAAJ, 2014, p. 6). Of all NHPI groups, Marshallese Americans experience the greater challenges than any other racial/ethnic group across multiple measures of income. Nationally, 73% percent of Marshallese Americans are low-income, 49% live in poverty, and their per capita income of $7,097 is the lowest of all racial/ethnic groups (EPIC/AAAJ, 2014, p. 17). In the Fayetteville MSA, those numbers are even more alarming. Seventy-seven percent of Marshallese Americans in the Fayetteville MSA are low-income, and 52% live in poverty, much higher than the regional average 37% and 15% respectively (EPIC/AAAJ, 2014, p. 58). These numbers are even worse among the youth. Sixty-four percent of Marshallese American children in the Fayetteville MSA live in poverty, over three times higher than the regional average of 20% (EPIC/AAAJ, 2014, p. 58).
Other indicators in Musu-Gillette et al.’s 2017 Status and Trends report delved into special demographics for students who received additional support in order to achieve academic success. The seventh indicator for the report was English Language learners (ELs). In 2014, approximately 4.7 million public school students participated in programs for ELs, and while Hispanic students made up the majority of the group, Asian students comprised the second largest group, with an approximate total of 496,400 participants (Musu-Gillette et al., 2017, p. 38). NHPI students constituted less than 1% (25,600 students) of the total EL program participants.
Another indicator, Students with Disabilities, also referred to a special student population who may require additional support to achieve optimal academic success. In 2013-14, about 6.5 million students ages 3-21, about 13% of the total population, were
30
served for disabilities that qualify under the Individuals with Disabilities Education Act (IDEA), and NHPI and Asian student participants both fell below the average, at 11% and 6%, respectively (Musu-Gillette et al., 2017, p. 40). The percentage of students served for disability types vary by race and ethnicity. Data detailing the distribution by category revealed that a significantly higher number of NHPI students (42%) received services for a specific learning disability than Asian students (22%); conversely, a higher percentage of Asian students (27%) received services for a speech or language
impairment, while NHPI students only constituted 14% of the population (Musu-Gillette et al., 2017, p. 41). Another area of significant discrepancies between Asian and NHPI students was the category of autism. A higher percentage of Asian students (19%) received services under the category of autism than any other race/ethnicity, with NHPI at only 7% (Musu-Gillette et al., 2017, p. 41).
Musu-Gillette et al.’s 2017 Status and Trends report further reveals data regarding the reason that students ages 14-21 exited school, including graduating with a regular diploma, an alternative certification, and dropping out of school. Seventy percent of Asian students and 66% of NHPI students with disabilities exit with a regular high school diploma, and sixteen percent of Asian and 10% of NHPI students with disabilities receive an alternative certification (Musu-Gillette et al., 2017, p. 42). Twenty-one percent of NHPI students with disabilities drop out of high school, while only 9% of Asian students drop out, the lowest of any race/ethnicity (Musu-Gillette et al., 2017, p. 42).
Indicators from national standardized assessments in the areas of reading and mathematics also highlighted discrepancies between NHPI students and their peers. In 2015, White fourth grade students taking the reading portion of the National Assessment
31
of Educational Progress (NAEP) scored 17 points higher than NHPI students, while Asian students scored nine points higher than White students; in the same year, White eighth grade students taking the reading portion of the NAEP scored 19 points higher than NHPI students, while Asian students scored seven points higher than White students (Musu-Gillette et al., 2017, p. 46). Reporting levels were not met for 12th grade in 2015, but 2013 data revealed that 12th grade White students scored eight points higher than NHPI students and one point higher than Asian students on the reading portion of the NAEP (Musu-Gillette et al., 2017, p. 48). In all three grade levels, NHPI students underperformed their White and Asian peers.
2015 NAEP results for mathematics revealed that fourth grade White students scored 17 points higher than NHPI students, but Asian students scored 11 points higher than White students (Musu-Gillette et al., 2017, p. 51). For eighth grade students taking the mathematics portion of the NAEP, White students scored 16 points higher than NHPI students, but Asian students scored 15 points higher than White students (Musu-Gillette et al., 2017, p. 50). Results were similar for 12th grade students. As with the reading assessment, data was not available for 2015, but 2013 mathematics results show that White students scored 11 points higher than NHPI students, but Asian students scored 12 points higher than White students (Musu-Gillette et al., 2017, p. 52).
An additional indicator analyzed various levels of educational attainment, which is significant because it impacts the median income of adults. Adults with higher levels of education earned higher median incomes while facing lower unemployment rates than their less educated peers (Musu-Gillette et al., 2017, p. 126). Indicator 16 analyzed high school status dropout rates for 16-24 year olds, which is defined as “no longer attending
32
school (public or private) and do not have a high school level of educational attainment” (Musu-Gillette et al., 2017, p. 78). Data from 2014 suggests that the 3% status dropout rate for Asian 16- to 24-year-olds was lower than that of all other groups measured; however, the rate for NHPI (10%) was higher than the rates for students of any other race/ethnicity (Musu-Gillette et al., 2017, p. 79).
In addition to racial/ethnic differences, status dropout rates varied between US- and foreign-born individuals ages 16-24 living in the United States. In 2014, the status dropout rates for Hispanic, Asian, and NHPI 16- to 24-year-olds born in the United States were lower than their peers who were born outside of the US. This gap was 16
percentage points higher for NHPI born outside the US than for those born in the US (23% vs. 7%) but only two percentage points for Asians (Musu-Gillette et al., 2017, p. 80). Approximately 62% of Marshallese living in the Fayetteville MSA were foreign born, while the average in the area is only 10% (EPIC/AAAJ, 2014, p. 57). In NPS schools, 59.1% of students in Grades 8-12 who identify Marshallese as their home language are foreign-born, and 57.4% of the Marshallese students at NHS are foreign-born. High school students who enroll in NPS in their first year in the US are able to attend a Language Academy at the high school across town, making the NHS percentage lower than it would be otherwise.
The researcher has observed disparities in her own school as well as those found in Status and Trends. It is each school’s duty to ensure that every student, including Pacific Islander English Learners (ELs), can meaningfully participate in educational programs and services, regardless of race, color, or national origin (Office for Civil Rights [OCR], 2015). From 2006 to 2015, the number of ELs in the State of Arkansas
33
has risen 85%, (Bureau of Legislative Research [BLR], 2015). Due to cultural and linguistic differences, ELs face academic challenges in classrooms across the United States. When ELs, who already struggle to learn content presented in a language they do not fully understand, have a non-Western culture that is vastly different from the
predominant culture of the school, they experience additional impediments to their learning.
Schooling in the Marshall Islands
In addition to language differences, some students arriving to NHS from the Marshall Islands may struggle due to deficiencies in their prior schooling. While this does not characterize all students from the Marshall Islands, some students may experience challenges based on their educational background. These deficiencies may due to a lack of education or the quality of education received.
Marshallese educational system. A 2018 report from the Education Policy and Data Center (EPDC), an organization that provides global education data, states that the academic year in the Marshall Islands runs from August to July, and the official at which students should enter primary school is six (p. 1). A 2015 report from the World
Education Forum (WEF) describes the RMI educational system and states that the Marshall Islands school system requires 200 school days with 1,750 minutes of
instruction each week in grades 1-3 and 1,800 minutes in grades 4-8 (p. 6). In addition to mandatory core classes, educators must provide weekly instruction for elective classes, including career education, health and population, physical education, and art/music. Curriculum at the primary and secondary levels centers on English Language Arts, Marshallese Language Arts, Math, Science, and Social Studies/Marshallese Studies. The
34
language of instruction in grades K-3 is Marshallese except for English Language Arts classes, but beginning in grade 4, the official language of instruction is reversed, and students receive instruction primarily in English—with the exception of Marshallese Language Arts classes. Despite this regulation, many educators continue using
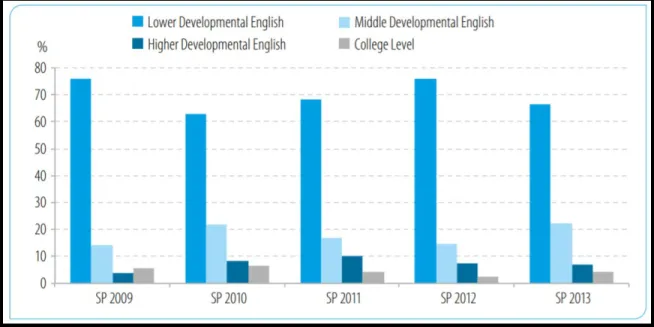
Marshallese, as the language on instruction, especially when they are weak in English themselves. Many students arriving in NHS report being “fluent” in Marshallese, but many of them have weak literacy skills in their L1, reducing the opportunity for a transfer of skills from L1 to L2. Additionally, although children attending schools in RMI learn English beginning in Kindergarten, students entering college demonstrate poor literacy skills in English. The College of Marshall Islands conducts language assessments to determine incoming students’ literacy levels, and the vast majority of the students score poorly, resulting in their placement in the lower developmental English class (UNESCO, 2015, p. 31).
WEF (2015) reports that students spend six years in primary, four in lower
secondary, and two in upper secondary schools. In 2018, the Marshall Islands had 13,000 students enrolled in primary and secondary schools, with 59% (8,000) enrolled in primary schools; this number is up from 2015, when the Marshallese educational system served “nearly 12,000 primary school students (9,588 public and 2,063 private) in 93 schools and nearly 3,000 secondary students (2,158 public and 739 private) in 17 schools” (WEF, 2015, p. 4-5).
The majority of schools in RMI are divided into primary schools with grades 1-8 and secondary schools with grades 9-12. A 2017 report from the Marshall Islands Public School System (MIPSS) states that RMI provides “95 public and private elementary
35
schools and 17 public and private secondary schools spread out over 23 atolls and islands,” which makes data collection on the educational system difficult (p. 2). Education in RMI is compulsory for children ages 5-18, and public schools are free; private schools charge a fee for tuition. The educational system in RMI is based on the American model of education, consisting of early childhood education, elementary, high school, and college/university. MIPSS (2017) reports that some private schools offer early childhood education for children ages 3-4, but no public early childhood services are offered. There are 80 public and 15 private elementary schools, six public and 11 private high schools, and two college level institutions (p. 6).
Schools in RMI are evaluated for accreditation and assigned a level, typically one through four. According to MIPPS (2017), a Level 1 school partially meets the
accreditation standard, a 2 substantially complies, a 3 complies with the accreditation standards, and a 4 exceeds the accreditation standards (MIPPS, 2017, p. 7). MIPPS (2017) reports that sixty RMI schools are assigned a Level 2, 35 a Level 3, and one a Level 4 (p. 7-10). Six schools received an international WASC rating from the Western Association of Schools and Colleges, which is a major accrediting agency in the United States. Schools with four or more Level 1 ratings are classified as Special Measure. Four schools received a Special Measure rating, which means that the school that has not complied with Public School System (PSS) accreditation standards and requirements. These schools have not implemented a plan or program to address identified defects or shortcomings within an established time period. Five schools are identified as SDA, which means the school is accredited through the Seventh-day Adventist accreditation process. One school, RongRong Protestant Elementary School, was rated as “not
36
chartered,” and it is unclear what this designation means. This school has two teachers and 25 students.
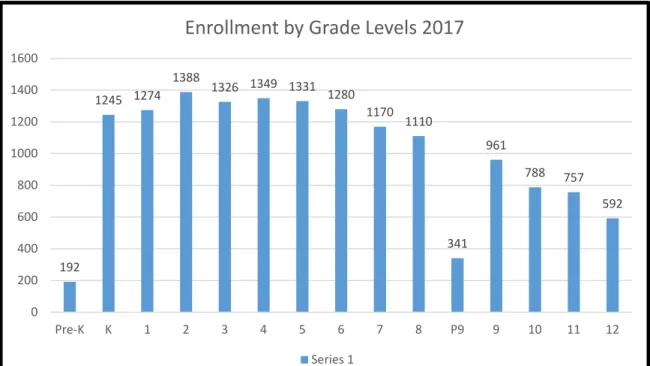
School size ranged from 14 students in Melang Elementary School to 1,091 students at Marshall Islands High School. The number of teachers at each school ranged from two in multiple schools to 77 at Marshall Islands High School. While almost 70% of all students are enrolled in schools in Majuro and on Kwajalein Atoll, the outer islands have more schools and teachers due to the number of smaller islands and atolls that have low populations and multi-grade schools. Table 2. 1 represents the allotment of schools and teachers when compared to the number of students enrolled.
Table 2.1
Student Enrollment and Teacher Count by Location 2016-17
Note: Reprinted from Marshall Islands Public School Systems (MIPSS, 2017, p. 12)
MIPPS provided no distribution data regarding secondary schools but reported that elementary school enrollment in urban areas, like Majuro and Kwajalein Atoll, rose from 2013-2017 while enrollment in the outer islands has declined. MIPPS attributes this trend to people migrating to urban areas in pursuit of economic opportunities. Table 2.2