Educational Foundations and Research Faculty Publications
Department of Educational Foundations and Research
4-2018
How Readability Factors Are Differentially
Associated With Performance for Students of
Different Backgrounds When Solving
Mathematics Word Problems
Candace WalkingtonVirginia Clinton
University of North Dakota, [email protected] Pooja Shivraj
Follow this and additional works at:https://commons.und.edu/efr-fac
Part of theScience and Mathematics Education Commons
This Article is brought to you for free and open access by the Department of Educational Foundations and Research at UND Scholarly Commons. It has been accepted for inclusion in Educational Foundations and Research Faculty Publications by an authorized administrator of UND Scholarly Commons. For more information, please [email protected].
Recommended Citation
Walkington, Candace; Clinton, Virginia; and Shivraj, Pooja, "How Readability Factors Are Differentially Associated With Performance for Students of Different Backgrounds When Solving Mathematics Word Problems" (2018).Educational Foundations and Research Faculty Publications. 5.
Running Head:READABILITY & STUDENT BACKGROUND
How Readability Factors Are Differentially Associated with Performance for Students of Different Backgrounds When Solving Mathematics Word Problems
Candace Walkington
Department of Teaching and Learning Southern Methodist University
Virginia Clinton
Department of Education, Health, and Behavior Studies University of North Dakota
Pooja Shivraj
Coppell Independent School District
Corresponding Author: Candace Walkington, 512-417-9975, [email protected]
Please cite as the following:
Walkington, C., Clinton, V., & Shivraj, P. (2018). How readability factors are differentially associated with performance for students of different backgrounds when solving math word problems. American Educational Research Journal, 55(2), 362-414.doi:
Abstract
The link between reading and mathematics achievement is well known, and an important question is whether readability factors in mathematics problems are differentially impacting student groups. Using 20 years of data from the National Assessment of Educational Progress and the Trends in International Mathematics and Science Study, we examine how readability factors – such as length, word difficulty, and pronouns – interact with student background characteristics – such as race/ethnicity, mathematics achievement, and socioeconomic status. Textual features that make problems more difficult to process appear to differentially negatively impact struggling students, while features that make language easier to process appear to
differentially positively impact struggling students. It is critical that readability along various dimensions be considered when designing instruction and assessment.
Keywords: achievement gap; language comprehension/development; NAEP; mathematics education
How Readability Factors Are Differentially Associated with Performance for Students of Different Backgrounds When Solving Mathematics Word Problems
The strong relationship between reading and mathematics achievement is well known (e.g., Crawford, Tindal, & Stieber, 2001; Hecht, Torgesen, Wagner, & Rashotte, 2001; Jiban & Deno, 2007; Lerkkanen, Rasku-Puttonen, Aunola, & Nurmi, 2005). For example, analyses of student performance on the Programme for International Student Assessment (PISA; Kelly,
Nord, Jenkins, Chan, & Kastberg, 2013), known to have a particularly high reading demand in its mathematics items, shows a correlation of 0.95 between PISA mathematics country mean scores and PISA reading country mean scores (Wu, 2010). This correlation was higher than the country-by-country correlation between PISA mathematics scores and mathematics scores on the
international assessment the Trends in International Mathematics and Science Study (TIMSS). This suggests that measures of reading achievement may actually predict mathematics
achievement well, and in fact be better predictors than some complementary measures of mathematics achievement.
One reason why mathematics achievement may be so closely linked to reading is that many mathematics problems involve considerable reading demands. Mathematical information is often presented in verbal (rather than symbolic) formats, with significant unraveling and
decoding of the English language needed to extract relevant relations. Indeed, mathematics word problems (i.e., problems where a mathematical scenario is posed using language rather than or in combination with symbols) have long been considered notoriously difficult (Cummins, Kintsch, Reusser, & Weimer, 1988) and U.S. mathematics teachers cite word problems as a major weakness of students (Loveless, Fennel, Williams, Ball, & Banfield, 2008). A subset of word problems are story problems, which are situated in “real world” contexts that reference concrete people, places, and objects. International comparisons suggest U.S. students struggle with mathematics word problems (OECD, 2010).
Large-scale mathematics assessments in the United States, such as the National Assessment of Educational Progress (NAEP), have also revealed enduring achievement gaps
between different student groups. Relatively small achievement gaps between males and females, favoring males, persist in some grade levels of mathematics (Robinson & Lubienski, 2011). Large, persistent, and widening achievement gaps between students of low- and high-socioeconomic status (SES) are particularly troubling (Reardon, 2011), as are continued gaps between Caucasian and Hispanic or African-American students (NCES, 2013; Provasnik et al., 2012). Achievement gaps also exist with respect to English Language Learners (ELLs; Fry, 2007), a fast-growing segment of the U.S. population. Finally, research has placed increasing emphasis on the importance of students’ attitudes towards mathematics – particularly their interest in learning mathematics – and its positive association with achievement (Kim, Jiang, & Song, 2015).
These gaps in mathematics achievement may in part be explained by differences in reading and language background between student groups. Indeed, recent work highlights that students who have weak language skills have difficulty understanding the text in word problems (Vilenius-Tuohimaa, Aunola, & Nurmi, 2008), and that accommodations that reduce the reading demands of mathematics problems can result in higher performance for struggling students (e.g., Helwig, Rozek-Tedesco, Tindal, Health, & Almond, 1999). When considering that all students, including those from different demographic backgrounds, should understand mathematics and be assessed on their progress, it is critical to investigate how readability characteristics of
mathematics problems may be differentially associated with performance.
In the present study, we use almost 20 years of mathematics achievement data from the NAEP and TIMSS to examine how the reading level of mathematics word problems is
differentially associated with performance for students from different demographic backgrounds. Examining approximately 1000 problems solved by three-quarters of a million 4th and 8th grade
U.S. students, we look at the interaction of word problem readability, focusing on several key text-based indicators identified in prior research, and student background characteristics, focusing on characteristics where achievement differences are well-established. Pilot work we review suggests that readability measures do matter for students’ performance on mathematics
word problems. Thus, investigating whether these readability factors are differentially impacting students from different backgrounds is important for understanding and acting upon persistent achievement differences between groups.
Literature Review Theoretical Framework
Theoretical work on cognitive models for solving word problems has explicated why readability may be important. Early research revealed that slight variations in mathematics problem wording result in children using different strategies (Carpenter, Fennema, Franke, Levi, & Empson, 1999; Carpenter & Moser, 1984). Kintsch and Greeno (1985) developed a model of story problem solving where students first translate from a problem statement to a propositional textbase, which is a conceptual representation of the relationships in the text. Students then form a problem model or situation model that infers the information needed to solve the problem based on knowledge of the domain. Later research (Hegarty, Mayer, & Monk, 1995) recognized that unsuccessful problem solvers use direct translation strategies, operating on numbers and keywords from the text and bypassing intermediate formation of a model of the situation. In contrast, successful problem solvers use problem model strategies where they form a mental representation of the situation and use this model to plan and assess their strategies.
Following this work, Nathan, Kintsch, and Young (1992) proposed a model of story problem solving where students coordinate three levels of representation: (1) the textbase or the propositional information given, (2) the situation model or mental representations of the
relationships, actions, and events, and (3) the problem model of formal mathematical operands, numbers, and variables. The situation and problem models are thought to be mutually supportive, with students iteratively moving between the two representations. Thus, if students are able to extract a meaningful situation model from the problem’s text, this situation model can support and improve their formal mathematical computations. However, forming this situation model is heavily dependent on comprehension of the text itself, which is impacted by readability.
demands of solving mathematics word problems. Cognitive load refers to the amount of mental effort expended in a learning or assessment task as working memory is utilized (Sweller, van Merrienboer, & Paas, 1998). While intrinsic cognitive load is the inherent difficulty level associated with understanding and processing particular mathematical concepts in a word
problem, extraneous cognitive load describes the way in which cognitive load is further impacted by the manner in which the concepts are presented. Problem texts that are difficult to read may increase extraneous cognitive load as students struggle to decode the written language in order to form a situation model. For example, Walkington, Clinton, Ritter, and Nathan (2015) describe a story problem where a character wakes up to find their basement flooded, and ends up comparing the rate of two plumbers. The contextual information at the beginning of the problem may have contributed to extraneous cognitive load, as such factors may not be directly related to learners’ processing and retrieval of relevant schemas. Thus, extraneous cognitive load from readability factors that are unrelated to retrieval of schemas may monopolize working memory, making these schemas more difficult to access. However, it is important to note that readability
characteristics are not always extraneous – it may be unavoidable to add reading demands when explaining a complex mathematical situation, and confronting such problems may intrinsically involve reading skills.
Relationship between Readability Measures and Performance on Large-Scale Assessments
Several notable studies on readability and student achievement have been conducted using large-scale assessments. Using mathematics state standardized test items from Grades 4, 7, and 10, Shaftel, Belton-Kocher, Glasnapp, and Poggio (2006) found that use of vocabulary specific to mathematics, complex verbs, polysemous words (words with multiple meanings), pronouns, prepositions, and comparative words were associated with greater problem difficulty across all students in particular grades. The reading demands of TIMSS mathematics items have also been examined using 175 4th grade items, drawn from a year when the TIMSS was
administered to the same students who received a reading assessment (Mullis, Martin, & Foy, 2013). The reading demand of mathematics items was measured by the number of words, use of
technical vocabulary, amount of symbolic language, and the complexity of visual displays. The number of words was the most substantial contributor to reading demand based on discriminant function analysis. In addition to the number of words indicating the amount of information to process, the number of words may also indicate syntactic complexity (e.g., greater average number of clauses per sentence; Arnold, Losongco, Waswow, & Ginstrome, 2000). Overall, students with better reading proficiency performed better on mathematics items across all levels of reading demand than students with lower reading proficiency. However, the magnitude of the difference in performance on mathematics items by students of varying reading proficiency differed as a function of reading demand. For proficient readers, accuracy was consistent across levels of item reading demand. For poor readers, accuracy was higher for items with low reading demand.
It is important to consider that reading difficulty and mathematical difficulty are often inexorably linked – problems with more complex mathematics may in turn require more complex language to describe the problem situation (see Walkington et al., 2015). This is not always the case – for example, there could be two nearly identical versions of a story problem about growth over time, one that models the growth using an exponential equation (e.g., increases by 50% every year) and one using linear growth (e.g., increases by 50 every year). Here, the reading demands would be similar, but the mathematical difficulty would be
substantially different. Conversely, one could hold the mathematical difficulty of a word problem constant, but create new versions that reduce readability demands by, for example, using familiar or concrete words (Abedi & Lord, 2001). This latter case may be particularly useful for
understanding readability factors.
Abedi, Lord, and Hoffstetter (2001) researched 8th grade students who received versions
of the 1996 NAEP test booklets that had either 29 standard mathematics items or matched items with their linguistic demand reduced. They found that students performed better on the
linguistically modified items, and that item length seemed to be an especially important factor in linguistic demand. In a similar study, Abedi and Lord (2001) used 20 items from the 1992 NAEP
and modified them to be less linguistically complex. In both studies, they manipulated familiarity/frequency of non-mathematics vocabulary, active/passive voice, conditional and relative clauses, question phrases, and made abstract presentations more concrete. The items were administered to 1174 8th graders, and they found improved performance, with performance
gains differentially impacting particular groups of students (described later). We next turn to a review of the literature on how the association of readability and performance may differ based on student characteristics, which is our primary focus.
Relationship between Readability Measures and Student Background Characteristics
There are reasons to expect that associations between readability and performance would vary by student characteristics, such as gender, cultural and linguistic background, SES,
mathematics achievement, and mathematics attitudes. Prior research has mainly examined reading skill and ELL status as factors that moderate the relationship between readability and performance. We review existing evidence for each of these factors.
Gender
Numerous studies have indicated that girls typically have stronger reading skills than boys; this finding is noted across grade levels and in most countries, including the U.S. (Chatterji, 2006; Department for Education and Skills, 2007; Halpern, Benbow, Geary, Gur, Hyde, & Gernsbacher, 2007; Logan & Johnston, 2010; Mullis, Martin, Foy, & Drucker, 2012; Twist, Schagen & Hodgson, 2007). Text characteristics that ease readability may be more beneficial for boys than girls. For example, because girls are generally more fluent readers (Barth, Tolar, Fletcher, & Francis, 2014), girls may have less difficulty with longer texts.
There are also gender differences in how language is perceived that may interact with reading word problems. Corpus analyses have indicated that females use more pronouns, with the exception of second-person pronouns, than males (Newman, Groom, Handelman, & Pennebaker, 2008). Girls may also be more likely to connect different ideas in a text together than boys (Clinton et al., 2014); therefore, girls may receive less benefit from pronouns in story problems than would boys, as pronouns can serve as linking mechanisms between sentences or
clauses. In addition, females may be more inclined to consider a word “concrete” and less inclined to consider a word “abstract” than males (Bauer & Altarriba, 2008). This may influence how different genders process words of varying levels of concreteness in word problems.
Linguistic, Cultural, and Socioeconomic Background
It is well known that language and culture influence the interpretation of language (August & Shanahan, 2008; Delpit & Dowdy, 2002). If a student’s linguistic background differs from the standardized American English in which assessment problems are written, the language in a story problem may be particularly challenging. ELLs are more likely to struggle with
reading compared to native speakers of English (Lesaux & Kieffer, 2010), so ELLs may have more difficulty with the language in a story problem (Fuentes, 1998). ELLs may perform less well on mathematics achievement tests because of problems with reading the problems despite understanding the mathematics (Abedi, Hofstetter, Baker, & Lord, 2001; Abedi, Leon, & Mirocha, 2001). Lengthy problems may also be especially troublesome for ELLs because of the increased effort involved in reading something in a second language (Bernhardt & Kamil, 1995). In addition, it is easier to learn concrete words than abstract words in a second language (De Groot & Keijzer, 2000). Given this, it is not surprising that ELLs more quickly comprehend concrete words than abstract words (Jin, 1990). Previous findings indicate that ELLs benefit more than native speakers of English from problems reworded to increase readability (Abedi & Lord, 2001).
ELL students may also struggle due to difficulties adopting the “mathematics register” – the unique meanings and structures of everyday language, such as using “left” to mean either a direction or what is remaining (Khisty, 1995). In addition, students may think of mathematical terms, such as “face” or “product” as typical language and apply non-mathematical meanings. Prepositions may be particularly challenging—for example, one finds the area “of” a triangle, rather than “inside” a triangle (Pimm, 1987). Moreover, because mathematics register involves words with mathematical purposes (Pimm, 1994), it is particularly complex because language must be integrated with the symbols and notations of mathematics (Yore, Pimm, & Tuan, 2007).
The notion of the mathematics register is related to the idea of disciplinary literacy – an
understanding of the technical vocabulary, language structures, and discursive elements that are specific to content areas like mathematics, and the associated specialized reading routines (Shanahan & Shanahan, 2008). Disciplinary literacy skills are less generalizable than basic reading skills, can be difficult to learn, are rarely explicitly taught, and are prominent in the Common Core State Standards (CCSS, 2010; Zygouris-Coe, 2012). Obtaining disciplinary literary is difficult for native speakers, and may present a particular challenge for ELLs.
Martiniello (2008) analyzed six mathematics word problems that showed Differential Item Functioning (DIF) favoring non-English Language Learners (non-ELLs) over ELLs on a 4th
grade standardized test. She found that stories that included complex, multiple clauses, as well as long noun phrases, led to comprehension difficulties for ELLs. In addition, unfamiliar
vocabulary words, especially words that English-speaking students might learn at home (e.g., chores) or words relating to mainstream American culture (e.g., spelling bee) were difficult for ELLs, as were polysemous words. In a similar study that used a large bank of mathematics standardized test problems from Grades 4-8, Wolf and Leon (2009) found significant
associations between DIF and number of words, amount of and reliance on verbal language in the problem (versus, for example, visuals, and graphs), and use of academic vocabulary. Abedi, Lord, Hofstetter, and Baker (2000) found that modifying mathematics items to be less
linguistically complex may reduce the achievement gap between ELLs and non-ELLs. Moving beyond strictly language issues, cultural differences in how mathematics is utilized in school versus community settings may impact problem solving (Saxe, 1988; Taylor, 2005). Boundaries between cultural knowledge and mathematical domain knowledge can obscure students’ mathematical understanding (Nasir, Hand, & Taylor, 2008). Gerofsky (2009) describes how word problems are a literary and pedagogical genre; the language they utilize and the knowledge they draw upon are inherently ambiguous, localized, and conditional, which has implications for students from different cultural backgrounds. Nasir et al. (2008) describe how when basketball players solved mathematics problems in a basketball context, they had greater
success and were able to invent powerful mathematical strategies. However, when the same problem was in an abstract mathematical context, they often misapplied formal algorithms. These authors make the case that school mathematics is a cultural activity that is structured to privilege certain communities and students over others. Mathematics word problems may thus privilege the experiences of the idealized Caucasian middle class (Ladsen-Billings, 1997) or incorporate a Eurocentric perspective (Tate, 1994).
At the intersection of language and culture, some research suggests students who speak African American Vernacular English in the home may struggle with reading standard English if they have a lack of familiarity with standard English (Charity, Scarborough, & Griffin, 2004). This is similar to previously discussed issues with other populations who do not speak standard English in the home (e.g., ELLs). Students who are African American and use African American Vernacular English may read story problems differently than students whose linguistic
background is a more standardized form of English. For example, African American Vernacular English is more vivid and imageable than standard American English dialects (Ball, 1996). Students who have more experience with such concrete language could benefit when vivid and imageable terms are used in story problems, and struggle when language is abstract and
decontextualized.
Language, race, and culture are also inexorably tied to SES. SES is known to be an important predictor of academic achievement, including reading performance (Perry & McConney, 2010; Sirin, 2005). Students from low-SES backgrounds do less well on reading assessments than students from middle- or high-SES backgrounds (Noble, Farah, & McCandliss, 2006). Given these issues, it is likely that students from low-SES backgrounds would benefit more from more readable problems. Research has shown that low-SES students benefited more from modifications to 8th grade mathematics problems to make them easier to read than other
students (Abedi & Lord, 2001). Differences in responses to realistic constraints of story
problems have also been found between working class versus more privileged students (Cooper & Harries, 2005). Frankenstein (2009) discusses how word problems contain “hidden messages”
(p. 111) about the sometimes taken-for-granted norms of society. For instance, a word problem about adding up prices at the grocery store contains the implicit message that it is normal to have money to pay for food, even though many children suffer from hunger.
Ladsen-Billings (1995) describes differences in the way suburban and inner city students responded to the story problem, “It costs $1.50 to travel each way on the city bus. A transit system fast pass costs $65 a month. Which is the more economical way to get to work, the daily fare, or the fast pass?” (p. 131). Suburban students assumed that a person would commute to work 5 days a week, and concluded that the daily fare would be more economical. However inner city students opted for the transit pass, posing questions like “How many jobs does this person have?” “Do they have part-time jobs or full-time jobs?” Urban students also recognized that if the transit pass was purchased, family members could use it on evenings and weekends to go to stores, church, etc. Other studies have found that many “unrealistic” or “incorrect”
responses students give to story problems represent unanticipated but valid interpretations of the story context based on their everyday cultural knowledge and diverse sense-making activities (Inoue, 2005; Kazemi, 2002).
Mathematics Achievement and Mathematics Attitudes
The association between readability measures and performance may also differ for students with different mathematics achievement levels. Mayer’s (2001) individual differences principle states that design effects, like making a text more readable, tend to be stronger for low-knowledge learners because high-low-knowledge learners are better able to use prior low-knowledge to compensate for less support. Accordingly, research has shown that students in lower-level mathematics courses benefit more from mathematics problems designed to be easier to read than students in higher-level mathematics courses (Abedi & Lord, 2001). In addition, students
struggling with algebra tend to benefit more from an intervention that personalized story problem texts to topics they found interesting (Walkington, 2013). Finally, mathematics and reading achievement are very highly correlated (Wu, 2010), so students with higher mathematics skills are likely to have stronger reading skills as well, and struggle less with difficult-to-read
problems.
Students’ level of interest in learning mathematics may also moderate the effect of
readability on performance. Interest is positively associated with making connections both within a text and between a text and a student's background knowledge (Clinton & van den Broek, 2012), and thus may facilitate situation model construction. Durik and Harackiewicz (2007) found that an intervention designed to trigger interest by adding decorations was most effective for learners with low interest in mathematics, but hampered learners with high interest.
Conversely, they found that an intervention that informed students of the value of the content was beneficial for high mathematics interest students, and detrimental for low interest students. In another study, Walkington, Cooper, and Howell (2013) found that adding relevant contexts and illustrations to mathematics story problems was most effective for students who had mixed attitudes towards mathematics – students who were not particularly positive or negative about learning math. Although there is not much research directly relating to readability, it is
reasonable to assume that the effect of readability factors may differ based on students’ interest in mathematics.
Pilot Studies
There are potentially limitless ways that the readability of a mathematics story problem could be quantified. Coh-Metrix (McNamara, Louwerse, Cai, & Graesser, 2013), a widely used computer-based readability tool, calculates 108 different measures of readability, and there are other such tools available (e.g., the Linguistic Inquiry and Word Count (LIWC) software; Pennebaker, Chung, Ireland, Gonzales, & Booth, 2007). Historically, the use of quantitative measures of readability has been controversial (e.g., Bailin & Grafstein, 2001; Bertram & Newman, 1981; Kirkwood & Wolfe, 1980). Some criticisms are specific to older measures of readability, such as the concern that traditional measures oversimplify word difficulty without considering semantics (Kirkwood & Wolfe, 1980) or the complexity of the words (Bertram & Newman, 1981). These concerns are addressed by contemporary computerized tools, which provide more detailed measures (e.g., Coh-Metrix), and thus are considered preferable to
traditional formulas (Benjamin, 2012). However, other concerns about quantitative readability measures include that they are limited in that they do not take into account the interaction between the reader and text (Schulz, 1981), and they may remove the deep meaning and beauty from language (McNamara, Graesser, McCarthy, & Cai, 2014).
With these concerns in mind, there remain many advantages to quantitative measures of readability: they are objective, relatively quick to obtain, and provide assistance in modifying texts (Zamanian & Heydari, 2012). However, in order to conduct a study of how readability influences mathematics problem solving without significant inflation of Type 1 error, the list of potential readability factors to be tested must be narrowed down to a small set. We present two pilot studies that describe how we narrowed down readability factors to consider.
Readability Factors in Algebra Curricula
In prior work (Walkington et al., 2015) we examined 151 story problems from a widely used Algebra I curriculum, Cognitive Tutor Algebra, as well as a set of 60 algebra story
problems from a middle school tutoring software MATHia. We entered the text of the story problems into two text analysis programs – Coh-Metrix and LIWC. We found that controlling for the mathematical difficulty of the problem, several measures of readability were significantly associated with performance. The difficulty of the words in the problem, measured by word concreteness and word polysemy was important, as was the length of the story text, measured by number of sentences and number of words. In addition, the presence of third-person singular pronouns was positively associated with performance, as was problem topics that were concrete and relatable (e.g., home, socializing) rather than topics related to work, finance, health, or business. However, these data were analyzed at the problem level, using a summary measure of performance for each problem. No information about student demographic characteristics was present. This study also examined only story problems (i.e., mathematics problems in real world contexts) and only problems that involved the mathematical content area of linear functions.
Readability Factors in NAEP/TIMSS
TIMSS (Walkington, Clinton, Shivraj, & Yovanoff, 2015). These datasets simply gave an overall accuracy statistic for each problem averaged for every student who took the test. Thus, these datasets also did not give any information about how student background characteristics might impact problem solving, but did give enough information to correlate readability characteristics of the different problem texts to performance levels on those problems. For all available released problems (757 NAEP problems and 445 TIMSS problems), we calculated all measures of
readability from Coh-Metrix and LIWC. We correlated these measures of readability with overall accuracy measures for each problem to narrow down a list of readability measures that were significantly correlated to performance. We then entered this narrowed list of readability measures as predictors into mixed-effects regression models predicting performance, including other problem characteristics (e.g., grade level, answer format, difficulty) as covariates. Results showed that on both the NAEP and TIMSS, a story problem that had more sentences or used second-person pronouns was significantly associated with lower performance levels. On the NAEP, as the average age of acquisition of content words in the story increased, performance significantly decreased. Also on the NAEP, as density of pronouns increased, performance significantly increased as well. Table 1 shows examples of NAEP problems that vary on problem length and use of pronouns.
Taken together, this study and the previous curricula study allowed us to narrow down a set of readability predictors to examine in the study we report here. Specifically, these studies suggest that word difficulty – expressed by measures such as concreteness, age of acquisition, and polysemy – is a critical factor. In addition, pronouns are an important readability factor; however, some evidence emerged that second-person pronouns seem to act in a contradictory manner to other pronouns. The length of the word problem – as measured by sentences or word count – is also an important readability measure. Finally, the study of curricula suggested that the problem’s topic mattered; however, this study included only problems in real world contexts. We did not see such effects for problem topic in the initial NAEP/TIMSS study, perhaps because the nature of standardized tests causes interest-eliciting characteristics to be less critical. So, in the
present study, we simply examine whether or not the problem was in a real world context, rather than any specific problem topic predictors. Prior research suggests that placing problems in real world contexts can improve accuracy and change strategy use (e.g., Koedinger & Nathan, 2004; Walkington, Sherman, & Petrosino, 2012), and these implications may differ for different
student groups. Our final list included five factors: word concreteness, pronoun density, presence of second-person pronouns, word count, and presence of a “real world” context. Although there are a host of other readability measures that research has shown to be generally predictive of text comprehension, these measures were chosen because there was evidence that they were
important when solving 4th and 8th grade mathematics word problems specifically. Research Questions
Although previous studies have established the importance of our five key factors, the contribution of the study reported here is to look at how the associations between these readability factors and performance vary based on student background characteristics. We examine this interaction in a very large bank of story problems collected over decades of testing with nearly a million students. The specific background characteristics we examine include gender, race, SES, mathematics attitudes, language or birth status, and mathematics achievement, all of which have become important to national conversations surrounding equity, access, and achievement gaps. We compare and contrast results from two important and widely used test datasets – the NAEP and the TIMSS – across 4th and 8th grade. Our research questions are as
follows:
1) How are key readability factors differentially associated with performance for students of different demographic characteristics (i.e., race, language, SES, gender, mathematics attitudes and achievement) when solving mathematics word problems on the NAEP and TIMSS?
2) How do results change when removing controls for mathematics achievement, which may under-represent the achievement gaps that students from different groups
Method Overview of Sample
Analyses drew upon student-level datasets from two sources – performance of 4th and 8th
grade students on mathematics questions on the NAEP and on the TIMSS. A student-level dataset is a dataset that shows whether each student performed correctly on each problem they received, rather than giving summary measures for each student or problem. While the student-level TIMSS datasets are publicly available, the student-student-level NAEP datasets are restricted use and were obtained through a data licensing agreement. Along with mathematics test items, the NAEP and TIMSS both include background questionnaires for students and teachers that assess contextual factors that impact student learning. Neither the NAEP nor the TIMSS come with direct consequences for students who take them, as they are not mandated. For this reason, readability may function differently on these assessments than on compulsory assessments, as students may, for example, be more likely to give up if a problem is difficult to read.
The TIMSS, developed by the International Association for the Evaluation of Educational Achievement, provides written test data on the mathematics and science achievement of students in the U.S. and over 60 other countries. It has been administered every 4 years since 1995, and we include mathematics data from 1995, 1999, 2003, and 2011 (2007 released items were not available). The TIMSS aims to capture the breadth and richness of the mathematics taught in participating countries, and uncover improvement or decline in student performance over time. Students receive a sample of the total set of available mathematics items (see Mullis et al., 2009). The selection procedures for schools/classrooms for TIMSS are given in Jones and Foy (2012). Between 10,000 and 20,000 U.S. students typically take the TIMSS in each administration. The TIMSS data we used were limited to U.S. students taking English mathematics items.
The NAEP, administered by the National Center for Education Statistics, provides written test data on the achievement of U.S. students in a variety of subjects, including mathematics. NAEP results are intended to serve as a common and continuous measure of performance for states over time. Long-term assessments began in 1986 and generally take place
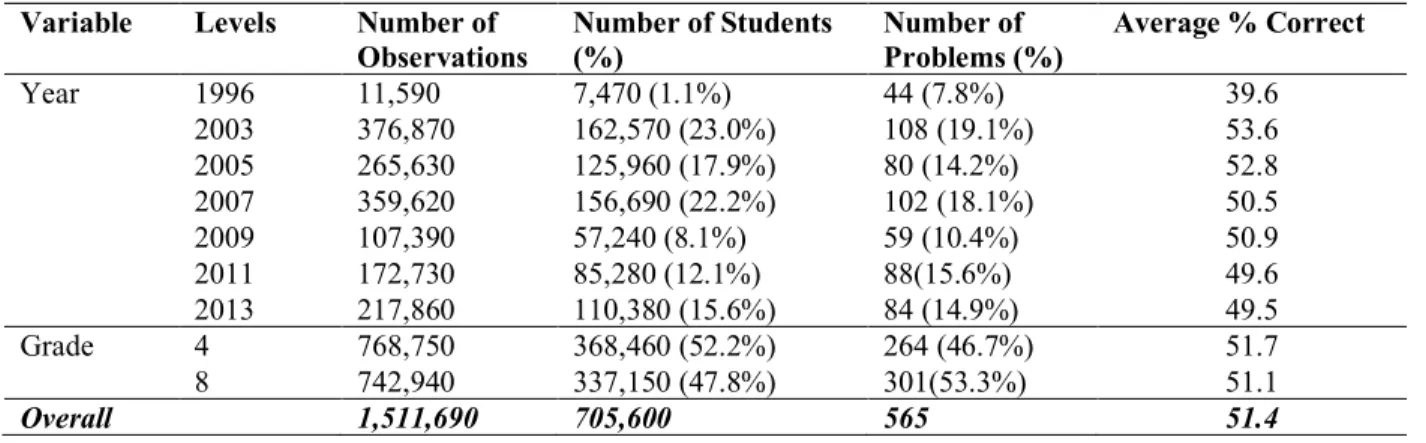
every 2 years – here we analyze data from 1996, 2003, 2005, 2007, 2009, 2011, and 2013, as these are the years that released items and student-level data were available. Items given to an individual student are again drawn from a larger sample. The selection procedures for
schools/students for NAEP are given in NCES (2009). Between 300,000 and 400,000 U.S. students typically take the NAEP in each administration. Because we were examining student-level data and the NAEP dataset was so large, we took a random 10% subset of the data from each of the included years. This allowed for it to be computationally feasible to fit complex, mixed-effects models with precision. Supplementary analyses that selected multiple or different random subsets, including larger random subsets analyzed with less precise model-fitting
techniques, yielded similar results to those presented here. A small percentage of students (7.6%) received some kind of accommodation while taking NAEP. Analyses were run with and without these students and results were similar, so they were left in the sample. Analyses were also run with and without the subset of students who received reading accommodations (4.3%)
specifically– results were again similar either way, so students were left in the dataset. For the TIMSS, students with disabilities or students who had received instruction in the language of the test for less than one year were not tested, and thus were not included in the sample – this was typically around 4-7% of all students initially considered for TIMSS testing.
Selection of Problems and Measures of Readability
Our analyses only contain 4th and 8th grade mathematics problems from the
aforementioned years that are released (i.e., made publicly available on the TIMSS website, nces.ed.gov/TIMSS/educators.asp, or the NAEP website, nces.ed.gov/NationsReportCard/nqt). In addition, analyses include only items that were multiple choice or short constructed response, and only items that had at least one sentence worth of words. As we used an automated text analysis software, we did not consider the visual representations or the symbols/equations – these were deleted when the problem was entered into the software. We also did not consider any text that occurred in the visuals or answer choices. Coh-Metrix is designed to be used with
al., 2014). As answer choices usually did not involve full sentences, they were also not considered. In supplementary analyses, we coded the visual along a variety of dimensions (number, type and location of visuals, and whether visual contained words), as well as presence of equations, but generally found these fine-grained predictors to be non-significant in
exploratory analyses. We defined “one sentence worth of words” as a problem that, with visuals and symbols removed, was not a fragment and contained a subject and a predicate conveying a question, statement, or command. Also note that our narrowed list of factors contained only word-level readability variables (rather than cohesion measures that examine discourse level constructs), which we believe is appropriate given the relatively short length of most
mathematics word problems. Only around 9% of TIMSS items and 6% of NAEP items did not have at least one sentence worth of words.
The final set of problem texts included 428 TIMSS problems and 565 NAEP problems. Although we could have further decreased the problem bank by only considering problems from recent years on the NAEP and TIMSS, we considered this number of problems an appropriate but minimal sample size for full coverage of the readability measures, and thus did not want to decrease it further. Problems were entered into Coh-metrix and LIWC. Coh-Metrix is a
computerized text-mining tool that provides a broad set of fine–grained readability measures (McNamara et al., 2013). Coh-Metrix provides 108 different indicators of text readability organized into categories that relate to surface features of the text, such as word concreteness, features of the textbase, such as pronoun density, and deeper features of the text, such as propositional structure or cohesiveness. The LIWC software (Pennebaker et al., 2007) is a dictionary-based computerized text-analysis program that counts words in more than 70
categories, such as social process words (e.g., words relating to family or friends) and cognitive process words (e.g., words describing causation or certainty). LIWC’s output consists of the percentage of words in a text from each dictionary.
As mentioned previously, for the analysis reported here we narrowed the Coh-Metrix and LIWC measures under examination to four – word count, pronoun density, word concreteness,
and presence of second-person pronouns. Word count (Coh-Metrix) is a numerical count of how many words the text contains, while pronoun density (LIWC) is the percentage of the total number of words in the problem that are pronoun words (including them/they/it). Word
concreteness (Coh-Metrix) is a measure of the level at which one can interact with the concept represented by a word through the senses; for example, the word “ball” would have high concreteness, and the word “truth” would have low concreteness. Concreteness is calculated through ratings compiled in the Medical Research Council Psycholinguistic Database (Coltheart, 1981). Concreteness values for each word are discrete and in the range of 100 to 700 with higher values indicating more concreteness. Coh-Metrix provides a measure of the average concreteness compiled across all content words1 in the text. All three of these measures were normalized,
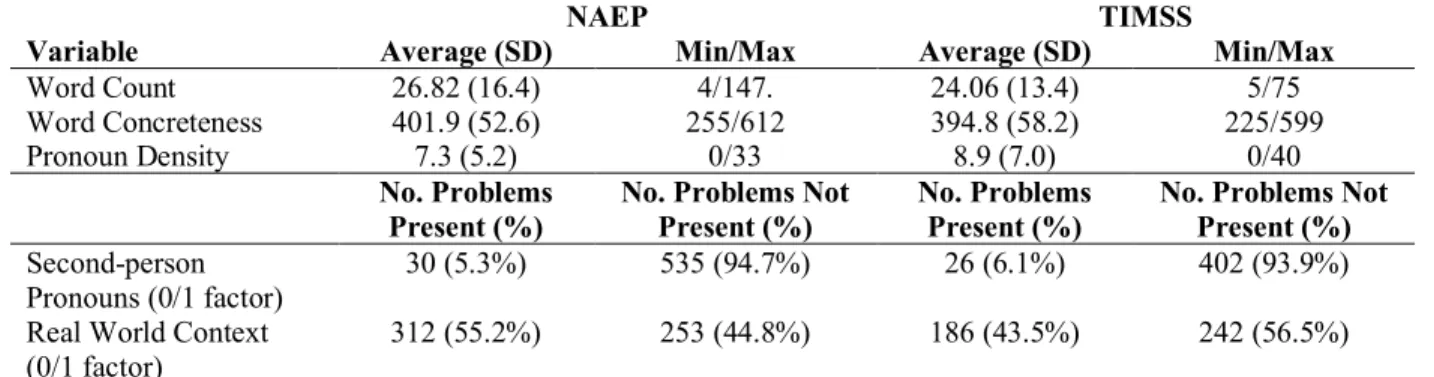
although we provide summary measures on their original scales in Table 2. Finally, presence of at least one second-person pronoun (i.e., the word “you”) was measured through a simple 0/1 indicator, since there were relatively few problems containing these pronouns (around 5% of problems).
In addition to the LIWC and Coh-Metrix categories, each problem was also coded for whether it contained a “real world” context (i.e., any reference to using mathematics in the world to understand objects or events), rather than using mathematics for abstract or academic
purposes. For example, a problem asking for the area of a 3-by-4 unit rectangle would not be a real world problem, but a problem asking for the area of a 3-foot-by-4-foot “poster” would. Fifty-three problems were double coded by two coders for whether there was a real-world context and whether the problem contained at least one sentence worth of words. Raters agreed 92.5% of the time about real-world contexts, and 100% for whether the problem contained one sentence of words. Summary statistics for these 5 measures are in Table 2.
Student Variables used in Analyses
When choosing student demographic variables to include in analyses, a primary concern
1“Content words” include nouns, verbs, adjectives, and adverbs which have linguistic meaning. These are
was including measures that were available across all years that each test had been administered. If a measure (like racial category) had not been collected in one year, this would result in a large subset of our released problems being omitted from the analyses. This limited the demographic categories we could consider to those shown in Tables 3-4; these tables also give summary measures of how the student population in our final sample varied on each demographic factor, as well as how much data were missing. We discuss each demographic variable in turn.
Gender. Gender information (male/female) was collected all years for both tests. There was very little (less than 0.1%) missing data.
Race. Racial category was collected each year of NAEP, but only 2 of the 4 years were included for TIMSS. For this reason, our analysis of the TIMSS data does not include the Race variable. Racial categories were Caucasian, Black, Hispanic, Asian/Pacific Islander, and Other (American Indian/Alaska Native, two or more races) on the NAEP. For all analyses, categories were
collapsed to Caucasian, African-American, Hispanic, and Other, due to small sample sizes. Race was missing for a small percent (1.7%) of students on NAEP (Table 3).
Language. On the NAEP, a variable was available each year for “How often do people in your home talk to each other in a language other than English?” and it was rated on a 4-point scale from “Never” (1) to “All or Most of the Time” (4). This variable was collapsed into a
dichotomous predictor of whether they indicated only English (1) or any amount of non-English (2-4). This value was missing for a small percentage (2.6%) of participants (see Table 3). We used this variable instead of the ELL status variable because it was better matched to the “Birth Status” variable available on the TIMSS. Note that ELL status has a specific meaning relating to a student currently having low English proficiency and being served in an assistance program.
Birth Status. On the TIMSS, there was no similar variable available for language. However, a variable was available for whether the student was born in the U.S. or outside of the U.S. This value was missing only for a small percentage (2.0%) of participants (see Table 3).
Socioeconomic Status. To capture SES, the only measures that were relatively consistent across years on NAEP and TIMSS were number of books and a presence of a computer in the home.
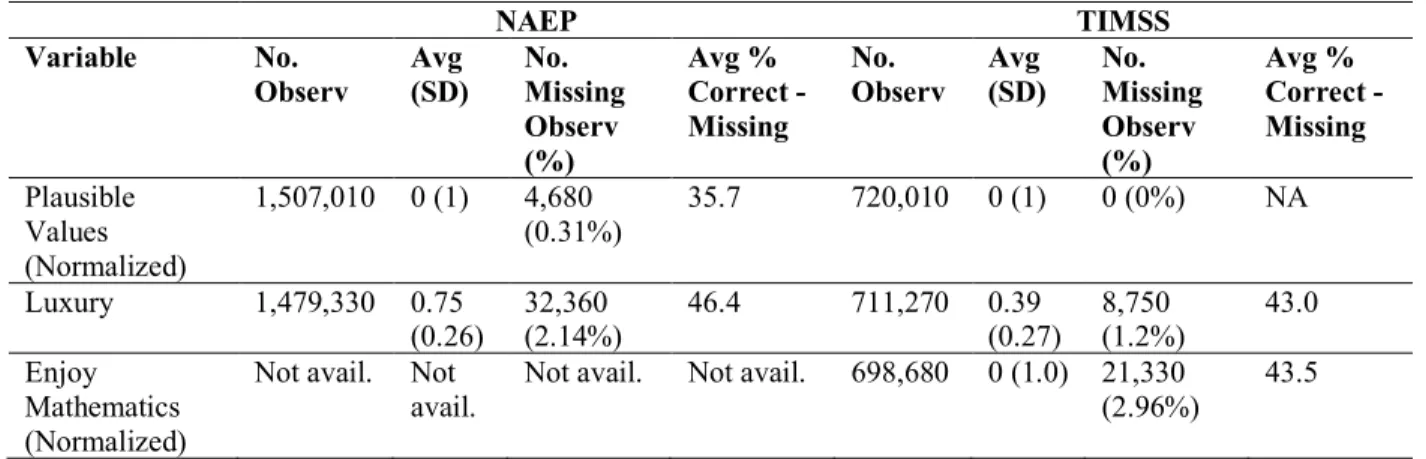
We called this indicator “Luxury Items” and scaled it as a continuous variable ranging from 0 to 1, with half of the score coming from the books rating (rated on a 1-4 or 1-5 scale, with each rating level representing a different range of books) and half coming from the computer rating (a simple yes/no regarding whether students had a computer in home). On the 1996 NAEP, there was no computer question, so number of books was used alone to compute Luxury. On the TIMSS, there was no number of books measure for 1995 Grade 4, and no computer measure for 1999 Grade 8, so only one measure was used to compute Luxury. This variable was missing for a small percentage of students on TIMSS (1.2%) and NAEP (2.1%).
Mathematics Attitudes. For each year on the TIMSS, a measure was collected where the student responded to the text “I enjoy learning mathematics” on a 1-4 scale. This value was missing for a small percentage (2.96%) of participants (see Table 4). These values were normalized. Measures for attitudes are not included for the NAEP as they were not available in all years.
Plausible Values/ Mathematics Achievement. All NAEP and TIMSS datasets include five “plausible values” that estimate students’ overall mathematics achievement based on their responses to the mathematics items answered. There were 5 such values because, as mentioned previously, students typically received different items, and any estimates of achievement contain measurement error. Plausible values use multiple imputations to show a likely distribution of a students’ proficiency, and cannot simply be averaged (see Von Davier, Gonzalez, & Mislevy, 2009). We used these plausible values as a proxy for mathematics achievement. There were no missing PVs on the TIMSS, and a very small (0.3%) percentage of missing sets of PVs on the NAEP. These values were normalized.
Problem Variables Used in Analyses
We also used descriptive variables to control for characteristics of individual problems (see Table 5) that did not directly relate to readability.
Problem Type. On the NAEP, problems were organized into 3 types: multiple choice, short constructed response, and extended constructed response. Extended constructed response items were few (30 total items), and differed substantially from the other two problem types – they
would ask students to write extended mathematical explanations. These were omitted from the analysis. On the TIMSS, there were constructed response and multiple choice items. While most of the constructed response items asked only for short “fill in the blank” answers, several asked for extended written explanations (15 total items) – these were also omitted.
Problem Difficulty. On the NAEP, each problem had a Difficulty rating of Easy, Medium, or Hard given on the NAEP website. On the TIMSS, there was no such rating given explicitly, so Easy problems were defined as those with an international performance level of 67% or greater, medium had 34-66% correct, and high had 33% correct or less. Note that as these are
international performance levels, we would not necessarily expect them to be directly indicative of U.S. students’ actual performance levels. Students in different countries have different
opportunities to learn various mathematics concepts due to differences in curriculum, policy, and instruction. Also, as the TIMSS is offered in different languages, the language of the assessment itself may impact item difficulty. Thus, this is not a completely redundant measure when
predicting U.S. item performance, and can be thought of as a broad measure of the difficulty of the mathematics problem independent of a country’s particular context.
Problem Complexity. For 2005 and forward, NAEP explicitly rated the Complexity of their problems as Low, Moderate, or High. Prior to 2005, NAEP rated problems as Procedural Knowledge (which we mapped to Low), Conceptual Understanding (which we mapped to Moderate) and Problem Solving (which we mapped to High). The Moderate and High problems were later collapsed such that Complexity only had two levels – Low and High. NAEP
differentiates complexity from difficulty: “Mathematical complexity is not necessarily related to item difficulty, which is based on actual student performance. Mathematical complexity should also be independent of curriculum, meaning it is determined assuming that students are familiar with the mathematical content of the item” (Neidorf, Binkley, Gattis, & Nohara, 2006, p. 30). The system for the TIMSS was more complex – they had 12 different “Cognitive Domain” categories, which evolved over the years the test was administered. However, we mapped these categories into Low (Knowing, Knowing Facts and Procedures, Performing Routine Procedures,
Solving Routine Problems, Using Routine Procedures) and High (Applying2, Communicating
and Reasoning, Reasoning, Investigating and Solving Problems, Solving Problems, Using Complex Procedures, Using Concepts) Complexity.
Grade Level. All problems were either Grade 4 or Grade 8. Grade 12 data were not considered. Grade level could be considered a proxy for age and thus a student variable rather than a problem variable. However, here this did not make sense because Grade 4 and Grade 8 had completely distinct problem sets, with different mathematical and reading demands, different uses of visuals, symbols, equations, etc. Thus, comparing differential effects of readability based on age using these problems would not be a sensible comparison.
Content Domain. Both NAEP and TIMSS items were organized into mathematical content domains. The NAEP was organized into the 5 categories we use here, while the TIMSS had categories that were similar but shifted year-by-year in their wording. The TIMSS domains were grouped according to the five NAEP categories: Algebra (which included Patterns and
Relationships), Data (which included Data Representation, Probability and Chance), Geometry, Measurement, and Number (which included Fractions and Proportions).
Model Fitting Techniques
Mixed-effects logistic regression models were used (Snijders & Bosker, 1999) and fit separately for the NAEP and TIMSS. We included random intercept terms for Problem ID and which year’s data the observation was drawn from (Tables 6-7). We did not fit a random effect for student ID, as the Plausible Value variable was a similar, and perhaps better, measure of student performance on the mathematics items on the test. The plausible value provided by NAEP/TIMSS had the advantage of being calculated based on students’ performance on all mathematics items, rather than only based on their performance on released items included in the analysis. The models for the NAEP included 1,511,700 observations of 705,600 students solving
2The “Applying” category on the TIMSS had problems of disparate complexity, and the decision was made to call category “high complexity.” However, in practice, the cognitive complexity of the individual problems varied. Regression models were run both ways, and results were similar.
565 mathematics problems. The models for the TIMSS included 720,010 observations of 40,570 students solving 428 problems (all samples rounded to the nearest 10).
We also included all student and problem level variables as fixed effect predictors. The outcome variable was whether the student got the problem correct or incorrect, coded as a 0/1. For short constructed response items where partial credit was a possibility, we did not award any partial credit. Overall, on the TIMSS, students had an accuracy rate of 55.69%, while on the NAEP they had an accuracy rate of 51.39% correct. We first fit a null model, which included only our student and problem variables (Model 1). We then fitted a model that included our 4 readability predictors and real-world context (Model 2), and a subsequent model that allowed these predictors to interact with student background characteristics (Model 3). We then fit a model that did not include the plausible value measures of mathematics achievement (Model 4) to examine how omitting this variable changed the results. Indeed, including a predictor for mathematics achievement to model performance on a problem, when that achievement measure was in part computed from performance on that problem, could be considered somewhat circular. However, given the well-known achievement gaps between diverse student groups, fitting the model with these plausible values seemed important as well. For the TIMSS, Model 4 was fit with Student ID as a random effect, as we were using the entire dataset. However, in the NAEP, there were too few observations per student (because we were using a 10% subset) for a random effect for Student ID to be computationally feasible. We also fit some additional models (described later) to explore alternative hypotheses about results that arose.
Models were implemented using the binomial family in the glmer() function in the lme4 package (Bates, Maechler, Bolker, & Walker, 2014) in Revolution R Enterprise (Revolution Analytics, 2014). Fitting models with plausible values involves special techniques for model computation. There are 5 plausible values, so each model is fit 5 separate times, once using each value. These models are then compiled by averaging the regression coefficients to obtain overall regression coefficients. Computation of the error term of these new coefficients was computed by combining the sampling variance and imputation variance, as outlined in Mislevy, Beaton,
Kaplan, and Sheeham (1992). We also implemented p-value corrections, given the large number of significance tests we were conducting. We used the False Discovery Rate (FDR) procedure, described in Benjamini and Hochberg (1995), also described in the NAEP technical
documentation (http://nces.ed.gov/nationsreportcard/tdw/). The FDR is a multiple comparison procedure that holds the significance for a set of comparisons at a certain level (here α = 0.05) by controlling for the expected proportion of errors from among the rejected null hypotheses.
As the models were logistic, d-type (standardized mean difference) effect sizes were estimated using the procedure outlined in Chinn (2000), where the coefficient is divided by 1.81. While this is straightforward for indicator variables or variables that range from 0 to 1, it is more difficult to interpret for variables that take a continuous range. For our normalized variables (3 of our readability variables, mathematics attitudes and plausible values) we took the difference between +1.5 and -1.5 standard deviations to compute this effect size measure.
In Cohen (1988), effect sizes of 0.2, 0.5, and 0.8 are considered small, medium, and large, respectively. However, as Hill, Bloom, Black, and Lipsey (2008) argue, it is important to consider benchmarks for effect size in the unique context of our study. They show that in educational research, effect sizes found using broad standardized mathematics tests often range from 0.1 to 0.3. Prior research on mathematics story problems (Walkington et al., 2015) suggests that the effects for readability measures are likely to be small, even when the effects of several measures are grouped together. When using text analysis tools, individual measure effect sizes near to d = 0.1 have been considered reasonable for practical significance (e.g., Newman et al., 2008). The combined effect of several readability measures that vary together may be more considerable and practically meaningful in the context of problem design.
Results Findings for Null Models
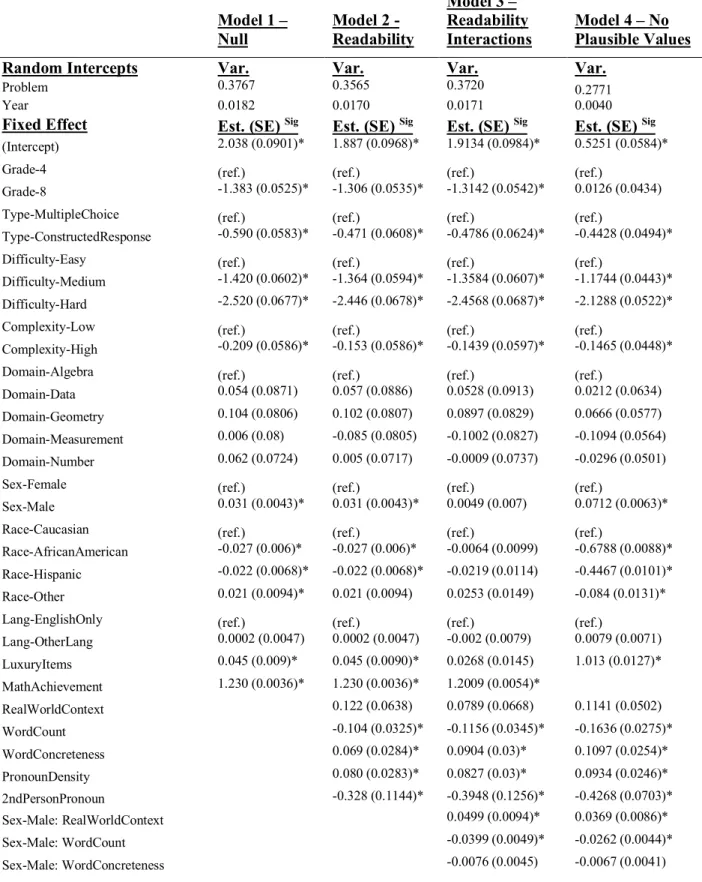
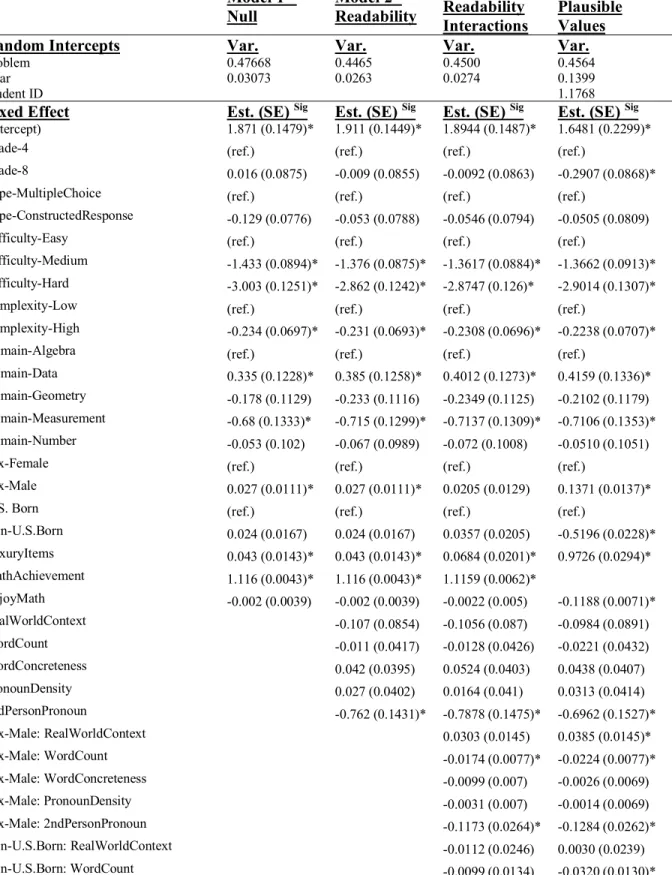
Models 1 and 2 in Table 8 (NAEP) and Table 9 (TIMSS) are two null models that do not have interaction terms between readability factors and student background characteristics. Model 1 includes only student and problem variables, and shows similar results across the NAEP and
TIMSS. Unsurprisingly, medium and high difficulty problems have significantly lower accuracy than low difficulty problems, and high complexity problems have significantly lower accuracy than low complexity problems. On both tests, males score significantly higher than females, owning more luxury items is associated with significantly higher accuracy, and higher plausible values (mathematics achievement) are associated with significantly greater accuracy. On the NAEP, short constructed response problems are associated with significantly lower accuracy than multiple choice problems, African-American and Hispanic students score significantly lower than Caucasian students while students of other race/ethnicities score significantly higher, and Grade 8 has significantly lower accuracy than Grade 4.
Model 2 adds in readability predictors, with models from both datasets showing that the presence of second-person pronouns is associated with significantly lower accuracy (d = -.18 for NAEP and d = -.42 for TIMSS). The NAEP models additionally show that higher word counts are associated with significantly lower accuracy (d = -.17), more concrete words are associated with significantly higher accuracy (d = .12), and a greater pronoun density is associated with significantly higher accuracy (d = .13). The effect of a “real world” context is not significant in either model, but is directionally positive in NAEP and directionally negative in TIMSS.
Research Question 1: Differential effects of Readability Based on Student Characteristics
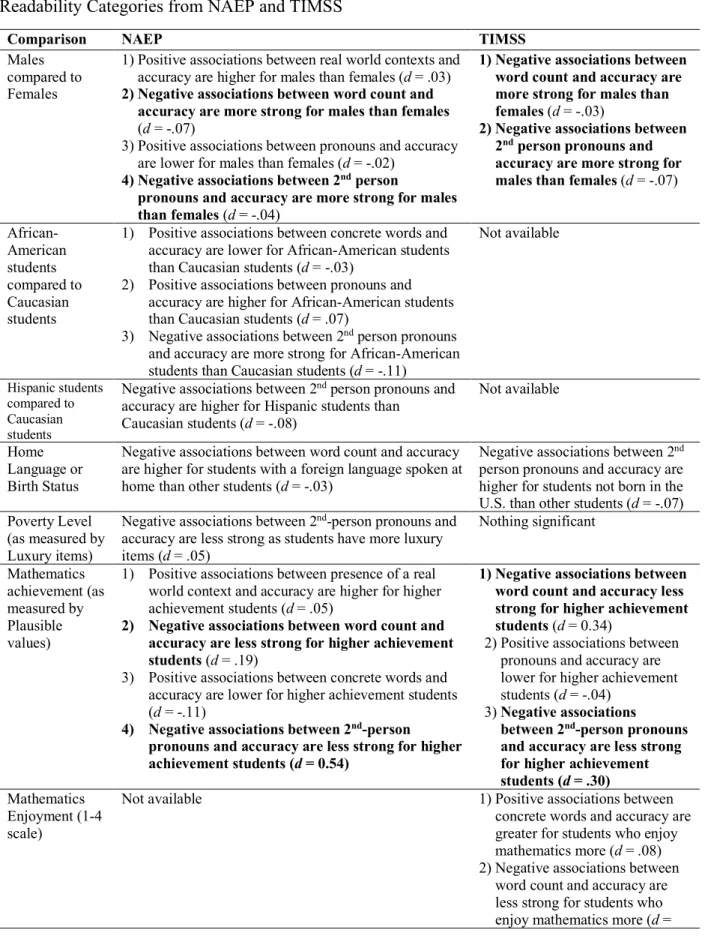
Model 3 in Table 8 gives the findings for the interaction of readability and student characteristics for the NAEP. In terms of gender differences, positive associations between real world contexts and accuracy and between pronouns and accuracy are higher for males than females (d = .03 and d = .02). However, these effect sizes are negligible. In addition, negative associations between word count and accuracy and second-person pronouns and accuracy are stronger for males than females, but again effect sizes are small (d = -.07, d = -.04). In terms of racial differences, positive associations between pronouns and accuracy are higher for African-American students than Caucasian students (d = .07). However, positive associations between concrete words and accuracy are lower for African-American students than Caucasian students, although the effect size is negligible (d = -.03). Finally, we see that negative associations
between second-person pronouns and accuracy are stronger for African-American students (d = -.11) or Hispanic students (d = -.08) than Caucasian students. Thus, the difficult readability factor of second-person pronouns might be differentially negatively associated with performance for these groups. For language status, we see that negative associations between word count and accuracy are higher for students with a language other than English spoken at home than other students, although the effect size is negligible (d = -.03). Also, negative associations between second-person pronouns and accuracy are stronger as students have fewer luxury items, although the effect size is very small (d = -.05).
The strongest effects for differential findings for readability characteristics are for mathematics achievement (measured by plausible values). Negative associations between word count and accuracy, and second-person pronouns and accuracy are less strong for higher achievement students (d = .19, d = 0.54). In addition, positive associations between concrete words and accuracy are lower for higher achievement students (d = -.11). Finally, positive associations between presence of a real-world context and accuracy are higher for higher
achievement students, although the effect size is very small (d = .05). This suggests that stronger students have less negative associations between their performance and readability factors that make a problem difficult to read, while weaker students have stronger positive associations between their performance and readability factors that facilitate easy reading.
Model 3 in Table 9 gives the findings for the interaction of readability and student
characteristics for the TIMSS. In terms of gender, negative associations between word count and accuracy are stronger for males than females; however, this has a negligible effect size (d = -.03). In addition, negative associations between second-person pronouns and accuracy are stronger for males than females, although this too has a very small effect size (d = -.07). As in the NAEP data, there is evidence in the TIMSS that males are more negatively impacted than females by textual factors that make reading the problem more difficult, although the effects are very small. In terms of birth status, negative associations between second-person pronouns and accuracy are stronger for students not born in the U.S. This suggests that difficult readability factors may have
a stronger association to performance for non-U.S. born students than other students, which has some similarity to the language finding in the NAEP. However, the effect size is again very small (d = -0.07). For mathematics enjoyment, the positive association between concrete words and accuracy is significantly greater for students who enjoy mathematics more (d = .08), and the negative association between word count and accuracy are significantly less strong for students who enjoy mathematics more (d = .01). Although the latter result has a negligible effect size, there is some evidence that enjoying mathematics allows for stronger positive associations between performance and textual characteristics that make a problem easier to read, even when controlling for other background variables like mathematics achievement.
Finally, in terms of mathematics achievement (i.e., plausible values), we see that negative associations between word count and accuracy are less strong for higher achievement students, and this has a considerable effect size (d = 0.34). Further, negative associations between second-person pronouns and accuracy are less strong for higher achievement students (d = 0.30). There is also some evidence that positive associations between pronoun density and accuracy are lower for higher achievement students, but this has a negligible effect size (d = -.04). Overall, having higher mathematics achievement is associated with student performance having a weaker association with difficult readability factors, whereas students with lower mathematics achievement may be differentially negatively impacted by these factors.
Results for the NAEP and the TIMSS on Research Question 1 are summarized in Table 10. Note that, surprisingly, there were few significant interactions for SES (luxury items), language spoken at home, or birth status. This may be because controls for mathematics achievement were masking these differences. We explore this issue next.
Research Question 2: Differential Effects of Readability without Mathematics Achievement
For the analysis for Research Question 2, we omitted the Plausible Value (mathematics achievement) variable from the models. This is because there are well-known achievement gaps between students of different race, genders, and SES, and language backgrounds. The inclusion of this predictor may mask the differential effects of readability these students actually
experience, as much of the inequity is likely explained by falling behind in mathematics
knowledge. The results for this analysis are in Model 4 in Tables 8 (NAEP) and 9 (TIMSS). Here we focus on results that are new or different between these models and the previous models.
In the NAEP models, the biggest difference when removing the mathematics
achievement controls was the interaction effects that appeared for luxury items (our proxy for SES). Results showed that for students who own fewer luxury items, there is a stronger positive association between accuracy and more concrete words (d = .09) and the same held for more pronouns (d = .06), compared to those who owned more luxury items. Students who owned more luxury items had a weaker negative association between second-person pronouns and
performance (d = 0.16). In terms of findings related to race, the new models did not detect a significant interaction between the racial category of African-American and word concreteness, but did find that African-American students had a stronger negative association between
increased word count and decreased performance (d = -.06), compared to Caucasian students. The opposite trend was true for students of “Other” races/ethnicities, compared to Caucasian students (d = .07). Finally, the interaction between male students and second-person pronouns was no longer significant. Overall, when controls for mathematics achievement are removed, we see stronger differential readability impacts for luxury items (SES), and some racial differences.
In the TIMSS models, we see a similar trend that luxury items (our proxy for SES) are now more important for differential readability effects. The negative association between word count and accuracy is less strong for students with more luxury items students (d = .10).
Similarly, the negative association between word count and accuracy is stronger for students born outside of the U.S., although the effect size us very small (d = -.05). This suggests that the inclusion of mathematics achievement may have been masking some of the difficulties that students with fewer luxury items (low SES) and students born outside the U.S. experience with difficult-to-read word problems. In addition, two more interactions that were very close to significance in Model 3 now show as significant in Model 4 – the positive association between pronoun density and accuracy is stronger for students who enjoy mathematics more (d = .05),
and the association between presence of a real-world context and accuracy is significantly more positive for males than females, although the effect size is negligible (d = .02).
Additional Analyses
Exploring Word Count and Second-Person Pronouns
The strongest and most consistent effects in the above models tended to be for word count and presence of second-person pronouns. One hypothesis is that problems that are more mathematically difficult tend to have more words, and tend to use second-person pronouns, thus the interactions we are detecting are actually between problem difficulty and student
characteristics, not problem readability and student characteristics. While it is not clear whether there is a purely “mathematical” difficulty for a problem that is completely distinct from the “reading” difficulty of the problem, or whether it would even be sensible to try to separate these components, we present some additional explorations in this section.
We examined the problems that tended to be especially long or short and the problems that tended to have second-person pronouns. Examples of such problems were shown in Table 1. Problems that used second-person pronouns sometimes put the reader into the problem (e.g., the problem was a story about something “you” did). However, more often, these problems were using second-person pronouns to give the reader specific technical instructions (e.g., round your answer) or more general instructions to show their work or steps. Problems that had low word counts tended to give brief information for a simple calculation or definition, or had a small amount of text because they referred the reader to a visual. Problems that were long tended to describe a complex mathematical situation or give a significant amount of procedural instruction to the reader. Note that the presence of a real-world context was controlled for in all models, thus the findings were not being driven by an increased tendency of longer problems or problems with second-person pronouns to be in a real-world context.
This suggests that word count and second-person pronouns may be associated with mathematical aspects of the problem’s difficulty and complexity. In addition, these readability factors may be more likely to occur when the question is short answer (rather than multiple