University of Northern Colorado
Scholarship & Creative Works @ Digital UNC
Dissertations Student Research
5-2018
Theory of Planned Behavior Applied to High
School Science Teachers Implementing Next
Generation Science Standards
Anna Pierce
Follow this and additional works at:https://digscholarship.unco.edu/dissertations
This Text is brought to you for free and open access by the Student Research at Scholarship & Creative Works @ Digital UNC. It has been accepted for inclusion in Dissertations by an authorized administrator of Scholarship & Creative Works @ Digital UNC. For more information, please contact
Recommended Citation
Pierce, Anna, "Theory of Planned Behavior Applied to High School Science Teachers Implementing Next Generation Science Standards" (2018).Dissertations. 511.
© 2018 ANNA PIERCE ALL RIGHTS RESERVED
UNIVERSITY OF NORTHERN COLORADO Greeley, Colorado
The Graduate School
THEORY OF PLANNED BEHAVIOR APPLIED TO HIGH SCHOOL SCIENCE TEACHERS IMPLEMENTING
NEXT GENERATION SCIENCE STANDARDS
A Thesis Submitted in Partial Fulfillment of the Requirements for the Degree of
Master of Science
Anna Pierce
College of Natural and Health Sciences Department of Chemistry and Biochemistry
Chemistry: Education Emphasis
This Thesis by: Anna Pierce
Entitled: Theory of Planned Behavior Applied to High School Science Teachers
Implementing Next Generation Science Standards
has been approved as meeting the requirements for the Degree of Master of Science in College of Natural and Health Sciences in Department of Chemistry and Biochemistry, Program of Chemistry: Education
Accepted by the Thesis Committee:
____________________________________________________________ Corina E. Brown, Ph.D., Chair
____________________________________________________________ Richard M. Hyslop, Ph.D., Committee Member
____________________________________________________________ Robert J. Reinsvold, Ph.D., Committee Member
Accepted by the Graduate School
___________________________________________________________ Linda L. Black, Ed.D.
Associate Provost and Dean
iii ABSTRACT
Pierce, Anna. Theory of Planned Behavior Applied to High School Science Teachers Implementing Next Generation Science Standards. Published Master of Science thesis, University of Northern Colorado, 2018.
The high demand for a scientifically literate society and workforce led to the creation of the Next Generation Science Standards (NGSS) and their release in April 2013. NGSS are based on a call to improve science education at the primary and secondary levels and emphasize the importance of a more conceptual and hands-on approach to science. The purpose of this mixed methods research study was to examine, through the use of Ajzen’s theory of planned behavior, the factors involved in teachers’ intentions to implement the NGSS in high school science courses. Semi-structured interviews were performed with nine teachers and experts in the field who were asked for their opinions regarding the implementation and changes they have made in their lessons and pedagogy in order to accommodate NGSS. From this, salient beliefs were identified and used to develop a survey using the theory of planned behavior. Factors influencing high school science teachers’ (N=238) intentions to implement NGSS were identified through backward
elimination multiple regression and independent samples t-tests. From the results,
suggestions were provided on how to improve the adoption of NGSS and the effectiveness of professional development.
Keywords: Next Generation Science Standards, NGSS, implementation, science
iv
ACKNOWLEDGEMENTS
I wish to express my appreciation to my research advisor, Dr. Corina Brown, who was supportive and encouraging throughout this process. I am also grateful for the
guidance of my committee members: Dr. Richard Hyslop and Dr. Robert Reinsvold. My research would not have been possible without the many participants in my qualitative and quantitative studies and I am extremely appreciative for their willingness to participate. I would like to acknowledge the work of Icek Ajzen who proposed the theory of planned behavior, which guided much of my research. I am grateful for the advice on the finer points of grammar and usage from Marty Pierce and the helpful statistics discussions with Alan Arakkal.
v
TABLE OF CONTENTS CHAPTER
I. INTRODUCTION... 1
Purpose of the Study... 2
Significance of the Study... 3
Research Questions... 4
II. REVIEW OF LITERATURE... 5
Next Generation Science Standards... 5
Theoretical Framework... 9
III. METHODOLOGY... 18
Research Questions... 19
Part 1: Semi-structured Interviews (Elicitation Study) ... 19
Part 2: Pilot Study with Questionnaire... 23
Part 3: Full Study with Questionnaire... 29
IV. RESULTS AND DISCUSSION... 40
Part 1: Semi-structured Interviews (Elicitation Study) ... 40
Part 2: Pilot Study with Questionnaire... 51
Part 3: Full Study with Questionnaire... 56
V. CONCLUSION AND IMPLICATIONS... 81
Limitations... 82
Future Research... 83
Implications... 84
REFERENCES... 87
APPENDIX A SEMI-STRUCTURED INTERVIEW QUESTION... 93
vi
B PILOT STUDY QUESTIONNAIRE... 95
C INSTITUTIONAL REVIEW BOARD APPROVAL FOR
QUALITATIVE RESEARCH... 103
D INSTITUTIONAL REVIEW BOARD APPROVAL FOR
QUANTITATIVE RESEARCH... 105 E FULL STUDY QUESTIONNAIRE... 107
vii LIST OF TABLES TABLE
3.1. Elicitation Study Participant Demographics and Background
Information... 20
3.2. Response Types... 31
3.3. Demographics and Other Characteristics of Teachers... 32
4.1. Direct Construct Mean Score with Standard Deviation... 52
4.2. Indirect Construct Mean Score with Standard Deviation... 52
4.3. Simple Bivariate Correlations for Direct and Indirect Scores... 54
4.4. Direct Construct Mean Score with Standard Deviation... 56
4.5. Indirect Construct Mean Score with Standard Deviation... 57
4.6. Means and Standard Deviations for Indirect Salient Beliefs... 58
4.7. Means and Standard Deviations for Indirect Salient Beliefs Measuring Subjective Norm... 60
4.8. Means and Standard Deviations for Indirect Salient Beliefs Measuring Perceived Behavioral Control... 61
4.9. Simple Bivariate (Pearson’s) Correlations for BI with Direct and Indirect Constructs... 61
4.10. Simple Bivariate (Pearson’s) Correlations with Direct and Indirect Constructs... 62
4.11. Confirmatory Factor Analysis Theory of Planned Behavior Model Fit Results... 63
4.12. Standardized Results for Variances from Confirmatory Factor Analysis... 64
viii
4.13. Squared Multiple Correlations from Confirmatory Factor
Analysis... 65 4.14. Final Regression Model for BI as Dependent Variable as
Predicted by the ABd, SNd, PBCd, Gender, Years of Experience, and Familiarity with NGSS... 66 4.15. Regression Analysis for the Direct Construct as Dependent
Variable as Predicted by the Indirect Construct... 69 4.16. Attitude toward Behavior Salient Beliefs Independent Samples t
-test Comparing Low Intenders and High Intenders BI Score... 70 4.17. Subjective Norm Salient Beliefs Independent Samples t-test
Comparing Low Intenders and High Intenders BI Score... 73 4.18. Perceived Behavioral Control Salient Beliefs Independent Samples
ix LIST OF FIGURES FIGURE
2.1. Theory of planned behavior (Ajzen, 1991) ... 13
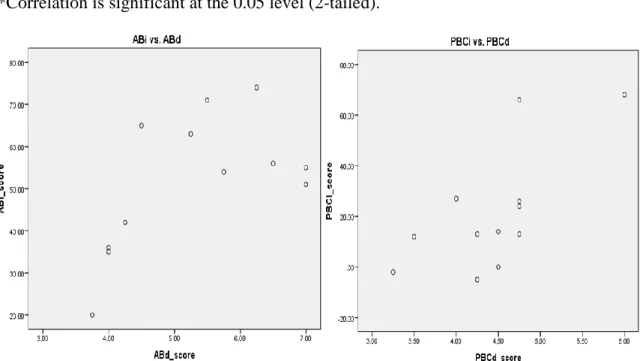
4.1. Scatter plot of bivariate correlations of ABi with ABd and PBCi with PBCd... 54
F.1. Scatter plot between studentized residual and standardized residual... 116
F.2. Partial regression plot between BI and familiarity... 116
F.3. Partial regression plot between BI and years of experience... 117
F.4. Partial regression plot between BI and gender... 117
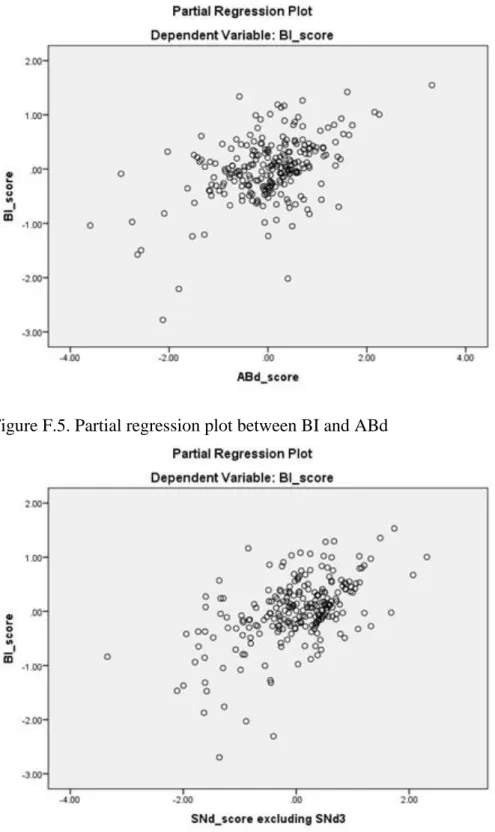
F.5. Partial regression plot between BI and ABd... 118
F.6. Partial regression plot between BI and SNd... 118
F.7. Partial regression plot between BI and PBCd... 119
F.8. Histogram of studentized residuals... 119
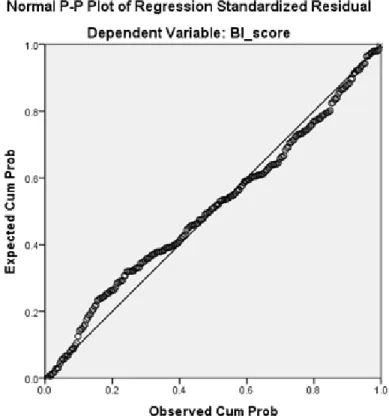
F.9. Normal P-P plot of regression standardized residuals... 120
F.10. Normal Q-Q plot of studentized residuals... 120
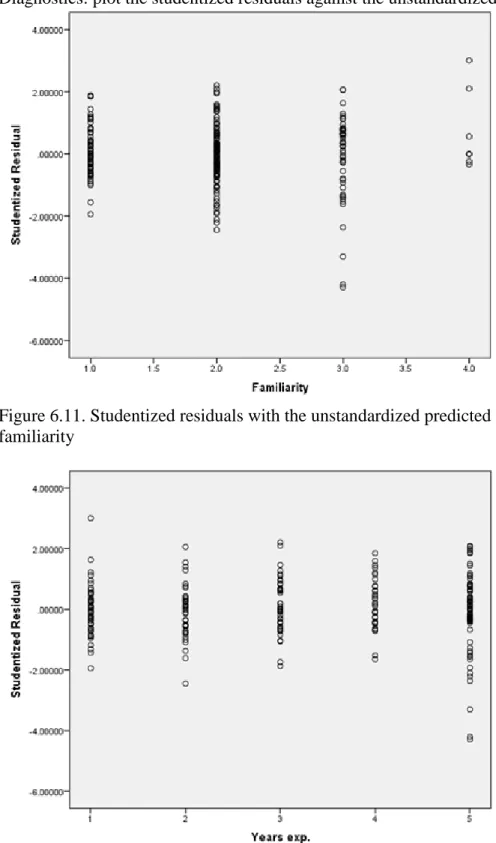
F.11. Studentized residuals with the unstandardized predicted values for familiarity... 121
F.12. Studentized residuals with the unstandardized predicted values for years of experience... 121
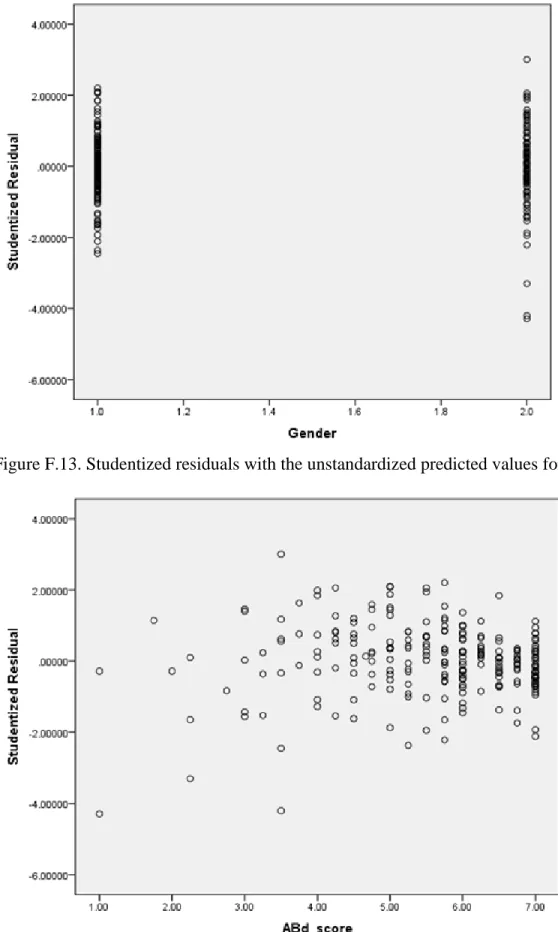
F.13. Studentized residuals with the unstandardized predicted values for gender... 122
x
F.14. Studentized residuals with the unstandardized predicted values
for ABd... 122 F.15. Studentized residuals with the unstandardized predicted values
for SNd... 123 F.16. Studentized residuals with the unstandardized predicted values
1
CHAPTER I INTRODUCTION
The United States is trailing other industrialized nations in math and science, ranking 29th and 22nd, respectively, out of 34 nations, according to the U.S. Department of Education (2013). There is a “need for a highly trained scientific workforce, and a scientifically literate citizenry has become imperative to the U.S.” (Bodner, 2011, p. 1). To address this need in the science field, the National Research Council (NRC)
established a committee to create the Next Generation Science Standards (NGSS). The NGSS are education standards adopted by multiple states in order to give all students a globally competitive science education. These standards are meant for science to be taught conceptually and are likely to cause teachers to teach differently (Cooper, 2013). Researching the implementation of the NGSS by teachers can help lead to an
understanding of the current state of NGSS adoption and lead to appropriate professional development on how to improve use of the standards in the classroom.
In order to create the NGSS, the NRC collaborated with the National Science Teachers Association (NSTA), the American Association for the Advancement of Science (AAAS), Achieve, and 26 states with the following goal in mind:
By the end of the 12th grade, students should have gained sufficient knowledge of the practices, crosscutting concepts, and core ideas of science and engineering to engage in public discussions on science-related issues, to be critical
consumers of scientific information related to their everyday lives, and to continue to learn about science throughout their lives. (National Research Council, 2012, p. 24)
2
This worthwhile goal requires further research in order to determine if it is truly being attained. One step to achieving this goal is to investigate the teacher attitudes that can lead to or prevent reform in science education. Many prior studies supported this statement: Bybee (1993), Crawley & Koballa (1991), Cuban (1990), Fullan & Miles (1992), Gess-Newsome et al. (2003), Haney, Czerniak, & Lumpe (1996), Smith & Southerland (2007), and Thompson (1992). All of these studies are at least a decade old and thus have not dealt with the recent NGSS. The present study is aimed to research the attitudes and intentions of high school science teachers who are required by their state to implement NGSS.
Purpose of the Study
The purpose of the present study was to examine, through the use of Ajzen’s theory of planned behavior, the factors involved in teachers’ intentions to implement the NGSS in high school science courses. In the first part of this study, I interviewed experts in the field of science education in order to obtain salient beliefs about the
implementation of NGSS in high school classrooms. Experts included university professors of science education and secondary science teachers who are implementing NGSS. The experts were questioned about their opinions of NGSS and how they believe the standards have affected their teaching and their students. The interview responses were analyzed for common themes. I then used this information to create a questionnaire, using Ajzen’s theory of planned behavior, to investigate the implementation of NGSS in the high school science classroom.
3
Significance of the Study
Teacher attitudes may be partly responsible for teachers’ decisions regarding NGSS implementation. Teachers may or may not be correctly implementing the NGSS in their classroom. The aforementioned studies, which occurred before the NGSS were created, reported that teacher beliefs and attitudes influence the implementation of reform. Those researchers observed that positive attitudes can promote reform while negative attitudes may inhibit reform. By researching teacher beliefs about the
implementation of NGSS, barriers to change can be identified and addressed in order to promote reform. Depending on teachers’ opinions and attitudes about NGSS, they may or may not be changing their lessons. Some teachers might be using previous science
standards in the classroom although they are required to use the new NGSS. Therefore, students are unable to receive the proposed benefits of the new standards.
Understanding the salient beliefs of high school science teachers can help
educators and administrators identify ways to increase the correct adoption of NGSS and provide appropriate professional development for teachers (Jones-King & Musselman, 2013). While there is novel research cited in the following literature review on
implications of NGSS in the science classroom, there is a lack of research discussing the implementation of these science standards in the classroom. The most recent
comprehensive study to investigate teachers’ behavioral intention and attitudes toward the implementation of science education standards was done over two decades ago with Ohio’s Competency Based Science Model strands (Haney et al., 1996). This research may provide educators and administrators information about barriers to NGSS
4
implementation, which they can then use to help improve professional development for teachers.
Research Questions
The first research question (Q1) was used for the semi-structured interviews (elicitation study), which was the first part of the research. The second (Q2) and third (Q3) research questions guided the full study with the questionnaire.
Q1 What are experts’ opinions regarding Next Generation Science Standards in high school and their implementation?
Q2 What are the salient reasons that teachers do or do not intend to implement NGSS in their high school science classroom?
Q3 What are the relationships between attitude toward implementing NGSS, subjective norm, perceived behavioral control and intention to implement the NGSS?
5
CHAPTER II
REVIEW OF LITERATURE
In order to understand the purpose of the current study and the theoretical
framework that was used, a discussion of the present state of NGSS research is provided followed by a description of the theory of planned behavior and its application in this study.
Next Generation Science Standards
Elementary, middle, and high school teachers must follow educational standards in every core subject area. These are either widely used standards such as the Common Core and NGSS or standards set and followed by the state or school district (Gross et al., 2013; Cooper, 2013). However, not all teachers implement the standards in the same manner. The present study is concerned with the Next Generation Science Standards (NGSS) and their implementation in high school science classrooms across the United States.
NGSS were released in April 2013 and have been adopted by 19 states in the U.S. and Washington, D.C. as of November 2017, and many other states have shown interest in adopting them (NGSS Lead States, 2013). The NGSS were written as performance expectations that describe what the student should know and be able to do in order to demonstrate mastery of a certain standard in an assessment. Prior to the release of NGSS, “A Framework for K-12 Science Education” was released in 2011 by the NRC, which
6
developed three dimensions for learning science: crosscutting concepts, disciplinary core ideas, and science and engineering practices. The NGSS also use these three dimensions as a framework for the standards. These dimensions are meant to promote integration of content throughout science learning (Bodner, 2011). Assessments need to include all three dimensions when implemented correctly (Cooper, 2013; NGSS Lead States, 2013).
Adoption and implementation of NGSS require states, schools, and teachers to make many changes. Implementation does not usually happen immediately and may take three to four years (Pruitt, 2014). Local communities have a variety of paths and
timelines toward the complete implementation of the standards, according to a report by Simpson et al. in 2017. Despite the different paths, common themes have emerged: “communication, capacity/network building, professional learning for all stakeholders, examination of instructional learning materials, development of an assessment system, and state and local policy development” (p. 2). In general, all of these big changes are taking longer than the four years initially estimated to implement these standards (Simpson et al., 2017). Pruitt (2014) warned that if the timeline takes longer than
originally predicted, “the sense of urgency is lost” (p. 155). One reason that this process is taking longer than expected might be due to teachers’ attitudes and beliefs toward implementation of NGSS, which my research attempted to address.
Schools are making several necessary changes such as the creation of new curricula and assessments as well as training for pre-service and in-service teachers, according to Cooper (2013). Pre-service teachers need to learn to teach science in a way that engages critical thinking, not just through lectures that promote passive learning and rote memorization. Teachers have to be prepared to understand science conceptually and
7
be able to answer the complex questions this new approach to learning may inspire in their students (Cooper, 2013). Similarly, Hanuscin and Zangori (2016) have five
recommendations for pre-service teacher education: 1) mastery of content knowledge, 2) understanding the NGSS and the Framework, 3) providing successful examples of NGSS in the classroom, 4) practice with implementing NGSS in the classroom, and 5)
collaboration with peers. Rodger Bybee (2014), a well-known science education expert, agreed that the field of science education needs to change how teachers are taught in order to reflect the educational shifts seen at the K-12 level when implementing NGSS. One example of a shift is that students are now asked to explain natural phenomena instead of learning facts. The implication of this shift is that “students develop models and make sense of the natural world by using evidence to develop explanations” (Bybee, 2014, p. 217). Lack of training in this new method of teaching or lack of time to be able to change lessons could be barriers for teachers implementing NGSS.
The transition to NGSS has not been without controversy. The Fordham Institute, a critic of NGSS, released a report evaluating each state’s standards and compared them to the NGSS using criteria that focused on content, rigor, and clarity of expectations. They gave the NGSS a “C” letter grade. Thirteen states, including Washington, D.C., earned higher grades than NGSS, 12 earned Cs like NGSS, and 26 states received a D or F. For the latter, Fordham Institute believed adopting NGSS would be an upgrade (Gross et al., 2013). However, schools who received a higher grade than the NGSS might actually be depreciating their existing curriculum by adopting the new and potentially inferior standards. Teachers who believe their previously-used science standards were better than NGSS may be less likely to implement NGSS.
8
Changes in assessments need to be made by teachers using NGSS, according to an article by Sondergeld, Peters-Burton, and Johnson (2016). They noted that many
assessments need to change to use an essay or short answer format instead of multiple choice in order to allow students to provide evidence of learning. Advantages of self-constructed responses include students being more creative, not guessing the answer, being required to use higher levels of integrated thinking, and being able to assess multiple objectives at a time (Sondergeld et al., 2016). Disadvantages include a longer time for completion of assessments, a longer time for teachers to grade, and more subjectivity in teacher grading (Sondergeld et al., 2016). These advantages and disadvantages possibly reflect beliefs that either promote or inhibit teachers correctly implementing NGSS.
There is currently very limited quantitative research dealing specifically with the implementation of NGSS. One quantitative report was based on American schools using NGSS in the Middle East and North Africa (MENA), which surveyed teachers about the current implementation of the standards (Simpson, Sunder, Gabler, & KDSL Global, 2017). They found that teachers attending trainings in the MENA region who were new to NGSS had uneasiness about the implementation of the standards and how it would affect their classroom. However, 30 minutes into the training, teachers realized that the goal of NGSS aligned with their own goals of what they want to see happening in their classrooms. As reported in the MENA, simple changes in professional development may improve teachers’ opinions of the standards here in the United States.
In the report’s survey of 75 teachers in the MENA region (Simpson et al., 2017), 84% believed that NGSS will lead to improved student learning, a majority have a plan
9
for transitioning to NGSS at their school, only 11% felt unprepared to teach using NGSS, and half of participants had participated in professional development and trainings on NGSS. One challenge that MENA region teachers face is that they are mainly non-native English speakers, but the emphasis on using science practices increased the accessibility of content despite the language challenges of NGSS being written in English. Overall, in part due to teacher beliefs, the transition for teachers and schools appeared to be positive in the MENA region.
While there is research evaluating NGSS (Gross et al., 2013) and predicting what teachers need to know in order to implement the standards (Bodner, 2011; Bybee, 2014; Cooper, 2013; Sondergeld et al., 2016), there is no research detailing how the
implementation of NGSS is progressing in the classrooms across the United States or how teachers’ attitudes and beliefs might affect the implementation. The purpose of the current study is to determine salient beliefs, both positive and negative, held by high school science teachers about the implementation of NGSS under the framework of the theory of planned behavior.
Theoretical Framework Theory of Planned Behavior
By using the theory of planned behavior as a theoretical framework, it can be determined which salient beliefs prevent or promote teachers’ implementation of NGSS in high school science classrooms. Ajzen (1985) proposed the theory of planned
behavior, which uses the idea that humans behave using goals and plans to direct their behavior. Social psychologists agree that humans act based on their intentions to act, although not all intentions are acted upon.
10
These general concepts allow for the theory of planned behavior to predict and explain a behavior in certain contexts. A person’s intent to behave in a certain way is the immediate determinant of that behavior. The immediate determinants to intention are identified as the attitude toward the behavior, the subjective norm, and the perceived behavioral control (Ajzen, 1985). The attitude toward the behavior is the degree of positive or negative assessment given to the behavior. The subjective norm is the social pressure to perform or not perform that behavior. The perceived behavioral control is the level of difficulty or ease with performing the behavior based on various obstacles or aids. Each of these variables might have more or less of a weight depending on the behavior (Ajzen, 1991).
A person’s attitude toward behavior (AB) is defined as a personal belief that
performing a specific behavior is either positive or negative, which is depicted in Equation 1 (Ajzen, 1985).
𝐴𝐵 𝛼 ∑𝑛𝑖=1𝑏𝑖𝑒𝑖 (1)
In the equation, the strength of the salient behavioral belief (b) is multiplied by the
outcome evaluation (e) of the belief (either positive or negative). These values are
summed for the number of (n) salient beliefs. A person’s attitude toward the behavior
(AB) is directly proportional (𝛼) to the summative belief index shown in Equation 1. It is
important that the salient beliefs are truly salient instead of selected beliefs that were thought to be important (Ajzen, 1991). For example, a high school science teacher might believe that implementing NGSS will increase student engagement in learning science, which indicates a positive attitude toward the behavior.
11
Belief strength (b) is best assessed on a 7-point scale, such as likely to unlikely,
while evaluation of a belief (e) can be measured using a 7-point evaluative scale, such as
good and bad (Ajzen, 1991). Multiple items are needed in order to assess belief strength and evaluation of a belief. The 7-point scales can be unipolar (1 to 7 or 0 to 6) or they can be bipolar (-3 to +3). It is thus reasonable that the belief strength can be measured with a 1 to 7 scale while the evaluative scale uses a -3 to +3 scale. It is beneficial to use scales in this manner because the interpretation of scores is easier when the midpoint of the scale is zero, clearly showing if the final score represents an attitude for or against
implementing NGSS. This was the practice used in the present research design. A person’s subjective norm is defined as the social pressures perceived by a person to perform or not perform a specific behavior. People who see a behavior as positive and believe that others think it is important tend to perform that behavior (Ajzen, 1985). Teachers might be influenced by their administrators, other teachers, or students’ parents, thus affecting their implementation of the standards. A similar equation to Equation 1 can be derived for subjective norm (SN) where the strength of the normative
belief (n) is multiplied by the person’s motivation to comply (m) to the individual or
group in question as shown in Equation 2. The subjective norm is directly proportional (𝛼) to the sum of the products for the number of n salient individuals or groups (Ajzen,
1991).
𝑆𝑁 𝛼 ∑𝑛𝑖=1𝑛𝑖𝑚𝑖 (2)
Prior researchers (Ajzen, 1991) have concluded that using a unipolar measure for motivation to comply and a bipolar measure for the strength of normative beliefs results in optimal scoring and was used in the present research design.
12
A person’s perceived behavioral control takes into account time, opportunity, and dependence on others in order to perform the behavior because each of these factors may make changes to a person’s intentions. High school teachers might not feel they have control over the available resources, which could limit their implementation. Equation 3 is used to determine perceived behavioral control (PCB) where each control belief (c) is
multiplied by the control power (p) of that salient control factor which might inhibit or
promote performance of that behavior. The summed products for the number of n salient
control beliefs is proportional to the perceived behavioral control (Ajzen, 1991).
𝑃𝐶𝐵 𝛼 ∑𝑛𝑖=1𝑐𝑖𝑝𝑖 (3)
In the present study, to score perceived behavioral control, a unipolar scale was used for the strength of control belief, while a bipolar scale was used for the control power so that a neutral score was zero.
The variables of attitude toward the behavior, subjective norm, and perceived behavioral control can be weighted more or less as shown in the multiple linear
regression analysis, which was performed in the full study. The regression coefficients from these analyses are weights (w) of these variables. The theory of planned behavior
can be summarized by Equation 4 where the behavior (B) can be predicted by the
behavioral intent (BI), which can be estimated by the weighted contributions of attitude
toward behavior, subjective norm, and perceived behavioral control (𝑤1, 𝑤2, 𝑤3).
B~BI~(𝐴𝐵 + 𝑆𝑁 + 𝑃𝐵𝐶) = 𝑤1𝐴𝐵 + 𝑤2𝑆𝑁 + 𝑤3𝑃𝐵𝐶 (4)
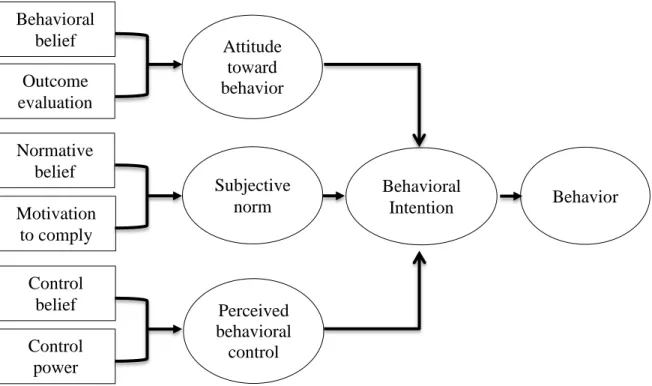
The relationships between the variables in the theory of planned behavior are shown in Figure 2.1 (Ajzen, 1991). For each of the direct variables (attitude toward behavior, subjective norm, and perceived behavioral control), there is a proportional
13
indirect measure (behavioral beliefs X outcome evaluations, normative beliefs X
motivation to comply, and control beliefs X control power) as described in Equations 1, 2, and 3.
Figure 2.1. Theory of planned behavior (Ajzen, 1991)
The correlations between intention and behavior as well as the correlations between direct and indirect measures should be reported when possible. The latter was reported in the present study, since behavior was not measured. In a sample of research findings in the health and social science fields, these major relationships among the variables in the theory of planned behavior were found to have strong intention-behavior correlations that exceed 0.70 (Ajzen, 1985). The correlations between intention-attitude toward behavior and intention-subjective norm were also all highly accurate predictions of intentions, which support the use of the theory of planned behavior in the health and social science disciplines (Ajzen, 1985).
Behavioral belief Outcome evaluation Normative belief Motivation to comply Control belief Control power Attitude toward behavior Subjective norm Perceived behavioral control Behavioral Intention Behavior
14
There are three requirements in order to accurately predict a behavior using the theory of planned behavior (Ajzen, 1991). First, the behavior that is being predicted needs to be compatible with the measures used for intention and perceived behavioral control. Second, the perceived behavioral control needs to accurately reflect actual control. If the items on the questionnaire are not applicable, then they will not be helpful in predicting if the behavior is taking place. Third, the time between assessment and observation of the behavior must be stable. For example, a teacher’s responses to the questionnaire may no longer be valid if he or she attends professional development about NGSS shortly after taking the questionnaire.
Time is one factor that might cause changes in a person’s intention and behavior. Thus, the passing of time can cause multiple issues with the theory. One issue is with the salience of beliefs. As the performance of a behavior, such as the implementation of NGSS, becomes closer in time, the person might have more negative beliefs about that behavior, which might ultimately prevent the person from performing that behavior. For example, a teacher might not implement NGSS as time goes on due to other obligations that need to be met before he or she has time to work on changing lesson plans. Another issue is the opportunity to learn new information over time that might change a person’s beliefs. When new information about the behavior becomes available, a person’s beliefs may change, thus affecting his or her intent to perform the behavior. In general, if a person has strong intentions to perform the behavior, he or she will likely still continue with the plan despite new information, and the opposite would be true of someone with weak intentions (Ajzen, 1985; Francis, 2004).
15
Applications of Theory of Planned Behavior in Science Education
Several cases show how the theory of planned behavior can be used successfully in the field of science education (Crawley, 1988; Crawley & Koballa, 1991; Haney, Czerniak, & Lumpe, 1996; Jones-King & Musselman, 2013; Listman & Kapila, 2016). Although the findings in those studies do not necessarily apply to the findings of the present study, they were helpful in the creation of the present study’s methodology. These cases also help support the use of the theory of planned behavior in the context of the present study.
The application of the theory of planned behavior is demonstrated by Crawley and Koballa’s (1991) study of Hispanic-American student enrollment in a high school
chemistry course. The authors wanted to learn what salient beliefs were held by students which either led them to enrolling or not enrolling in chemistry. All relationships between indirect (behavioral, normative, and control beliefs) and direct (attitude, subjective norm, and perceived behavioral control) constructs were analyzed. Crawley and Koballa
observed that the students rely on their attitude about chemistry and not what others want them to do. The students were also somewhat influenced by personal perceptions of control and potential barriers that they believe exist. The use of the theory of planned behavior was supported by their findings.
The theory of reasoned action, a modification to the theory of planned behavior that does not use perceived behavioral control as a variable, was explored by Crawley in 1988 with the intent to understand and predict science teaching behavior. In Crawley’s study, 42 teachers enrolled in a summer professional development class about
16
a final questionnaire from which Crawley was able to determine salient beliefs of teachers. He observed that the teachers’ attitude toward the science teaching behavior strongly influenced their use of investigative methods when teaching physical science, whereas social pressure had little influence on teachers. From these studies, one can predict that teacher attitudes, which I explored in my research, will have a stronger influence than the subjective norm.
Additionally, Listman and Kapila (2016) used the theory of reasoned action, the modified version of the theory of planned behavior, to explain student and classroom attitudes toward science, technology, engineering, and mathematics (STEM) subjects and how the attitudes relate to “student behaviors of engagement, performance, and
persistence in STEM subjects and subsequent choice of a STEM career” (p. 2). Their goal was to foster positive attitudes about STEM among students using a specific curriculum, so a pre- and post-test methodology was used.
A study exemplifying the methodology for pilot research was performed by Jones-King and Musselman (2013). They conducted a study using the theory of planned behavior as their theoretical framework to explore factors that would promote high quality professional development for science and math teachers. Their pilot study
consisted of 18 participants and a 60 question survey. Using Cronbach’s alpha and factor analysis, they were able to estimate internal consistency reliability and determine if any questions should be excluded from their questionnaire. The purpose of their analysis was to validate the use of instrumentation, which was supported. However, some of the items did not fully align with the theory of planned behavior, but the authors believed that it was due to the small sample size and planned to continue to use those items for a full
17
study with a larger sample size. Their methodology was used and adapted for the present research.
The study by Haney, Czerniak, and Lumpe (1996) was used as a model in the present research design. The purpose of their study was to use Ajzen’s theory of planned behavior in order to determine which factors influence teachers’ intentions to implement the four strands of Ohio’s Competency Based Science Model: inquiry, knowledge,
conditions, and applications. Haney et al. found that attitudes toward the behavior had the strongest influence on Ohio teachers’ intent to implement the science standards.
Similarly, in the present study, I will investigate the attitudes and intentions of high school teachers in the implementation of the NGSS. There has not been a study using the theory of planned behavior with science standards since the research of Haney et al. The present research will potentially lead to the improved adoption of these standards and improved professional development for teachers using NGSS.
In this chapter, the literature relating to the NGSS, the theory of planned behavior, and applications of the theory were considered. The application of the theory of planned behavior in the context of this study will be further discussed in the next chapter.
18
CHAPTER III METHODOLOGY
This chapter presents the methods employed in conducting the study, including the research questions, research design, data collection, and instrumentation. A multi-method approach to data collection was used and the research was conducted in several stages starting with semi-structured interviews (Part 1), then a pilot study (Part 2), followed by the full study (Part 3).
Guidelines for conducting a study (Ajzen, 1985; Ajzen 1991) and constructing a questionnaire (Francis et al., 2004) using the theory of planned behavior were followed. Part 1 of the study consisted of semi-structured interviews (Appendix A) that were conducted in order to identify salient beliefs held by teachers regarding the
implementation of NGSS. The findings of the semi-structured interviews were used, in Part 2 of the study, to develop the items in the questionnaire (Appendix B) related to the direct measures (attitude toward behavior, subjective norm, perceived behavioral control) and indirect measures (behavioral beliefs X outcome evaluations, normative beliefs X motivation to comply, and control beliefs X control power). This questionnaire was piloted (Part 2) with a small sample size. Following this, any errors in the questionnaire were addressed before completing a full study (Part 3) with a larger sample size (see Appendix E for full study questionnaire).
19
Research Questions
The first research question (Q1) guided the first part of the research, which was the semi-structured interviews (elicitation study). The second (Q2) and third (Q3) research questions guided the full study with the questionnaire.
Q1 What are experts’ opinions regarding Next Generation Science Standards in high school and their implementation?
Q2 What are the salient reasons that teachers do or do not intend to implement NGSS in their high school science classroom?
Q3 What are the relationships between attitude toward implementing NGSS, subjective norm, perceived behavioral control and intention to implement the NGSS?
Part 1: Semi-structured Interviews (Elicitation Study)
Through semi-structured interviews, the first research question was addressed. This research question was intentionally kept broad due to the exploratory nature of this study. The findings from the interviews were analyzed to create the questionnaire used in the pilot study and full study.
Participants
The participants for the elicitation study consisted of nine professors of science education and secondary science teachers located in the U.S. West and Midwest. In order to be included in the study, participants needed to have familiarity with NGSS and/or K-12 science education. Three of the participants were middle or high school teachers who have been working to implement NGSS in their classrooms. Four of the participants were university professors of science education or education. Two of the participants were not professors or teachers, but have extensive experience with the process of implementation
20
of NGSS due to the organizations with which they are affiliated. A summary of the participant demographics and background are given in Table 3.1.
Table 3.1. Elicitation Study Participant Demographics and Background Information
Participant Code
Gender Role in Education Years of Experience in the Field of Education Are you familiar with NGSS? (Yes, No, Somewhat) 1 M Professor of Biology
who teaches biology and pre-service education
>15 years Yes
2 F University administrator
who works with graduate level science education
>15 years Yes
3 F Science representative
for a state Department of Education who
previously taught pre-service teacher education, chemistry, and biology
>15 years Yes
4 M Professor of Chemistry
who teaches chemistry and pre-service teacher education
>15 years Somewhat
5 F High school chemistry
teacher
10-15 years Yes
6 F High School chemistry,
biology, and earth science teacher
<2 years Yes
7 M Professor of Chemistry
and Chemistry Education
>15 years No
8 F Professor of pre-service
teacher education
10-15 years Yes
9 M Middle school science
teacher
<2 years Yes
Data Collection
In-depth interviews were used in order to understand the experiences of science education experts. This type of interview is one of the most common qualitative methods and is “optimal for collecting data on individuals’ personal histories, perspectives, and
21
experiences” (Mack, Woodsong, MacQueen, Guest, & Namey, 2005). During the in-depth interviews, I considered myself the student seeking knowledge on the topic of implementation of NGSS while the interviewee was the expert sharing their experiences; this mindset is an essential part of the in-depth interview (Mack et al., 2005). Institutional Review Board (IRB) approval was obtained from the University of Northern Colorado (Appendix C)--IRBNet ID: 957989-2.
Participants were interviewed either in person, by phone, or by written
communication. A demographic form, including information such as role in education, years of experience, and familiarity with NGSS, and a consent form were completed before the interview. The administration of the interview, which contained 13 semi-structured questions (see Appendix A), took 30-60 minutes. Phone and in-person interviews were audio recorded and later transcribed. A written record was kept for participants who chose to answer the questions via a word document.
Trustworthiness and Rigor
To ensure trustworthiness in the elicitation study, an external person with
expertise in qualitative research and I discussed and were in complete agreement with the resulting themes. To show consistency and trustworthiness in the results, a triangulation was used by comparing the interviews of secondary teachers to professors of science education in which similar themes among both groups of participants were observed.
Personal Stance of the Researcher
My interest in studying NGSS arose because I will soon be a high school science teacher implementing these science standards. I have had the opportunity to create several lessons and units using NGSS. This experience has created an interest in learning
22
about teachers’ perspectives on how implementation is going in their classrooms. I have had an overall positive experience using NGSS in the classroom, but I was interested to hear both positive and negative opinions of these standards.
Theoretical Stance
Approaching this study through a social constructionist theoretical stance allowed the participants and me to identify the perceptions of these science standards and how they are implemented in schools. Social constructionism acknowledges that we are social beings who construct knowledge through interactions with each other and our world (Creswell, 2013). All participants had their own ideas and opinions of the standards due to their unique experiences. Furthermore, I wanted to ensure an interview environment in which they felt comfortable voicing their opinions. Their reality of using the science standards is dependent on the participants’ classroom and life experiences, thus representing a social constructionism theoretical stance.
Data Analysis
The interview transcripts were analyzed for common themes and patterns
employing NVivo Pro 11 software using thematic analysis procedures (Creswell, 2013). “Thematic analysis is a method for identifying, analyzing, and reporting patterns
(themes) within data” (Braun & Clarke, 2006, p. 6). The transcripts were organized and categorized into concepts and keywords commonly discussed in the interviews. Data were connected using themes to show how concepts were interrelated. Based on the results of the analysis, a quantitative questionnaire was created to send to high school science teachers.
23
Part 2: Pilot Study with Questionnaire
In the pilot study, the findings from the responses were analyzed to address changes that needed to be made to the questionnaire that would be used in the full study. The pilot study consisted of a small sample size that was not the intended sample
population, so no research questions were addressed. However, the pilot study provided important feedback for the improvement of the questionnaire.
Participants
The sample for the pilot study consisted of University of Northern Colorado (UNC) Chemistry Graduate Teaching Assistants (GTAs), who taught laboratories in chemistry at UNC, and UNC pre-service chemistry teachers. This sampling frame was chosen based on convenience and is similar to the target population of high school science teachers due to their experience in science education. Questionnaire requests were sent by email to the GTAs and UNC pre-service chemistry teachers. Email lists were obtained from the Department of Chemistry and Biochemistry at UNC. The sample consisted of those who were willing and able to participate in the survey. The initial email included a link to the Qualtrics questionnaire and was sent to 33 potential
participants. A follow-up reminder email was also sent a week later to those who had not yet completed the survey. Overall, 14 people opened the survey but it was completed by only 12 participants, which means 36% of those who were emailed completed the survey. Of the 12 who completed the survey, 11 were UNC GTAs and one was a pre-service teacher; five were male, six were female, and one was gender fluid using the write-in option; seven were not familiar with NGSS, two were slightly familiar, and three were moderately familiar; seven had 0-4 years teaching experience and five had 5-9 years
24
teaching experience. Institutional Review Board (IRB) approval was obtained from Susan Hutchinson as a part of the SRM 700 Advanced Research Methods course during the Fall 2017 semester.
Survey Instrument
The pilot questionnaire (Appendix B) contained several parts, which include demographic questions, questions using the theory of planned behavior, and questions assessing the quality of the survey. A total of 65 items were included in the questionnaire and took participants approximately 10-15 minutes to complete. First, four demographic questions were asked, which include participants’ current role in education, years of teaching experience, gender, and familiarity with NGSS. Following this, the participants were provided with instructions to “respond to all of the survey questions as if you are going to be teaching chemistry at a high school and your school is in a state that has adopted NGSS as the science standards for K-12 students.” The participants were also provided with a definition of NGSS in case they were unfamiliar with the standards. After the participants were provided with instructions and the NGSS definition, they proceeded to the remaining questionnaire items.
The questionnaire items using the theory of planned behavior were developed using recommendations by Ajzen (1985; 1991) and Francis (2004). The questionnaire contains both direct and indirect measures related to the theory of planned behavior. A standard 7-point scale was used to construct the measures. The participants rated their beliefs about NGSS on a scale of 1 to 7 (all direct measures, behavioral beliefs,
motivation to comply, and control beliefs) or -3 to +3 (outcome evaluations, normative beliefs, and control power) with varying scale descriptors, such as extremely unlikely to
25
extremely likely and not at all to very much. The questionnaire is composed of four sets of questions using the theory of planned behavior as follows (see Appendix B).
Behavioral intentions to teach using Next Generation Science Standards.The first set of questions related to the participants’ intentions to teach NGSS. There were three items to measure behavioral intention (BI), which is a direct variable. An example is “I expect to implement NGSS in my classroom” rated on a scale of strongly agree to strongly disagree. In order to calculate the score for BI, the mean of these three items was determined, and thus will have a possible score range of 1 to 7. A low score means respondents do not intend to implement NGSS and a high score means they have strong intentions to implement NGSS. A demonstration of internal consistency greater than 0.6 is important for all of the direct variables, which would mean that 40% or less of the variance in responses to the items would represent random measurement error (Francis et al., 2004). Therefore, internal consistency closer to one is ideal. The reliability estimate based on Cronbach’s alpha for BI was 0.849 in the pilot study.
Attitude toward implementation of Next Generation Science Standards.The second set of questions related to attitudes about implementing NGSS (attitude toward the behavior). There were four items to measure the direct variable for attitude toward the behavior (ABd) and there were 22 items to measure the indirect variable (ABi). The following two items representing the salient belief of NGSS helping students to think critically were used as a part of the attitude toward behavior indirect variable:
1) My implementation of the NGSS would help students to think critically. (extremely unlikely 1 2 3 4 5 6 7 extremely likely)
26
2) Helping my students to critically think is...
(extremely undesirable -3 -2 -1 0 1 2 3 extremely desirable) Item 1 addressed the behavioral belief, while item 2 addressed the outcome evaluation.
A score for ABd was calculated by taking the mean of the responses on the 1 to 7 scale. A score for ABi was calculated using the scales 1 to 7 and -3 to +3. For every question with a 1 to 7 scale, there is a corresponding question with a -3 to +3 scale as shown in the two example questions above. The 1 to 7 scales are multipliers to amplify the -3 to +3 score by that amount. For example, a participant might answer 5 on the 1-7 scale and -2 on the -3 to +3 scale so that his or her score will be 5 x -2 = -10 for that item. For each salient belief, the response of the behavior belief is multiplied by the response of the outcome evaluation; then each of these products is summed and analyzed. There were 11 salient beliefs for ABi. For the ABd and ABi scores, a positive score means that the participant felt positively about implementation of NGSS whereas a negative score means that the participant felt negatively about implementation of NGSS. The possible score range for ABd was 1 to 7 and ABi was -231 to 231. The score range for ABi comes from Equation 1 described in Chapter II, in which the participant’s score on the unipolar scale (1 to 7) is multiplied by the bipolar scale (-3 to +3) for a possible range of -21 to 21 for each individual salient belief. This possible range is then multiplied by the 11 salient beliefs to obtain the possible score range for ABi (-231 to 231). The reliability estimate based on Cronbach’s alpha for ABd was 0.957, for ABi was 0.300, and for combined ABd and ABi was 0.705 in the pilot study.
Subjective norm. The third set of questions related to determining the social pressures perceived by the participant to implement NGSS or not to implement NGSS (subjective norm). There were three items to measure the direct variable for subjective
27
norm (SNd) and there were 10 items to measure the indirect variable (SNi). Similar to attitude toward the behavior, two items were used for the indirect variable of subjective norm for the salient belief that other science teachers implement NGSS:
3) Other science teachers (do/do not) implement NGSS (do not 1 2 3 4 5 6 7 do)
4) Doing what other science teachers do is important to me. (not at all -3 -2 -1 0 1 2 3 very much)
Item 3 assesses the strength of the normative beliefs, while item 4 assesses the participant’s motivation to comply.
A score for SNd was calculated by taking the mean of the responses on the 1 to 7 scale. A score for SNi was calculated by multiplying the response for the normative belief by the response for the motivation to comply and then each of these products is summed. There were five salient beliefs for SNi. A positive score means that the participant experienced social pressure to implement NGSS whereas a negative score means that the participant experienced social pressure not to implement NGSS. The possible score range for SNd was 1 to 7 and SNi was -105 to 105, which was obtained from Equation 2 in Chapter II. The sample reliability based on Cronbach’s alpha for SNd was 0.181, for SNi was 0.542, and for combined SNd and SNi was 0.598 in the present pilot study.
Perceived behavioral control.The fourth set of questions related to the perceived barriers or aiding factors which could make it easier or harder to implement NGSS (perceived behavioral control). There were four items to measure the direct variable for perceived behavioral control (PBCd) and there were 12 items to measure the
28
indirect variable (PBCi). For the independent variable of perceived behavioral control, these two items cover the salient belief that teachers are limited by their resources:
5) When I am implementing NGSS, I feel that I do not have enough resources (funding, curriculum materials, training, equipment, etc.)
(extremely unlikely 1 2 3 4 5 6 7 extremely likely)
6) Having available resources (funding, curriculum materials, training, equipment, etc.) would make it (extremely difficult/extremely easy) to implement NGSS. (extremely difficult -3 -2 -1 0 1 2 3 extremely easy)
Item 5 assesses the control belief, while item 6 assesses the control power.
A score for PBCd was calculated by taking the mean of the responses on the 1 to 7 scale. A score for PBCi was calculated by multiplying the response for the control belief by the response for the control power and then each of these products is summed. There were six salient beliefs for SNi. For perceived behavioral control, a positive score means that the participant felt in control of implementing NGSS in his or her classroom, while a negative score means that the participant did not feel in control of implementing NGSS. The possible score range for PBCd was 1 to 7 and PBCi was -126 to 126, which was obtained from Equation 3 in Chapter II. Reliability estimates based on Cronbach’s alpha for PBCd was 0.435, for PBCi was 0.570, and for combined PBCd and PBCi was 0.686 in the pilot study.
Survey feedback. Following the completion of the questionnaire, the participants were asked several questions about the quality of the survey: 1) Are there any questions that were confusing or difficult to answer? 2) At what point in the survey did you lose interest? 3) How might the format of this survey be improved? Responses to these questions helped with improving the questionnaire before conducting the full study.
29
Procedure
Pilot study participants were asked to complete the Qualtrics survey online. Based on the survey feedback about the quality of the survey and the results from the pilot study, the instrument was revised with several changes to the scale endpoints and
addition of an SNd item. These changes were made before conducting the full study with high school science teachers. The changes are further discussed in Chapter IV Results and Discussion.
Data Analysis
Reliability of scores on each variable in the questionnaire was calculated using Cronbach alpha procedures. Direct variable score constructs that do not provide acceptable internal consistency, based on guidelines provided by Francis et al. (2004), may be revised or specific items in the construct may be omitted. They stated that an acceptable internal consistency is alpha ≥ 0.6, which means that all direct variable items can be included in the overall score for the construct (BI, ABd, SNd, and PBCd). It is important to note that Cronbach’s alpha is not very reliable at this small sample size (N=12), therefore, omission of items was not done during the pilot study. SPSS (Version:
IBM SPSS Statistics 24) was used to compute all statistical analyses.
For the pilot study, there was not enough statistical power to perform multiple regression analysis, confirmatory factor analysis, or independent samples t-tests.
However, these statistical analyses were performed with the full study.
Part 3: Full Study with Questionnaire
Through the full study, the second and third research questions were addressed. Based on pilot study results, the questionnaire used was improved upon for use in the full
30
study (see Appendix E). The improvements are discussed in Chapter IV Results and Discussion.
Participants
The participants in the full study consisted of high school science teachers in a state that has adopted NGSS. The sampling frame that was used is based on a list of high school science teachers in Iowa, a state that has adopted NGSS. State support and
resources for education varies with each state and states adopted NGSS at different times. By surveying one state, these differences can be controlled. Institutional Review Board (IRB) approval was obtained from the University of Northern Colorado (Appendix D)--IRBNet ID: 1159749-1.
A list of Iowa high schools found at educationbug.org was used and each school website was viewed to compile science teacher staff email addresses. These email addresses were used to recruit participation in the full study. Alternative schools, which provide a different educational approach for students who may be considered at-risk, were not included in the full study. Twenty-eight schools were excluded due to a lack of teacher contact information on the school website. In Iowa, the survey was sent to 1,023 high school science teachers at 321 different high schools. The response rate was 25.2% for those who started the survey and the completion rate was 86.8%. Additionally, the National Science Teacher Association (NSTA) had a list server titled “NGSS,” that was utilized to obtain participants from areas other than Iowa. Unfortunately, a response rate cannot be calculated for the list server, because the survey request was sent to an
unknown number of people. An initial email with a link to the questionnaire and a follow-up reminder email were sent to the Iowa high school science teachers and the five
31
NSTA list servers. The response types (completed, partial, and screened out) were recorded in Qualtrics and are presented in Table 3.2. Screened out participants consisted of those who answered no to the question “Are you currently a high school (9th-12th grade) science teacher?” The demographics of participants are shown in Table 3.3. Table 3.2. Response Types
Response Type N (%)
Completed 238 (87.18%)
Partial 19 (6.96%)
32
Table 3.3. Demographics and Other Characteristics of Teachers (N=257 *Completed and Partial Response)
Characteristics N (%)
Gender 249
Female 149 (59.84%)
Male 100 (40.16%)
Teaching experience (years) 253
0-4 51 (20.16%) 5-9 40 (15.81%) 10-14 43 (17.00%) 15-19 35 (13.83%) >20 84 (33.20%) Location 253 Rural 148 (58.50%) Suburban 77 (30.43%) Urban 28 (11.07%) State 249 Iowa 213 (85.54%) Other State* 36 (14.46%) Familiarity with NGSS 252 Extremely Familiar 61 (24.21%) Very Familiar 129 (51.19%) Moderately Familiar 55 (21.83%) Slightly Familiar 7 (2.78%) Not Familiar At All 0 (0.00%) Grade Level (Select all that apply)
9th 133 (18.63%)
10th 181 (25.35%)
11th 203 (28.43%)
12th 197 (27.59%)
Content Area (Select all that apply)
Biology 133 (19.62%)
Chemistry 121 (17.85%)
Physical Science 93 (13.72%)
Physics 82 (12.09%)
Earth Science 69 (10.18%)
Anatomy and Physiology 62 (9.14%) Environmental Science 52 (7.67%)
Other 45 (6.64%)
Engineering 21 (3.10%)
*Other state (N): Arizona (1), California (7), Colorado (1), Idaho (1), Illinois (3), Kansas (1), Louisiana (1), Michigan (2), Minnesota (1), New Jersey (5), New York (1), North Carolina (1), Pennsylvania (1), Rhode Island (1), South Carolina (2), Washington (1), Wisconsin (5), Wyoming (1).
33
Survey Instrument
Demographic questions were asked of participants, but questions regarding the quality of the survey were not asked for the full study. The demographic questions that were asked include gender, grade level taught, subject(s) taught, geographic location (rural, suburban, and urban), years of teaching experience, and familiarity with NGSS (Table 3.3). The survey was programmed to screen out participants who were not high school teachers and who stated that they were not at all familiar with NGSS. A total of 66 items were in the questionnaire. One question for the SNd variable was added in order to improve internal consistency reliability. The SNd item was, “People who are important to me want me to implement NGSS.” The scales on some questions were reversed so that all positive responses were on the left and all negative responses were on the right. One instructed response item was added to prevent response set (Meade & Craig, 2012). This item stated, “To ensure the quality of this survey, please click on ‘strongly agree’ for this item.” The order of the direct variable questions in the survey was mixed up so that participants did not read all of those items at the same time since they have similar content. Otherwise, all questionnaire items remained the same from the pilot study to the full study (see Appendix E).
Validity
According to the theory of planned behavior (Ajzen, 1985; Haney et al., 1996), instrument validity is established in two ways: content validity and construct validity. Content validity is when we can “logically conclude whether or not the test content comprises an adequate definition of what it claims to measure” (Isaac & Michael, 1997, p. 125). To ensure content validity, the elicitation study was conducted and the results
34
were used to develop measures for the questionnaire. Furthermore, since aggregation represents a more valid measure than any single belief, including at least three behavioral beliefs, normative beliefs, and control beliefs is recommended (Francis et al., 2004; Ajzen, 1991). By including more beliefs as a part of the indirect measures, this “almost certainly improve[s] the validity of the study” (Francis et al., p. 26). For all three indirect constructs in the questionnaire, more than three salient beliefs are covered, which
supports the validity of the full study.
Construct validity answers the question, “To what extent do certain explanatory concepts or qualities account for performance on the test?” (Isaac & Michael, 1997, p. 125). Construct validity is evident by the significant correlations between the direct and indirect measures of the three constructs (AB, SN, and PBC). For the direct and indirect measures, the simple bivariate (Pearson’s) correlations were: ABd and ABi=0.532, p<0.01; SNd and SNi=0.655, p<0.01; PBCd and PBCi=0.293, p<0.01. Construct validity was established since all of the direct and indirect measures for each of the constructs were correlated.
Reliability
Internal consistency reliability for the direct measures was tested. Reliability estimates based on Cronbach’s alpha for BI, ABd, SNd, and PBCd were 0.855, 0.938, 0.768, and 0.593, respectively. This was used to help determine whether the items in the scale are measuring the same construct (Francis et al., 2004). When acceptable internal consistency reliability was not met, the item was deleted from the overall variable score and any analyses. The items that were removed were SNd3, PBCd3, and PBCd4.
35
This form of reliability is not considered to be ideal for indirect measures because someone may have positive or negative views of different salient beliefs within the same construct. Francis et al. (2004) recommended a test-retest for indirect measures.
However, due to the anonymity of the study, this did not allow for completion of a test-retest with the indirect measures, since the same participants cannot be contacted again. As an alternative, reliability analysis was conducted with the indirect variables using Cronbach’s alpha. Reliability estimates based on Cronbach’s alpha for ABi, SNi, and PBCi were 0.812, 0.751, and 0.781. For all three indirect measures, satisfactory
Cronbach’s alpha values were obtained. This alternative method was used successfully by Lee, Cerreto, and Lee (2010). Unfortunately, this reliability measure for the indirect measures only provides weak evidence for reliability, which may limit the study’s conclusions.
Prior test-retest reliability by Haney, Czerniak, and Lumpe (1996), which is the most similar research to the present study, indicated strong correlations between the two testings, thus providing evidence for stability reliability. They similarly tested internal consistency using Cronbach’s alpha analysis and found the three direct constructs to range from 0.64 to 0.88.
Procedure
Questionnaires were emailed to 1023 Iowa science teachers and an unknown number of NSTA list server members. Participants in this study were asked to complete the Qualtrics survey online. Following the data collection, responses were analyzed.
36
Data Analysis
Prior to statistical analyses, the construct scores were calculated. The construct scores were used to determine if the participant held positive, negative, or neutral beliefs about implementing NGSS. Each individual salient belief score (behavioral belief X outcome evaluation, normative belief X motivation to comply, and control belief X control power) was also calculated. Frequencies and descriptive statistics were run and analyzed for distributional characteristics of each individual item, each salient belief, and each construct score.
Simple bivariate (Pearson’s) correlations were run between each of the direct constructs and their corresponding indirect construct. Direct measures and indirect measures are expected to be positively correlated (Francis et al., 2004). Performing these correlations confirmed the validity of the indirect measures and were reported in the validity section in this chapter. Correlations were also performed between BI and each of the direct constructs as well as BI and each of the indirect constructs (BI-ABd; BI-SNd; BI-PBCd; BI-ABi; BI-SNi; BI-PBCi). This provided the relative importance of each of the direct and indirect constructs in relation to behavioral intention as well as the predictive validity of theory of planned behavior (Ajzen, 1985; Ajzen, 1991).
Estimation of Cronbach’s alpha was performed on each of the direct and indirect constructs with a goal of alpha ≥0.6 for each construct (Francis et al., 2004). Items from the direct variables were removed if, when deleted, the Cronbach’s alpha increased. The items that were deleted were SNd3, PBCd3 and PBCd4. All other items remained in the direct constructs for all further statistical analyses. Results from this are reported under the reliability section in this chapter.
37
A confirmatory factor analysis was conducted to ensure that the items
appropriately matched with each of the constructs of the theory of planned behavior. With this method, it is specified how many factors there are and which variables load onto each factor in order to confirm the measurement model (Remler & Van Ryzin, 2015). In order to perform the confirmatory factor analysis, SAS (version 9.4) was used.
Multiple regression analysis was used in this study. The statistical assumptions for multiple linear regression are 1) there is a linear relationship between the dependent variable and the independent variables collectively and individually, 2) the distribution of the dependent variable is normal, 3) the distribution of the dependent variable has
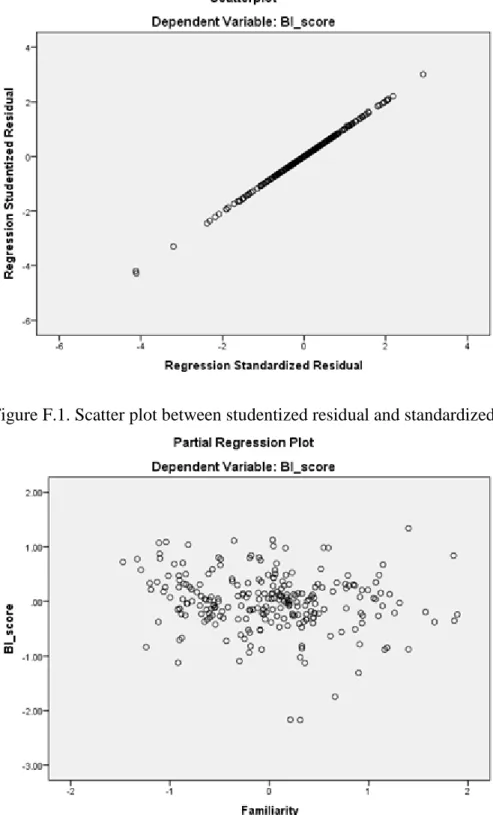
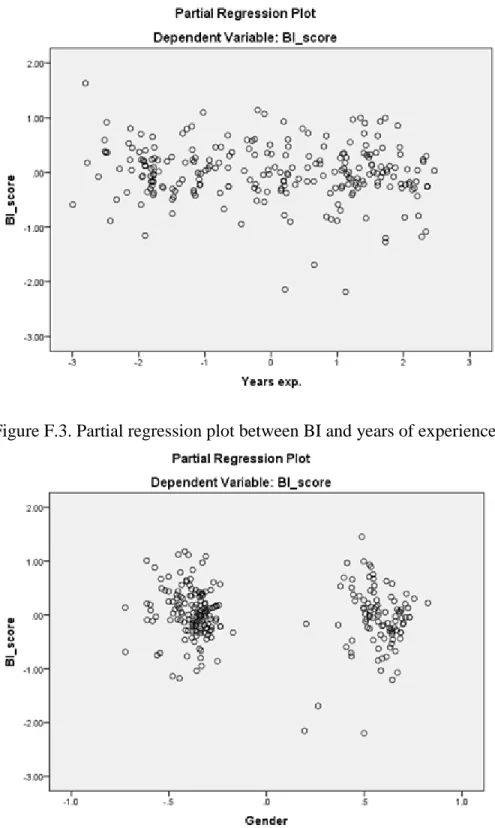
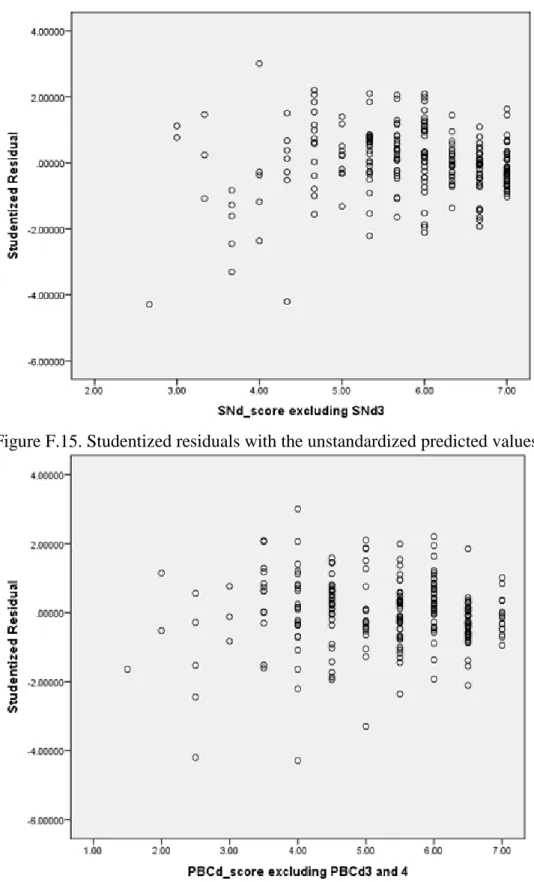
constant standard deviation throughout the range of values of the independent variables (homoscedasticity), and 4) the sample is randomly selected (Agresti & Finlay, 2009). The diagnostics examined to assess the extent to which the assumptions appear to have been met are 1) visualizing scatter plots and partial regression plots to check for linearity, 2) check a histogram of the studentized residuals, a Normal P-P Plot, and a Normal Q-Q Plot, 3) plot the studentized residuals against the unstandardized predicted values, and 4) the sample was randomly selected. Each of the assumptions were met and the plots can be seen in Appendix F. The criterion for significance was set at alpha=0.05.
In order to answer research question 3, backward elimination multiple linear regression was used with BI as the dependent variable and ABd, SNd, PBCd, and
demographics (gender, years of experience, familiarity with NGSS, location, and grading system) were entered as the predictor variables. Individual predictor variables were deleted from the model if they did not contribute significantly (p<0.1). A final model