Herestraat 49 B-3000 Leuven Tel. : +32-16-34.70.73 Fax : +32-16-34.70.31 email : jan.verhaegen@uz.kuleuven.ac.be Route de Lennik 808 B-1070 Brussels Tel. : +32-2-555.45.19 Fax : +32-2-555.31.10 email : marc.struelens@ulb.ac.be Juliette Wytsmanstraat 14 B -1050 BRUSSELS Tel.: +32-2-642.50.38 Fax: +32-2-642.54.10 email : erik.hendrickx@iph.fgov.be http: //www.iph.fgov.be
European Antimicrobial Resistance Surveillance System
Pilot phase report
Antibiotic resistance of invasive community acquired
Streptococcus pneumoniae
and
Staphylococcus aureus
strains, Belgium (1998-1999)
Katholieke Universiteit van Leuven, Microbiology Unit, U.Z. Gasthuisberg Verhaegen J, Van de Ven J, Verbiest N, Van Eldere J.
Université Libre de Bruxelles, Laboratory of Microbiology, Hôpital Erasme Denis O, Deplano A, Nonhoff C, De Ryck R, Struelens M. J. Scientific Institute of Public Health, Epidemiology Unit
Hendrickx E, Ronveaux O, Van Loock F. UNIVERSITAIRE
ZIEKENHUIZEN LEUVEN
Herestraat 49 B-3000 Leuven Tel. : +32-16-34.70.73 Fax : +32-16-34.70.31 email : jan.verhaegen@uz.kuleuven.ac.be Route de Lennik 808 B-1070 Brussels Tel. : +32-2-555.45.19 Fax : +32-2-555.31.10 email : marc.struelens@ulb.ac.be Juliette Wytsmanstraat 14 B -1050 BRUSSELS Tel.: +32-2-642.50.38 Fax: +32-2-642.54.10 email : erik.hendrickx@iph.fgov.be http: //www.iph.fgov.be
European Antimicrobial Resistance Surveillance System
Pilot phase report
Antibiotic resistance of invasive
Streptococcus pneumoniae
and
Staphylococcus aureus
strains
Belgium (1998-1999)
Katholieke Universiteit van Leuven, Microbiology Unit, U.Z. Gasthuisberg Verhaegen J, Van de Ven J, Verbiest N, Van Eldere J.
Université Libre de Bruxelles, Laboratory of Microbiology, Hôpital Erasme Denis O, Deplano A, Nonhoff C, De Ryck R, Struelens M. J. Scientific Institute of Public Health, Epidemiology Unit
Hendrickx E, Ronveaux O, Van Loock F. UNIVERSITAIRE
ZIEKENHUIZEN LEUVEN
De Ryck R, Denis O, Deplano A, Hendrickx E, Nonhoff C, Ronveaux O, StruelensM. J, Van de Ven J, Van Eldere J, Van Loock F., Verbiest N, Verhaegen J.
European Antimicrobial Resistance Surveillance System. Pilot phase report. Antibiotic resistance of invasive Streptococcus pneumoniae and Staphylococcus aureus strains. Belgium (1998-1999).
Microbiology Unit, U.Z. Gasthuisberg, Katholieke Universiteit van Leuven; Laboratory of Microbiology, Hôpital Erasme, Université Libre de Bruxelles; Epidemiology Unit, Scientific Institute of Public Health, 2000; Leuven, Brussels (Belgium)
Scientific Institute of Public Health, IPH/EPI REPORTS N° 2000 – Depotnumber: D|2000|2505|31
European Antimicrobial Resistance Surveillance System.
Pilot phase report.
Antibiotic resistance of invasive
Streptococcus pneumoniae
and
Staphylococcus aureus
strains.
Belgium (1998-1999)
Katholieke Universiteit van Leuven Microbiology Unit, U.Z. Gasthuisberg Herestraat 49 B-3000 Leuven Belgium ( +32-16-34.70.73 Fax : +32-16-34.70.31 email : jan.verhaegen@uz.kuleuven.ac.be Université Libre de Bruxelles
Laboratory of Microbiology, Hôpital Erasme Route de Lennik 808 B-1070 Brussels ( +32-2-555.45.19 Fax : +32-2-555.31.10 email : marc.struelens@ulb.ac.be Scientific Institute of Public Health Unit of Epidemiology Juliette Wytsmanstraat 14 B -1050 BRUSSELS ( +32-2-642.50.38 Fax: +32-2-642.54.10 email : erik.hendrickx@iph.fgov.be
Katholieke Universiteit van Leuven Microbiology Unit U.Z. Gasthuisberg Université Libre de Bruxelles Laboratory of Microbiology, Hôpital Erasme, Scientific Institute of Public Health Epidemiology Unit
European Antimicrobial Resistance Surveillance System
Pilot phase report
Antibiotic resistance of invasive
Streptococcus pneumoniae
and
Staphylococcus aureus
strains
Belgium (1998-1999)
October 2000
UNIVERSITAIRE ZIEKENHUIZEN LEUVEN
This study was performed by the Microbiology Unit of the U.Z. Gasthuisberg (Katholieke Universiteit van Leuven), the Laboratory of Microbiology of the Hôpital Erasme (Université Libre de Bruxelles) and the Unit of Epidemiology of the Scientific Institute of Public Health.
Study design and microbiological protocols
This investigation forms part of the “European Antimicrobial Resistance Surveillance System – pilot phase, 1 October 1998 – 31 December 1999” (EARSS). EARSS aims to be an international network of national surveillance systems with the objective to aggregate comparable and reliable antimicrobial resistance data for public health purposes in Europe. Standardisation and quality control protocols were developed under the umbrella of the European Society of Clinical Microbiology and Infectious Diseases (ESCMID). The network is co-ordinated at the European level by the EARSS management team of the National Institute of Public Health and the Environment of the Netherlands.
The Microbiology Unit of the U.Z. Gasthuisberg (Katholieke Universiteit van Leuven), the Laboratory of Microbiology of the Hôpital Erasme (Université Libre de Bruxelles) and the Unit of Epidemiology of the Scientific Institute of Public Health were the institutions responsible for the project in Belgium under the coordination of Prof. Dr. H. Goossens and Dr. F. Van Loock (adjustment of the EARSS study protocol, specialised laboratory testing and coordination at the national and the international level).
Data collection
Data collection was performed by the participating hospital laboratories and by the reference laboratories.
Authors of the report (in alphabetic order)
De Ryck R. Denis O. Deplano A. Hendrickx E. Nonhoff C. Ronveaux O. Van de Ven J Van Eldere J Van Loock F. Verbiest N Verhaegen J.
I.
Introduction
... 6
II.
Surveillance of antimicrobial resistance in
S. pneumoniae
strains isolated from
blood and cerebrospinal fluid
... 6
II.1 The retrospective survey...6
II.1.1 Participation ... 6
II.1.2 S. pneumoniae testing procedures ... 6
II.1.3 Epidemiological data, 1997 ... 7
II.2 Prospective strain collection...7
II.2.1 Inclusion criteria en participation ... 7
II.2.2 Incidence... 8
II.2.3 Susceptibility to antimicrobials and capsular groups ...10
II.3 Conclusions...14
II.4 References...14
III
Surveillance of antimicrobial resistance in
S. aureus
strains isolated from
blood
... 15
III.1 Introduction...15
III.2 Retrospective survey...15
III.2.1 Material and methods...15
III.2.2 Results ...16
III.2.2.1 Participation ...16
III.2.2.2 MRSA prevalence reported in 1997 ...16
III.2.2.3 S. aureus antimicrobial susceptibility testing methods in 1998...18
III.3 Microbiological survey of S. aureus isolated from blood culture, 1999...19
III.3.1 Material and methods...19
III.3.2 Results ...20
III.3.2.1 Participation ...20
III.3.2.2 Identification and oxacillin susceptibility...21
III.3.2.3 Vancomycin susceptibility of MRSA isolates ...21
III.3.2.4 MIC determination of 16 antimicrobials for MRSA blood isolates, 1999...22
III.3.2.5 PFGE typing of MRSA strains...25
III.3.2.6 Correlation between MRSA genomic PFGE type and antimicrobial susceptibility ...27
III.3.3 Conclusions...29
III.3.3.1 Retrospective survey ...29
III.3.3.2 Microbiological survey ...29
III.4 Acknowledgements...30
I. Introduction
The pilot phase of EARSS consisted of 3 components: a retrospective survey of the number of
S. pneumoniae and S. aureus isolates obtained in 1997 from blood and cerebrospinal fluid (S. pneumoniae only in case of the latter) in the Belgian laboratories, a survey of the techniques commonly used by the Belgian laboratories to identify these 2 germs as well as their antimicrobial resistance patterns and a prospective collection of community acquired S. pneumoniae and S. aureus strains isolated from blood and cerebrospinal fluid during the year 1999. These strains were sent to the S. pneumoniae and the S. aureus reference laboratory for further testing.
II. Surveillance of antimicrobial resistance in
S. pneumoniae
strains isolated
from blood and cerebrospinal fluid
In 1998, the European Antimicrobial Resistance Surveillance System (EARSS) established a protocol to collect resistance data from 12 European member states, including Belgium. One of two EARSS surveyed topics was the penicillin-resistance in Streptococcus pneumoniae
invasive (blood and cerebrospinal fluid) isolates.
This report gives the results for Belgium of the two separate studies that contributed to the S. pneumoniae component of the EARSS project. The first is a retrospective survey on detection and testing methods of S. pneumoniae, together with the number of reported strains in 1997, and the other study gives the results of the prospective collection of cerebrospinal fluid (CSF) and blood S. pneumoniae (SP) strains during 1999. All SP strains were sent to the reference laboratory (KUL Leuven), where resistance testing was provided. Detailed susceptibility testing methods can be found in reference1. The data collection is supposed to be exhaustive for laboratories that participated.
II.1 The retrospective survey
II.1.1Participation
All Belgian laboratories were contacted to participate in the EARSS project and 86 of them provided information concerning their detection and testing methods.
The questionnaire also requested information about the population catchment area of the laboratories in order to calculate incidences precisely. However, this information is not available in Belgium. As an alternative, social security data on test requests could be used, but these data are not readily available neither.
II.1.2 S. pneumoniae testing procedures
The results of SP testing procedures are given in Table 1, showing that a high proportion of laboratories used the optochin testing procedure.
Table 1 Testing procedures to identify S. pneumoniae strains Method Nr. of hospitals (%) Optochin 80 (93) Bile solubility Tube Other 16 (19) 7 (8) 9 (10) API-strep 25 (29) Other method 31 (36)
Other methods most frequently reported included the pneumo-slide kit (n=17) and latex agglutination (n=7).
Seventy-one percent of the respondents declared performing further testing on penicillin non-susceptible S. pneumoniae strains.
II.1.3 Epidemiological data, 1997
Not all laboratories were able to report both the number of SP isolates and the number of penicillin resistant SP (PRSP) isolates (Table 2) Moreover, some laboratories did provide figures for invasive isolates only.
Table 2 Number of S. pneumoniae isolates, retrospective EARSS survey, 1997 Nr. of Hospitals sending information Nr. of isolates Median Nr. of isolates per hospital Range Nr. of isolates per hospital S. pneumoniae total 65 7426 89 2-507 S. pneumoniae in blood and CSF 74 844 9 0-48 PRSP in blood and CSF 71 63 0 0-15
The median proportion of invasive SP on the total SP (all isolation sites) detected per hospital was 10.7%. The mean pooled figure was 10.2% (754/7426).
II.2 Prospective strain collection
II.2.1Inclusion criteria en participation
The criterion of the EARSS project to include a S. pneumoniae strain is that it has been isolated at the occasion of a community-acquired deep infection and subsequently confirmed by an optochin test. Duplicate isolates were to be excluded. It has to be observed, however, that the reporting system in Belgium does not allow to specify where the infection was acquired (community or hospital).
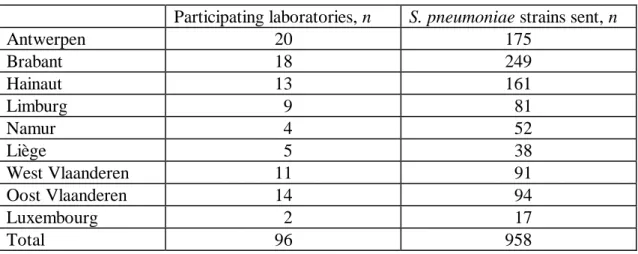
In 1999, 958 isolates were sent by a total of 96 laboratories. The strains included blood isolates (n=892, 93.1%) and CSF isolates (n=66, 6.9%). The number of reported strains per laboratory
varied from 1 to 50 strains (median 8). The 9 Belgian provinces contributed in various proportions (Table 3).
Table 3 Invasive SP strains and number of reporting laboratories per province, Belgium 1999
Participating laboratories, n S. pneumoniae strains sent, n
Antwerpen 20 175 Brabant 18 249 Hainaut 13 161 Limburg 9 81 Namur 4 52 Liège 5 38 West Vlaanderen 11 91 Oost Vlaanderen 14 94 Luxembourg 2 17 Total 96 958
On average the number of collected strains was 80 per month, with a clear increase during the winter season (figure 1), typical for the SP seasonality. There was no significant difference in the proportion of oxacillin-resistant strains according to the month of isolation (p= 0.82). II.2.2 Incidence
Provided that all samples were sent to the reference laboratory, the annual incidence of pneumococcal bacteraemia for Belgium can be calculated at 8.9/100,000 and the annual incidence of pneumococcal meningitis at 0.66/100,000. However, these are probably minimal estimations given the unknown catchment area of the participating laboratories.
Nevertheless, this Belgian estimation agrees well with the results of other national surveillance systems in Europe: 6.7/100,000 and 0.44/100,000 for bacteraemia respectively meningitis for England and Wales between 1993 and 19952. Between 1991 and 1998, invasive pneumococcal disease incidence ranged from 8.3 to 14.8/100,000 per year in the Netherlands3. And in Finland, rates of 8.2/100,000 and 0.9/100,000 for bacteraemia and meningitis among adults from 1983 to 19924 were observed.
The age distribution of patients with invasive SP infection shows a high number of cases in lower age groups (<5 y.) then smaller numbers among young adults and again high numbers above 60 years (Table 4).
The sex ratio (male to female) was 1.19:1 but varied according the age, isolates from female patients being more frequent between 10 and 39 years and then again when over 80.
The incidence of invasive S. pneumoniae infections by age and sex shows a U shaped curve with high incidences in infancy and in the elderly and with higher figures for males (Figure 2).
Figure 1. Number of invasive S. pneumoniae per month and susceptibility to oxacillin, Belgium 1999
Table 4 Invasive S. pneumoniae (SP) infections, by age group and sex, Belgium 1999 SP strains, n
Age group (years) Male Female Total1 (% of total)
<1 40 32 75 (7.6) 1-4 47 44 92 (9.6) 5-9 16 8 24 (2.5) 10-29 19 26 45 (4.7) 30-49 67 67 134 (14.1) 50-59 50 31 81 (8.5) 60-69 85 54 141 (14.7) 70-79 122 76 200 (20.9) 80 and more 63 90 153 (16.1) Unk. 6 5 11 (1.2) Total 515 433 956 (100)
1 including those with sex unknown
The reported case fatality ratio (CFR) was 5.1%, and was higher among patients with S. pneumoniae detected in CSF (7.6%) than in blood (4.9%). However, the information about the outcome was missing in 34.3% of the reports. There was no statistical difference in the CFR of patients with penicillin-susceptible (5.1%) or resistant (4.4%) strains.
0 20 40 60 80 100 120 140
JAN FEB MAR APR MAY JUN JUL AUG SEP OCT NOV DEC Month
N Strains
Susceptible Resistant
Figure 2. Incidence of invasive S. pneumoniae by age and sex, Belgium 1999
II.2.3 Susceptibility to antimicrobials and capsular groups
The oxacillin disk test showed 819 (85.8%) strains susceptible and 136 (14.2%) with a reduced susceptibility. Among these, MIC penicillin by E-test (AB Biodisk, Solna, Sweden) distinguished between 92 (9.6% of total) with an intermediary susceptibility (0.06< MIC = 1 mg/L) and 44 (4.6%) resistant (>1 mg/L).
Figure 3 shows the distribution of the MIC penicillin values for the oxacillin non-susceptible strains. Only 5 strains showed a MIC for penicillin > 2 mg/L. Figures 4 and 5 show the distributions of the MICs for cefotaxime and ciprofloxacin for these same strains (according the EARSS protocol cefotaxime and ciprofloxacin MICs were not determined for the oxacillin susceptible strains). There was one cefotaxime resistant strain and 31.2% (n=43) of the oxacillin non-susceptible strains were intermediately resistant (>0.5 - =1 mg/L). Ten of the oxacillin non-susceptible strains had a MIC for ciprofloxacin > 1 mg/L, and 3 of them were highly resistant.
Oxacillin resistance in strains isolated from the bloodstream was slightly higher than in those isolated from the CSF: 10.0% intermediate and 4.7% fully resistant for 4.5% and 3.0% respectively (p= 0.27).
The 958 strains belonged to 31 serogroups (Figure 6). The 7 most common groups were 1 (9.2%), 3 (7.0%), 6 (10.8%), 9 (10%), 14 (13.4%), 19 (9.4%), 23 (7.2%), and they accounted for 67% of the cases. Penicillin resistance was most encountered among groups 6 (13.6%), 9 (21.9%), 14 (46.1%), 19 (19.1%) and 23 (24.6%) (Figure 6). Figure 7 shows the distribution of serogroups by susceptibility to erythromycin. Resistance to erythromycin was mainly found among the same serogroups: 6 (59.2% of strains were resistant to erythromycin), 14 (76.6%) and 19 (59.6%). 0 10 20 30 40 50 60 70 80 0 1 to 4 5 to 9 10 to 29 30 to 49 50 to 59 60 to 69 70 to 79 80 and more age (years) Incidence (/100000) male female
Figure 3. MIC for penicillin of oxacillin non susceptible Streptococcus pneumoniae strains (blood and CSF), Belgium 1999
Figure 4. MIC for ciprofloxacin of oxacillin non susceptible Streptococcus pneumoniae strains (blood and CSF), Belgium, 1999
Among children under 5 (n=167), the main serogroups were 6 (21.6%), 14 (20.4%) and 19 (15.0%). Serogroups proposed in the newly licensed in the USA heptavalent vaccine (4, 6B, 9B, 14, 19F, 18C, 23F) accounted for 82.2% of all serogroups in this agegroup.
0 5 10 15 20 25 30 35 0,094 0,125 0,19 0,25 0,38 0,5 0,75 1 1,5 2 3 MIC Penicillin (mg/l) N strains
source: KUL reference laboratory
n=129 0 5 10 15 20 25 30 35 40 0,094 0,19 0,25 0,38 0,38 0,5 0,75 1 1,5 > 32 MIC Ciprofloxacin (mg/l) N strains
source: KUL reference laboratory
Figure 5. MIC for cefotaxime of oxacillin non susceptible Streptococcus pneumoniae strains (blood and CSF), Belgium 1999
Figure 6. Streptococcus pneumoniae in blood and CSF by serogroup and susceptibility to oxacillin, Belgium 1999 (954 strains)
Table 5 shows the oxacillin resistance proportions by region of laboratory situation in Belgium (n=955 strains). No significant difference by region was observed (chi square test for comparison of proportions p= 0.93). 0 5 10 15 20 25 30 35 40 0,012 0,023 0,032 0,047 0,064 0,094 0,125 0,19 0,25 0,38 0,5 0,75 1 1,5 MIC Cefotaxime (mg/l) N strains
source: KUL reference laboratory
n=136 0 20 40 60 80 100 120 140 1 2 3 4 5 6 7 8 9 10 11 12 13 14 15 16 17 18 19 20 21 22 23 24 27 31 33 34 35 37 38 serogroup N strains oxa-R oxa-S
Figure 7. Streptococcus pneumoniae in blood and CSF by serogroup and susceptibility to erythromycin, Belgium 1999
Table 5 Susceptibility of invasive S. pneumoniae strains to oxacillin, by region, Belgium 1999
Oxacillin susceptibility
Brussels (n=249) Wallonia (n=266) Flanders (n=440) Proportion of strains (%)
Susceptible 85.1 86.1 85.9
Intermediary 10.8 9.4 9.1
Resistant 4.0 4.5 5.0
For erythromycin and tetracycline, significantly higher resistance figures were reported in Wallonia than in other regions (Table 6).
Table 6 Susceptibility of invasive S. pneumoniae strains to tetracycline and
erythromycin, all strains and strains resistant to oxacillin, by region, Belgium 1999
Brussels Wallonia Flanders Total p1
Antibiotic tested Proportion in % (n tested) of strains resistant Erythromycin All strains 31.3 (249) 43.6 (266) 24.1 (440) 31.4 (955) <0.001 Oxa-R strains 67.6 (37) 86.5 (37) 54.8 (62) 66.9 (136) 0.005 Tetracycline All strains 29.7 (249) 34.1 (266) 20.1 (440) 26.5 (955) <0.001 Oxa-R strains 64.9 (37) 76.3 (37) 45.3 (62) 59.0 (136) 0.006 1
: chi square test for comparison of proportions
Among all strains, only six (0.6%) were resistant to ofloxacin. 0 20 40 60 80 100 120 140 1 2 3 4 5 6 7 8 9 10 11 12 13 14 15 16 17 19 19 20 21 22 23 24 27 31 33 34 35 37 Serogroup N strains ERY-R ERY-S
Table 7 gives the evolution of resistance to oxacillin, tetracycline and erythromycin since 1996. Here, data from all strains reported to the reference laboratory, including isolates from middle ear aspirates and other normally sterile sites (pleura, peritonitis, arthritis… ) are presented. For the 3 antibiotics, the trends show a continuous increase.
Table 7 Evolution of S. pneumoniae resistance to oxacillin, tetracycline and erythromycin in Belgium, 1996 to 1999, all reported strains.
Proportion (%) of strains resistant to Oxacillin Tetracycline Erythromycin
1996 (n=1289) 9.5 18.4 25.9
1997 (n=1241) 10.0 23.2 28.6
1998 (n=1205) 14.2 28.0 31.0
1999 (n=1221) 17.4 29.6 35.0
II.3Conclusions
The Belgian participation to the S. pneumoniae surveillance component of the EARSS project fits entirely in the national surveillance performed by the reference laboratory. A large participation ensuring a good representativity together with standardized methods provide results giving a valid idea of the situation in Belgium. Although these show that resistance of S. pneumoniae continues to increase, with resistance levels intermediate in the European context, the majority of PRSP strains are intermediately resistant, and only one strain resistant to third-generation cephalosporins was reported in 1999. Regional differences need to be further investigated.
II.4 References
1. Verhaegen J,Van de Ven J, Verbiest N, Van Eldere J, Verbist L. Evolution of Streptococcus pneumoniae serotypes and antibiotic resistance in Belgium - update (1994-1998). Clin Microbiol Infect 2000, 6, 308-15
2. Laurichesse H, Grimaud O, Waight P, Johnson AP, George RC, Miller E. Pneumococcal bacteremia and meningitis in England and Wales, 1993 to 1995. Comm Dis Pub Health 1998 ; 1 :22-27.
3. De Neeling AJ, van Pelt W, Hol C, Ligtvoet EEJ, Sabbe LJM, Bartelds A, van Embden JDA. Temporary increase in incidence of invasive infection due to Streptococcus pneumoniae in the Netherlands. Clin Infect Dis 1999 ; 29 :1579-80.
4. Sankilampi U, Herva E, Haikala R, Liimatainen O, Renkonen OV, Leinonen M. Epidemiology of invasive Streptococcus pneumoniae infections in adults in Finland. Epidemiol Infect 1997 ; 118 :7-15.
III Surveillance of antimicrobial resistance in
S. aureus
strains isolated
from blood
III.1 Introduction
In 1999, the European Antimicrobial Surveillance System has been piloted to establish a common antibiotic susceptibility testing protocol of Staphylococcus aureus and Streptococcus pneumoniae and to aggregate antimicrobial resistance data from 12 European Member States. For this study, Belgian hospital laboratories were invited to participate to a survey of S. aureus
bloodstream infections among hospitalized patients. The main objectives of this survey were:
a. To analyze retrospectively epidemiological data about S. aureus bacteremia in Belgian hospitals
b. To update the description of antimicrobial susceptibility testing methods used for S. aureus
c. To determine the current proportion of MRSA among S. aureus bacteremia in hospitalized patients
d. To determine the frequency of decreased susceptibility to vancomycin of MRSA strains, if any
e. To determine the molecular epidemiology and antimicrobial susceptibility of MRSA blood isolates in 1999
III.2 Retrospective survey
III.2.1 Material and methods
A questionnaire in two parts about epidemiological data and susceptibility testing methods for
S. aureus used was sent to all Belgian hospitals in 1998.
- Epidemiological data comprised demographic (number of admission, number of beds, average annual bed occupancy) and microbiological (number of blood culture, number of S. aureus blood isolates, incidence of MRSA, incidence of MRSA blood isolates) data in 1997.
- Susceptibility testing methods for S. aureus included procedures used for testing oxacillin and vancomycin by screening plate, disk diffusion, MIC (E-test, automated, … ) in Belgian laboratories in 1998.
III.2.2 Results
III.2.2.1 Participation
The participation to the retrospective questionnaire was low. 35 (18%) hospitals have answered (Table 8 and Table 9).
Table 8 : Distribution of the participating laboratories by region Region (Total) No hospitals (% total by category)
Brussels (n = 24) 5 (21)
Flanders (n = 102) 23 (23)
Wallonia (n = 63) 7 (11)
Belgium (n=189) 35 (18)
Table 9 : Distribution of participating laboratories by size
Size (Total) No hospitals of (% total by category)
0 - 199 beds (n = 64) 3 (5)
200 - 299 beds (n = 59) 16 (27)
300 – 499 beds (n = 41) 9 (22)
≥ 500 beds (n = 25) 7 (28)
III.2.2.2 MRSA prevalence reported in 1997
Sixty-one hospitals (Table 10) provided the 1997 figures including the number of S. aureus
blood cultures (total and methicillin resistant) and 56 of them (Table 11) reported the total number of cultures from blood. The figure 8 shows a broad range of methicillin resistance with high proportions found in some hospitals of all bed size categories.
Table 10 : Resistance proportion and incidence of MRSA in hospitals by hospital size, 1997
No.of beds All hospitals
0-199 200-299 300-499 500 and + (Median)[range] No Hospitals 11 21 17 12 61 No. MRSA 8 52 75 164 299 (2) [0-51] No. S. aureus 95 323 443 597 1458 (17) [0-124] Methicillin resistance proportion (%) Average (pooled) 8.4 16.1 16.9 27.5 20.5 Median of the hospitals 8.3 14.3 19.0 20.0 16.3 [0-50] Range 0-50 0-41 0-50 9-50 No. admissions 63,200 175,751 209,389 262,546 710,886 MRSA incidence (10,000 admissions) 1.2 3.0 3.6 6.2 4.2
Table 11 : Proportion of S. aureus blood cultures on total blood cultures by hospital size, 1997
No. of beds Total
0-199 200-299 300-499 500 and + No Hospitals 11 21 14 10 56 No. S. aureus 95 323 370 541 1329 No Blood cultures 8550 23037 31417 53231 122235 Proportion S. aureus /total 1.11 1.11 1.18 1.02 1.09
Figure 8. Proportion of methicillin resistance in blood cultures in Belgian hospitals, by hospital size category, EARSS survey 1997
III.2.2.3 S. aureus antimicrobial susceptibility testing methods in 1998
Thirty-five laboratories located in Brussels (n = 5), Flanders (n = 23) and Wallonia (n = 7) responded to the questionnaire. For oxacillin susceptibility testing, 71% of laboratories used the disk diffusion method, 56% oxacillin screen agar and 21% an automated system (Table 12). Of the laboratories performing the disk diffusion, only 6 (24%) strictly followed the NCCLS recommendations. The use of combination of methods for oxacillin susceptibility was reported by 18% of laboratories. For vancomycin susceptibility testing, 76% used the disk diffusion method (Table 13). 18% used automated systems and 6% vancomycin screen agar.
Table 12 : S. aureus oxacillin susceptibility testing methods reported by Belgian labs
Methods No labs (%)
Disk diffusion 25 (71)*
Oxacillin agar screen 19(56)£
Automated system 7 (21)
Combination of methods 16 (46)&
* 6 laboratories performed disk diffusion analysis according to the NCCLS recommendations
£ no data available for oxacillin agar screen testing conditions
& 12 labs used disk diffusion and oxacillin agar screen, 3 labs used automated system and disk diffusion and one lab used three methods
0 1 2 3 4 5 6 7 0% 1-9% 10-19% 20-39% 40% and more Resistance proportion No of hospitals 0-199 beds 200-299 beds 300-499 beds
Table 13 : S. aureus vancomycin susceptibility testing methods reported by Belgian labs Methods
No labs (%)
Disk diffusion 26 (76)
Vancomycin screen agar 2 (6)
Automated system 6 (18)
Combination of methods 1 (3)$
$
One lab used disk diffusion and vancomycin screen agar
III.3 Microbiological survey of S. aureusisolated from blood culture, 1999
III.3.1 Material and methods
1. S. aureus isolates (n=689) collected from January to December 1999 from bloodstream infections among hospitalized patients (n = 59 hospitals)
2. Identification of S. aureus by coagulase test with human plasma 3. Detection of methicillin resistance with oxacillin screen agar method11
4. Confirmation of identification and methicillin resistance by multiplex PCR for mecA and
nuc genes2
5. Search for strains with decreased susceptibility to glycopeptide by testing MRSA with vancomycin screen agar method (BHI agar supplemented with 6 µg/ml vancomycin, BBL) and by MICs determination with two E-test methods (AB Biodisk) on BHI agar (inoculum 2 McF, incubation 48h) and on MH agar (inoculum 0.5 McF, incubation 24h)1;15
Confirmation of decreased susceptibility to glycopeptide with population analysis using a 2 McF inoculum on BHI agar supplemented with 4 µg/ml vancomycin9
6. MRSA Minimal inhibitory concentration (MIC) were determined for 16 antimicrobials (oxacillin, gentamicin, amikacin, tobramycin, netilmicin, erythromycin, clindamycin, cotrimoxazole, ciprofloxacin, minocycline, rifampin, fusidic-acid, linezolid, mupirocin, vancomycin, teicoplanin) by agar dilution method according to the NCCLS recommendations12. NCCLs breakpoints were used except for mupirocin , fusidic acid and linezolid. Fusidic acid breakpoints were interpreted according to the criteria of the Committee for Antimicrobial Testing of the French Society of Microbiology (CASFM)3. Mupirocin resistant strains were classified into two categories: low level resistance (MIC = 8 – 256 µg/ml) and high-level resistance (MIC > 256 µg/ml). Linezolid breakpoints were interpreted according to the manufacturer recommendations.
7. The mupA gene encoding high-level resistance to mupirocin was detected by PCR for strains with MIC of mupirocin > 256 µg/ml13
8. Macrorestriction (SmaI) and pulsed-field gel electrophoresis (PFGE) analysis were performed as previously described5. Computer-assisted analysis of SmaI profiles was
performed using the BioNumerics software (Applied-Maths, Kortrijk, Belgium) as described6. The dendrogram was constructed using Dice similarity coefficients of SmaI PFGE patterns and the Unweighted Pair Group Method using Average (UPGMA) clustering method.
To enhance comparability with other European reference MRSA typing laboratories of the EU supported HARMONY network ,PFGE patterns were classified according to a new system.
1. Group includes PFGE profiles showing ≤ 7 DNA fragment difference equivalent to ≥ 67% of genomic similarity16. These groups are designated by a capital letter (e.g. A). Each group includes one or more PFGE types and subtypes.
2. Type includes PFGE profiles showing ≤ 3 DNA fragment difference equivalent to ≥ 80% genomic similarity14. Types are designated by the group letter followed by a roman numeral suffix (e.g. A1).
3. Subtype includes any variant PFGE profile within a type. Each subtype is designated by lower case letter suffix (e.g. A1a).
A type was considered epidemic if strains of the same type were recovered from patients in 2 or more hospitals within the same year.
III.3.2 Results
III.3.2.1 Participation
From January to December 1999, 59 hospitals from Brussels (n = 7), Flanders (n = 39) and Wallonia (n = 13) have sent 689 strains (range = 1 to 104, median = 6) from blood cultures to the National Reference Laboratory (Table 14). The participation was more important in large and medium size hospitals than in small institutions (Table 15). Moreover, there was an under-representation of Walloon hospitals.
Table 14 : Distribution of the participating laboratories by region
Region (Total) No hospitals (% total by category)
Brussels (n = 24) 7 (29) Flanders (n = 102) 39 (38) Wallonia (n = 63) 13 (21) Belgium (n=189) 58 (31)
Table 15 : Distribution of participating laboratories by size
Size (Total) No hospitals of (% total by category)
0 - 199 beds (n = 64) 8 (13)
200 - 299 beds (n = 59) 20 (34)
300 – 499 beds (n = 41) 18 (44)
≥ 500 beds (n = 25) 12 (48)
III.3.2.2 Identification and oxacillin susceptibility
Among the 689 strains collected in 1999, 7 (1%) did not grow and 27 (4%) were identified as coagulase negative staphylococci. Six hundred fifty-one (95%) strains were confirmed as S. aureus by PCR. Four isolates, which had a positive coagulase test but no nuc gene, were identified as S. aureus by inter t-RNA PCR. Further characterization of their nuc gene sequence is in progress.
One hundred seventy-four strains (27%) were identified as MRSA by PCR. No borderline oxacillin resistant S. aureus (BORSA) have been detected. Three isolates did not grow on oxacillin screen agar but possessed mecA gene (MIC to oxacillin = 8–16 µg/ml). The sensitivity and specificity for MRSA identification in Belgian laboratories were 93% and 98%, respectively, in comparison with PCR for mecAgene detection.
The participation was limited during the first six months. Therefore, data of each semester were analyzed separately. During the first semester, 36 laboratories sent 199 isolates among which 194 were confirmed as S. aureus. Sixty-seven (35%) were identified as MRSA by both phenotypic and genotypic tests. Among the 490 strains collected from 53 laboratories during the last semester 1999, 457 were confirmed as S. aureus. One hundred and seven (23%) of them were identified as MRSA.
III.3.2.3 Vancomycin susceptibility of MRSA isolates
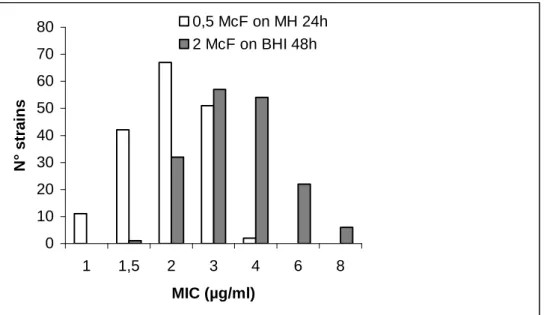
All MRSA isolates have been tested for vancomycin susceptibility. No strain grew on vancomycin screen agar after 24 and 48h incubation. The distribution of MICs by E-test indicates a twofold dilution greater modal MIC by the Bolmström method versus the previous protocol (p < 0.001) (shown in Figure 9). Twenty-eight strains showed intermediate susceptibility level to vancomycin (MIC 6 to 8 µg/ml) using the heavy inoculum E-test procedure on BHI agar but all were susceptible at ≤ 4 µg/ml with standard inoculum on MH agar. Population analysis showed no detectable vancomycin intermediate S. aureus subpopulation (growth ≤ 10-7 at 4 µg/ml vancomycin).
Figure 9. MIC distribution for vancomycin by E-test: comparison of two methods
III.3.2.4 MIC determination of 16 antimicrobials for MRSA blood isolates, 1999
MIC of 16 antimicrobials were determined for 152 MRSA strains by agar dilution (Table 16 and Table 17). Three isolates harboring the mecA gene (2%) were susceptible to oxacillin by agar dilution (MIC 0.5-2 µg/ml). No glycopeptide intermediate strain was detected by the agar dilution method. Since 1997, the frequency of resistance of MRSA strains to gentamicin and to rifampin have decreased significantly (p = 0.01) (Table 16). In contrast, an increase of resistance to macrolides-lincosamides was observed. MRSA strains were > 95% resistant to ciprofloxacin. More than 95% of strains were susceptible to fusidic acid, minocycline and cotrimoxazole. No isolate resistant to linezolid was detected. Three isolates (2%) from different hospitals presented high level resistance to mupirocin (MIC > 1024 µg/ml) confirmed by the presence of mupA gene. Three MRSA strains, isolated from three hospitals, displayed an unusual phenotype of isolated resistance oxacillin and fully susceptibility to other antimicrobials. 0 10 20 30 40 50 60 70 80 1 1,5 2 3 4 6 8 MIC (µg/ml) N° strains 0,5 McF on MH 24h 2 McF on BHI 48h
Table 16 : Categorization of antimicrobial susceptibility results of MRSA isolates, 1999 (n = 152) Antimicrobials Breakpoints R I S % % % Oxacillin 2 – 4 98,0 0 2,0 Vancomycin 4 – 32 0,0 0 100,0 Teicoplanin 8 – 32 0,0 0 100,0 Erythromycin 0.5 – 8 76,3 0 23,7 Clindamycin 0.5 – 4 52,6 0 47,4 Linezolid 8 – 32 0,0 0 100,0 Amikacin 16 – 64 1,3 13,6 85,5 Tobramycin 4 – 16 68,4 0 31,6 Gentamicin 4 – 16 40,8 0 59,2 Netilmicin 8 – 32 2,6 0 97,4 Ciprofloxacin 1 – 4 94,7 0 5,3 Minocyclin 4 – 16 3,3 2,6 94,1 Cotrimoxazole 2 – 4 0,7 0 99,3 Rifampin 1 – 4 9,2 3,9 86,8 Fusidic acid 2 – 32 0 1,3 98,7 Mupirocin 2 – 1024 2,0 13,8 84,2
Table 17 : Cumulative percentage of distribution of MRSA strains (n=152) isolated in blood cultures from Belgian hospitals and median and MIC 90%, 1999 by increasing MIC.
MIC (µg/ml)
Oxa Vanco Teico Erythro Clinda Cipro Genta Amika Netil Tobra Mino Rif SXT Fusi Mupi Line
0.06 0 0 0 1 42 0 1 0 0 4 50 76 52 81 7 0 0.12 0 0 1 7 47 0 24 0 7 22 71 76 81 91 35 0 0.25 0 17 36 22 47 3 55 0 46 30 73 76 96 98 75 3 0.5 1 65 68 24 47 5 58 1 59 30 73 76 99 98 77 15 1 1 97 85 24 47 5 59 13 62 31 76 87 99 99 77 68 2 2 100 99 24 47 5 59 33 70 31 88 91 99 99 78 100 4 2 100 100 24 47 6 59 43 82 32 94 91 99 99 79 100 8 3 100 100 24 47 9 59 64 97 32 97 91 100 99 84 100 16 4 100 100 24 47 29 59 86 100 39 100 91 100 100 97 100 32 9 100 100 24 47 51 62 99 100 54 100 91 100 100 98 100 64 41 100 100 24 48 60 74 99 100 63 100 91 100 100 98 100 128 59 100 100 24 48 63 93 100 100 72 100 92 100 100 98 100 >128 100 100 100 100 100 100 100 100 100 100 100 100 100 100 98 100 >1024 100 MIC 50 128 0.5 0.5 >128 >128 32 0.25 8 0.5 32 0.12 0.06 0.06 0.06 0.25 1 MIC 90 >128 1 2 >128 >128 >128 128 32 8 >128 4 2 0.25 0.12 16 2
III.3.2.5 PFGE typing of MRSA strains
Three widespread groups predominated in 1999: groups A, B and C were found in 19, 21 and 7 Belgian hospitals, respectively ( Figures 10 and 11). These groups were found in previous national MRSA surveys conducted in 1992, 1995 and 1997, under the previous denomination of “clonal groups 1, 2 and 3”7.
Group A was highly polymorphic and included 8 types showing ≥ 67% similarity (Figure 3). MRSA strains of PFGE group A were found in 19 (54%) of participating hospitals in 1999. - Type A1 was widely disseminated in previous surveys of in Belgian Hospitals and is now decreasing in frequency. It was found in 82%, 65%, 44% and 35% of hos pitals in 1992, 1995, 1997 and 1999, respectively. This clonal type is also known as the “Iberian clone” of MRSA.
- Types A19 – A21 clustered in another branch of the group. - Types A16-A18 and A24, each included only 1 to 5 strains.
Group B was more homogeneous than group A. It included the single type B2 comprising patterns with more than 81% similarity. Type B2 appears to be increasing in frequency. In 1999, it was found in 21 (60%) of Belgian hospitals surveyed, as compared with 5%, 15% and 36% of hospitals, in 1992, 1995 and 1997, respectively.
Group C included 3 PFGE types displaying more than 70% similarity.
- Type C3 strains increased in frequency as they were found in 6 (17%) of hospitals in 1999, as compared with 5% and 7% of hospitals in the 1995 an d 1997 surveys, respectively. - Two new types 14 and 25 were first detected in 1999.
Due to the low participation rate of hospitals from Wallonia to the 1999 survey, a detailed analysis of the geographic distribution by region cannot be performed.
Figure 10. Distribution of similarity of genomic PFGE patterns of Belgian MRSA strains, 1999 (n = 117)
% similarity (Dice) PFGE Number of Type strains hospitals
40 60 80 2 2 1 9 7 1 4 1 55 19 2 2 23 1 52 21 E5 F11 C14 C25 C3 I12 G10 A17 A1 A16 A24 A18 A19 A20 A21 H13 H23 D4 D15 D22 B2 E F C I G A H D B
Figure 11. Distribution of MRSA strains into epidemic and sporadic PFGE groups, 1999 (n = 147)
III.3.2.6 Correlation between MRSA genomic PFGE type and antimicrobial susceptibility
Resistance of MRSA strains to antimicrobials in 1999 (Table 9 and Figures 12 and 13) showed an increase in th e proportion of strains susceptible to gentamicin and of those resistant to erythromycin and ciprofloxacin as compared with the 1997 survey (see annual report, 1998)7. This evolution correlated with the increased proportion of group B strains in 1999. All group B strains are gentamicin -susceptible and lack aacA-aphD gene18. In addition, a shift in the gentamicin MIC distribution of group A strains was observed in 1999 (Figure 12). The MIC distribution by PFGE type showed that all group A strains susceptible to gentamicin belonged to the “new” types: A19, A20, A21 and A24. In contrast, all group A strains resistant to gentamicin belonged to the “classic” types: A1, A16, A17 and A18. These data suggest that several types belonging to group A that underwent app arent deletion of aminoglycosides -modifying enzymes AAC(6) -APH(2) and, less commonly, ANT(2), have emerged between 1997 and 1999 in Belgium7.
Thus, it appears that the continuing decrease in the frequency of gentamicin resistance of MRSA strains in Belgium is related to two distinct mechanisms: (i) spread of more recently epidemic gentamicin -susceptible type B2 strains; and (ii) emergence of group A variant types with deletion of aminoglycosides -modifying enzymes genes. Both these phenomena have been recently documented in France and Germany 8;10;19.
As observed previously, group B strains exhibit higher -level resistance to ciprofloxacin as compared with groups A and C (Figure 13). The three MRSA strains showing high level resistance to mupirocin belonged to the epidemic PFGE groups B (n = 2) and C (n = 1). The three strains with isolated oxacillin resistance and susceptibility other than oxacillin each belong to a distinct (sporadic ?) group C, F and I.
Group B 34% Group C 6% Group E 1% Group H 1% Group A 37% Other sporadic groups 21%
Figure 12. Gentamicin and tobramycin MIC distribution of epidemic MRSA strains by PFGE group 0 5 10 15 20 25 30 35 40 0,06 0,12 0,25 0,5 1 2 4 8 16 32 64 128 256 Tobramycin MIC (µg/ml) No of strains PFGE Group A PFGE Group B PFGE Group C 0 5 10 15 20 25 30 0,06 0,12 0,25 0,5 1 2 4 8 16 32 64 128 256 Gentamicin MIC (µg/ml) PFGE group A PFGE Group B PFGE Group C No of strains
Figure 13. Ciprofloxacin MIC distribution of epidemic M RSA strains by PFGE group
III.3.3 Conclusions
III.3.3.1 Retrospective survey
• In this national survey, the participation was lower (31% of Belgian hospitals) than in the prev ious GDEPIH-GOSPIZ MRSA surveillance (46% in 1997)7. Moreover, there was a biased distribution by hospital size (under -representation of smaller institutions) and by region (under -representation of Walloon hospitals)
• In comparison with previous national su rveys (1991-97), oxacillin susceptibility testing methods have improved in Belgian laboratories. Vancomycin susceptibility testing, however, was still performed with disk diffusion method in most laboratories. This technique is not reliable to detect stra ins with intermediate susceptibility to vancomycin which should be screened on vancomycin agar (NCCLS, document M2-A7, 2000).
III.3.3.2 Microbiological survey
• During the second semester 1999, the pooled mean of MRSA among S. aureus in blood isolates was 23% which is higher than the latest pooled mean proportion of MRSA among clinical S. aureus isolates (14%) reported from the
GDEPIH-0
5
10
15
20
25
30
35
40
0,06
0,25
1
4
16
64
256
Ciprofloxacin M IC (µg/ml) P F GE Group A P F GE Group B P F GE Group C No of strainsGOSPIZ-ISP national surveillance (1999). This is likely to reflect a selection bias related to smaller sample of hospitals in the present survey.
• There was no evidence of MRSA isolates with reduced susceptibility to vancomycin from these patients with bloodstream infections. However, glycopeptide-intermediate MRSA strains, teicopla nin intermediate and vancomycin intermediate MRSA, have been reported in Belgium 4;17. Therefore, quantitative glycopeptide susceptibility testing is warranted, particularly in patients with failure of glycopeptide treatment of MRSA infections. E-test on BHI agar with high inoculum cannot be recommended for performing MIC of vancomycin. Strains with apparently reduced vancomycin susceptibility need to be confirmed by population analysis to determine the level of expression of resistance.
• Although the sampl e studied in 1999 markedly differed from previous national MRSA surveys and therefore comparisons should be made with caution, the clonal distribution of MRSA showed diversification of the “old” group A lineage with the emergence of aminoglycoside -susceptible variants types and continuing expansion of gentamicin susceptible group B as well as group C strains
III.4 Acknowledgements
We thank to N. Maes and S. Rottiers for their scientific assistance and technical expertise.
III.5 References
1. Bolmström, A., A. Karlsson and P. Wong. 1999. Marco -method conditions are optimal for detection of low-level glycopeptide resitstance in staphylococci, abstr. P104. 9th European Congress of Clinical Microb iology and Infectious Disease, Berlin, Germany
2. Brakstad, O. G., J. A. Maeland, and Y. Tveten. 1993. Multiplex polymerase chain reaction for detection of genes for Staphylococcus aureus thermonuclease and methicillin resistance and correlation with oxacill in resistance. APMIS 101:681-688.
3. Comité de l’antibiogramme de la Société Française de Microbiologie. 1996. Zone sizes and MIC breakpoints for non -fastidious organisms. Clin. Microbiol. Infect. 2 (suppl 1):S1-S49.
4. Denis, O., C. Nonhoff, S. Bobin -Dubreux, B. Byl, C. Knoop, J. Etienne and M. J. Struelens. 2000. Emergence of methicillin resistant Staphylococcus aureus
(MRSA) with decreased susceptibility to vancomycin in a Belgian hospital. 40 th Interscience Conference on Antimicrobial Agents and Chemotherapy, Toronto, Canada.
5. Deplano, A., W. Witte, W.J. Van Leeuwen, Y. Brun and M. J. Struelens. 2000. Clonal dissemination of epidemic methicillin -resistant Staphylococcus aureus in
6. Deplano, A., A. Schuermans, J. Van Eldere, W. Witte, H. Meugnier, J. Etienne, H. Grundmann, D. Jonas, G.T. Noordhoek, J. Dijkstra, A. Van Belkum, W. Van Leeuwen, P.T. Tassios, N.J. Legakis, A. Van Der Zee, A. Bergmans, D.S. Blanc, F.C. Tenover, B.C. Cookson, G. O'Neil, M.J. Struelens and the European Study Group on Epidemiological Markers of the ESCMID. 2000. Multicenter evaluation of epiemiological typing of methicillin -ressitant Staphylococcus aureus strains by repetitive-element PCR analysis. J. Clin. Microbiol. 38:3 527-3533.
7. De Ryck, R., A. Deplano, C. Nonhoff, B., Jans, C. Suetens and M.J. Struelens. 1999. Molecular Epidemiology and antimicrobial susceptibility of methicillin -resistant Staphylococcus aureus (MRSA) in Belgian hospitals: 1992 -97, abstr. P123. 9th European Congress of Clinical Microbiology and Infectious Disease, Berlin, Germany.
8. Galdbart, J.O., Morvan, A. and N. El Solh. 2000. Phenotypic and molecular typing of nosocomial methicillin -resistant Staphylococcus aureus strains susceptible to gentamicin is olated in France from 1995 to 1997. J. Clin. Microbiol. 38:185-190. 9. Hiramatsu, K., N. Aritaka, H. Hanaki, S. Kawasaki, Y. Hosoda, S. Hori, Y.
Fukuchi, and I. Kobayashi. 1997. Dissemination in Japanese hospitals of strains of
Staphylococcus aureus heterogeneously resistant to vancomycin. Lancet 350 :1670-1673.
10. Lelievre, H., G. Lina, M. E. Jones, C. Olive, F. Forey, M. Roussel -Delvallez, M. H. Nicolas-Chanoine, C. M. Bebear, V. Jarlier, A. Andremont, F. Vandenesch, and J. Etienne. 1999. Emergence and spread i n French hospitals of methicillin -resistant
Staphylococcus aureus with increasing susceptibility to gentamicin and other antibiotics. J.Clin.Microbiol. 37:3452 -3457.
11. National Committee for Clinical Laboratory Standards. 1999. Methods for dilution antimicro bial susceptibility tests for bacteria that grow aerobically. M100 -S9. National Committee for Clinical Laboratory Standards, Wayne, Pa
12. National Committee for Clinical Laboratory Standards. 2000. Methods for dilution antimicrobial susceptibility tests for b acteria that grow aerobically. M100 -S10/M7. National Committee for Clinical Laboratory Standards, Wayne, Pa
13. Ramsey, M. A., S. F. Bradley, C. A. Kauffman, and T. M. Morton. 1996. Identification of chromosomal location of mupA gene, encoding low-level mupirocin resistance in staphylococcal isolates. Antimicrob.Agents Chemother. 40:2820-2823.
14. Struelens, M. J., A. Deplano, C. Godard, N. Maes, and E. Serruys. 1992. Epidemiologic typing and delineation of genetic relatedness of methicillin -resistant
Staphylococcus aureus by macrorestriction analysis of genomic DNA by using pulsed-field gel electrophoresis. J.Clin.Microbiol. 30:2599 -2605.
15. Tenover, F. C., M. V. Lancaster, B. C. Hill, C. D. Steward, S. A. Stocker, G. A. Hancock, C. M. O'Hara, S. K. McAllister, N. C. Clark, and K. Hiramatsu. 1998.
Characterization of staphylococci with reduced susceptibilities to vancomycin and other glycopeptides. J.Clin.Microbiol. 36:1020 -1027.
16. Tenover, F. C., R. D. Arbeit, R. V. Goering, P. A. Mickelsen, B. E. Murray, D. H. Persing, and B. Swaminathan. 1995. Interpreting chromosomal DNA restriction patterns produced by pulsed-field gel electrophoresis: criteria for bacterial strain typing. J.Clin.Microbiol. 33:2233 -2239.
17. Van Eldere, J., A. Hoefnagels -Schuermans, W.E. Peetermans, S. V an Lierde and C. Verwaest. 1997. Nosocomial transmission of a methicillin -resistant
Staphylococcus aureus with reduced susceptibility to teicoplanin, abstr. J -122. 37th Interscience Conference on Antimicrobial Agents and Chemotherapy, Toronto, Canada.
18. Wildemauwe, C., C. Godard, R. Vanhoof, E. V. Bossuyt, and E. Hannecart-Pokorni. 1996. Changes in major populations of methicillin -resistant
Staphylococcus aureus in Belgium. J.Hosp.Infect. 34:197 -203.
19. Witte, W., C. Braulke, D. Heuck and C. Cuny. 2000. Methici llin resistant
Staphylococcus aureus in German hospitals develop narrower patterns of antimicrobial resistance. Eurosurveillance 5:31 -34.