The Feasibility of Credit Using C4.5 Algorithm
Based on Particle Swarm Optimization Prediction
Siswanto
Teknik Informatika Fakultas Teknologi Informatika
Universitas Budi Luhur Jakarta, Indonesia [email protected] Nia Kusuma Wardhani Faculty of Computer Science
Universitas Mercu Buana Jakarta, Indonesia [email protected]
Abdussomad
Postgraduate of Computer Science STMIK Nusa Mandiri
Jakarta, Indonesia [email protected]
Grace Gata
Sistem Informasi Fakultas Teknologi Informatika
Universitas Budi Luhur Jakarta, Indonesia [email protected]
Windu Gata
Postgraduate of Computer Science STMIK Nusa Mandiri
Jakarta, Indonesia [email protected]
Basuki Hari Prasetyo Teknik Informatika Fakultas Teknologi
Informatika Universitas Budi Luhur
Jakarta, Indonesia [email protected] Abstract—Credit is a belief that one is given to a person or
other entity which is concerned in the future that will fulfill all the obligations previously agreed. The objective of the research is to do credit analysis to determine the feasibility of a credit crunch, through credit analysis results, to investigate whether the customer is feasible or not. The method used to predict credit worthiness is by using two models, i.e. C4.5 classification algorithm model and Particle Swarm Optimization (PSO)-based C4.5 classification algorithm model . After testing with these two models, it is found that the C4.5 classification algorithm generates a value of 90.99% accuracy and AUC value of 0.911 to the level diagnostics Classification Excellent, but after the optimization with C4.5 classification algorithm based on Particle Swarm Optimization accuracy values amounted to 91.18% and the AUC value of 0.913 to the level of diagnosis Excellent Classification. These both methods have different accuracy level of 0.18%.
Keywords—Credit analysis, C4.5 Algorithm, Particle Swarm Optimization
I. INTRODUCTION
Credit analysis is important in the scope of financial risks [1][2], As a benchmark that the debtor is approved or rejected, the debtor can use historical data that has been approved by the company. However, it should be noted also that the debtors that has been approved is not everything including good credit payers category, meaning there are several debts who have been approved but a few months later payment arrears.
Based on reports of leasing in Karawang, shows the level of customer problems in 2015 showed 60% Loan Bad compared with customers who have a Good Credit status that indicates the number of 40%.
To solve the above problems, in this study using a model C4.5 decision tree algorithm to establish credit worthiness classification model. PSO algorithm will be used to select, attributes that are used and provide root weight calculation becomes simpler to establish a reliable model to determine the pattern of prospective customers who will doing credit and determine the credit worthiness of the that customer.
II. RELATEDWORKS
There are some research and credit analysis techniques performed by researchers such as creating models to predict customer problems and not problems in the payment of the loan using the model and C4.5 Decision Tree Algorithm and Simulated Annealing [3].
Applying the C4.5 classification algorithm for determining the credit worthiness of cooperatives [3]. Conduct research to compare several algorithms such as Linear Regression, Neural Networks, Support Vector Machine, Case Base Reasoning, Rule Based Fuzzy Neural Network and Decision Tree [4][5]. All models of the above algorithms used to analyze the loan approval in the form of credit. The result showed that the Decision Tree proven to have the highest accuracy in the decision-making than other algorithms.
One of the optimization algorithm is quite popular is the Particle Swarm Optimization (PSO). PSO algorithm is inspired from the group dynamic and can work together and be organized from computer simulations of the movement coordinates [6]. When applied in a classification algorithm, PSO is able to improve the accuracy of better than Genetic Algorithm.
III. LITERATURESURVEY A. Data Mining
Data Mining (DM) is the core of the process of Knowledge Discovery in Databases, which involves an algorithm in exploring the data, develop models and discover previously unknown patterns [7][8].
B. C4.5 Classification Algorithm
C4.5 algorithm or decision tree similar to a tree where there is an internal node (not the leaves) that describe attributes-attribute, each branch represents the result of the attributes being tested, and each leaf describes the class. Decision trees can easily be converted into classification rules.
In the testing process attributes, the new branch is formed will be noted from the types of attributes [9]. There are three types of branches that may arise in the decision tree, namely:
1. If the attribute value-discrete, then the branch that is formed will always be equal to the amount of variation values contained in these attributes.
2. If a branch is worth a continuous, then it will be solved according to the split point, while the breaking point is calculated by each constituent decision tree algorithm. Branch divisions formed should be patterned like ≤
attributes, and another branches > attributes
3. If the binary valued attributes that were tested, the branch formed definitely two and involves a yes or no.
Stages in making a decision tree algorithm C4.5 that is [9]:
1. Prepare the training data, the data can be retrieved from history that never happened before and is already classified in a particular class.
2. Determine the root of a tree by counting the highest gain value of each attribute or based on the value of the lowest entropy index. Previously calculated first index value of entropy, according to the formula (1):
m
Entropy(i) = -∑ f(i,j).log2 f[(i,j)] ...(1)
j=1 Description:
i = set case
m = number of partitions i f (i, j) = the proportion of j to i
3. Calculate the gain value by the following formula (2):
p
Entropy(i) = -
∑
ni . iE(i) ...(2)i=1n Description:
p = number of partitions attributes ni ni = proportion of the i n = number of cases in the n
4. Repeat step 2 until all the records partitioned.
As for the partition process in the decision tree will stop if:
a. All tables on record in the node m got the same class. b. Nothing in the record attributes are partitioned again. c. There is no record in the branch is empty.
C. Particle Swarm Optimization (PSO)
PSO algorithm was first proposed by Kennedy and Earhart in 1995. Particle swarm optimization (PSO) algorithm is a kind of intelligence that comes from the behavior of flocks of birds foraging [10]. Particle swarm optimization (PSO) is an evolutionary computation technique which is able to produce globally optimal solution in the search space through the interaction of individuals in a swarm of particles. In general PSO has the characteristic that the concept is simple, easy implementation, efficient computing. PSO is a population-based methods such as GA (Genetic Algorithm), but the basic concept of PSO is cooperation instead of competition.
PSO using evolutionary computation techniques [11]:
1) PSO initialized with a set of random solutions.
2) PSO search for an optimum solution by renewing generation.
3) Population growth based on the previous generation.
To find the optimal solution, then each particle will move towards the best position before (p best) and global best position (g best). For example, particles of all I expressed as : xi = (xi,1, xi,2 ... x-i, d) in-space and
dimensions. The best position of particle kei previously stored and expressed as p best i = (p best i, 1, p best i, 2, ... p best i, d).
Cross Validation is a validation techniques to randomly divide the data into k parts and each part will do the classification process [12].
By using cross validation will experiment as much as k. Each experiment will use one data testing and k-1 section will be the training data, then the data of testing that will be exchanged with a single training data so that for each trial will be testing data obtained Different. Training data is the data that will be used to perform testing of learning to while data is data that has not been used as a learning and will serve as the test data correctness or accuracy of the learning outcomes [11].
ROC curve (Receiver Operating Characteristic) is another way to evaluate the accuracy of visual classification [9].
This level of accuracy can be diagnosed as follows [12]: Accuracy 0.90 – 1.00 = Excellent classification
Accuracy 0.80 – 0.90 = Good classification Accuracy 0.70 – 0.80 = Fair classification Accuracy 0.60 – 0.70 = Poor classification Accuracy 0.50 – 0.60 = Failure
From previous studies it can be concluded that the decision tree has the highest level of accuracy in the processing of credit data. Then the PSO algorithm will be used as a screening attributes to improve the accuracy of the classification is done.
IV. RESEARCHMETHODOLOGY
A. Research Type
The two main approaches in the research are qualitative and quantitative approaches. Qualitative research methods relate to subjective judgments of attitudes, opinions, and behaviors. In general, the techniques used are interviews in certain groups and in-depth interviews. While the quantitative research method is used to examine on a particular sample, data collection using research instruments, data analysis is quantitative / statistical with the aim to test the hypothesis that has been determined.
B. Research Method
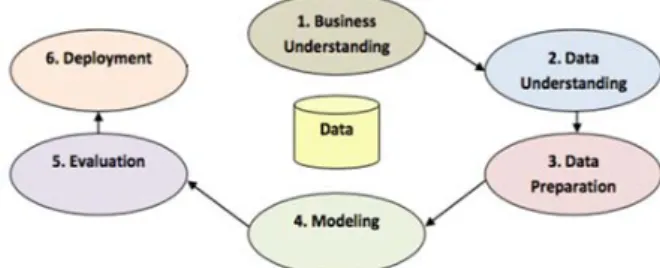
For Data Mining research, there has been a standard methodology called CRISP-DM or Cross-Industry Standard Process for Data Mining as Fig 1.
Research method used in this research is by using experiment method. This study aims to generate pattern of the feasibility of credit. In designing this experimental research method the researcher uses the standard research method used in data mining that is Cross-Industry Standard Process for Data Mining (CRISP-DM) that consists of six phases with the steps are Business Understanding, Data Understanding, Data Preparation, Modeling, Evaluation and Deployment.
1) Business Understanding
The first stage of CRIPS-DM is Business Understanding. At this stage of business understanding can be referred to the research stage of understanding, defining the purpose of research projects in the formulation of defining the problem of data mining. Under the conditions of customer credit period of December 2015, indicating the status of bad loans with a higher percentage level of customer status condition smoothly.
Higher customer data in question shows a lack of accurate analysis in determining the feasibility of the provision of credit for consumers. C4.5 algorithms classification techniques are widely used in credit analysis with the goal of more accurate analysis. In this research, the development of the C4.5 classification algorithm based on PSO (Particle Swarm Optimization) with the aim of increasing the accuracy of the calculation algorithm C4.5 classification.
2) Data Understanding Stage
At this stage of Understanding Data, data collection, Data were obtained from a leasing in the city of Karawang in the period December 2015, amount of data that is used as much as 1044 records, with 8 attibute Predictors namely Status, Employment, Income, Object, Dp_Net, Otr, Tenor, installment, and attributes condition as a class or label. The above data shows the 620 number customer data problems (Bad) and 424 customer data is not problematic (Fluent), analysis of data investigation (credit data) to identify further data and prior knowledge search then evaluate the quality of the data.
3) Data Preparation Stage
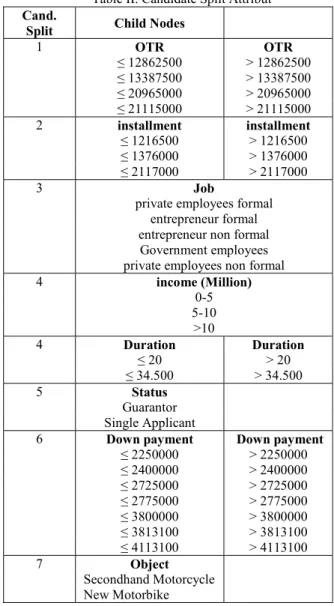
Then do the reprocessing techniques using RapidMiner resulting candidate split as in Table II.
4) Modeling Stage
At this stage of data processing training which will produce some rules and will form a decision tree. The model that will be used is twofold classification algorithm C4.5 and C4.5 classification algorithm based on Particle Swarm Optimization (PSO).
5) Evaluation Stage
In the evaluation phase, called the classification stage because at this stage will be determined to an accuracy of testing. The test phase is to see the results on the accuracy of the classification algorithm C4.5 and C4.5 classification algorithm based on Particle Swarm Optimization and evaluation by ROC Curve.
6) Deployment Stage
At the stage of deployment, the application of the model do C4.5 classification algorithm based on Particle Swarm Optimization to determine credit worthiness.
Table II. Candidate Split Attribut Cand.
Split Child Nodes
1 OTR OTR ≤ 12862500 > 12862500 ≤ 13387500 > 13387500 ≤ 20965000 > 20965000 ≤ 21115000 > 21115000 2 installment installment ≤ 1216500 > 1216500 ≤ 1376000 > 1376000 ≤ 2117000 > 2117000 3 Job
private employees formal entrepreneur formal entrepreneur non formal Government employees private employees non formal
4 income (Million) 0-5 5-10 >10 4 Duration Duration ≤ 20 > 20 ≤ 34.500 > 34.500 5 Status Guarantor Single Applicant
6 Down payment Down payment ≤ 2250000 > 2250000 ≤ 2400000 > 2400000 ≤ 2725000 > 2725000 ≤ 2775000 > 2775000 ≤ 3800000 > 3800000 ≤ 3813100 > 3813100 ≤ 4113100 > 4113100 7 Object Secondhand Motorcycle New Motorbike V. EXPERIMENTALRESULTS A. Testing Results of C4.5 Algorithm
At this stage of data processing training which will produce some rules and will form a decision tree
The following steps C4.5 classification algorithm model is done:
1) Counting the number of cases with the condition Bad Good conditions as well as the entropy of all cases:
= 0,9744
2) Then calculate the value of Entropy and the gain on each attribute, as the following example calculate the entropy and gain values for attributes OTR.
Number of records OTR ≤ 12,862,500 consists of 92 Good and 500 Bad, whereas OTR > 12,862,500
consists of 332 Good and 120 Bad. Then the entropy can be calculated as below (3):
m
Entropy(i) = -∑ f(i,j).log2 f[(i,j)] ...(3)
j=1
Calculation results of Entropy and Gain can be seen in Table III.
Table III. Information Gain of C4.5 Algorithm
NODE ENTROPY GAIN
Number of Cases 0,9744
Candidate Split ENTROPY GAIN
OTR ≤ 12862500 0,6232 0,259560324 > 12862500 0,8349 > 13387500 0,8425 0,208610141 ≤ 13387500 0,7162 ≤ 20965000 0,9678 0,00275032 > 20965000 0,9996 > 21115000 0,9863 0,009039814 ≤ 21115000 0,9629 Installment > 1216500 0,8951 0,002187399 ≤ 1216500 0,9784 > 1376000 0,9457 0,000368713 ≤ 1376000 0,9760 > 2117000 0,8113 0,004089345 ≤ 2117000 0,9722 Job
private employees formal 0,9772
0,015889231 entrepreneur formal 0,9403
entrepreneur non formal 0,9703 Government employees 0,0000
private employees non
formal 0,8610 Income 0-5 0,9710 0,0045211124 5-10 0,9703 10 - ... 0,9403 Duration > 20 0,9919 0,010395086 ≤ 20 0,9073 > 34,500 0,5933 0,062442456 ≤ 34,500 0,9985 Status Guarantor 0,8405 0,082424478 Single Applicant 0,9673 Down Payment ≤ 2250000 0,8869 0,004432489 > 2250000 0,9816 ≤ 2400000 0,7518 0,024391324 > 2400000 0,9916 ≤ 2725000 0,8352 0,028792892 > 2725000 0,9978 ≤ 2775000 0,8229 0,037323171 > 2775000 0,9995 ≤ 3800000 0,9675 0,001020909 > 3800000 0,9879 ≤ 3813100 0,9675 0,001020909 > 3813100 0,9879 ≤ 4113100 0,9598 0,005163587 > 4113100 0,9989 Object Secondhand motorcycle 0,6448 0,2438092657 New Motorbike 0,8448
Base on Table III shows the attributes of OTR with split ≤ 12862500 and split > 12862500 has the highest gain value 0.259560324, so the attributes OTR will be the main roots of the model. Perform calculations entropy and gain up to the last root formation.
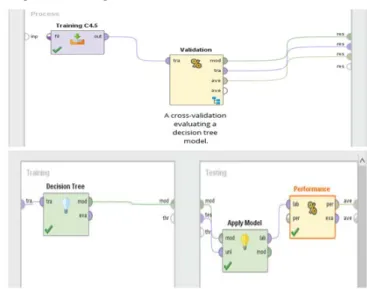
The test results with K-Fold Cross Validation C4.5 Algorithm as Fig 4.
Fig 4. The Test K-Fold Cross Validation C4.5 Algorithm
Accuracy value calculation is done by using application RapidMiner. The results of a test using the C4.5 algorithm shown in Table IV.
Results of model testing has been done to measure the level of accuracy and AUC (Area Under the Curve).
1) Confusion Matrix
Number of True Positive (TP) is 332 record classified as Good and False Negative (FN) from 2 record classified as Good but Bad. Next 618 records for True Negative (TN) classified as Bad, and 92 record False Positive (FP) are classified as Bad turns Good
Table IV. Conversion Confusion Matrix Classification C4.5 Algorithm
accuracy: 90.99% +/- 2.54% (micro: 91.00%)
true Good true Bad class precision pred. Good 332 2 99.40%
pred. Bad 92 618 87.04% class recall 78.30% 99.68%
Based on Table IV shows that, the level of accuracy by using an C4.5 algorithm amounted to 90.99%, and can be calculated to find the value of accuracy, sensitivity, specificity, ppv, and the NPV at the following equation:
Conclusions The results of the calculation of the above equation is shown in Table V.
Table V. Results of the calculation C4.5 algorithm
Value (%) Accuracy 90,99 Sensitivity 99,40 Specitivity 87,04 PPV 78,30 NPV 99,68 2) ROC Curve
In the Fig 5 shows ROC graph with the value AUC (Area Under the Curve) of 0.911 at the level diagnostics Classification Excellent.
Fig 5. AUC values in ROC graph C4.5 algorithm
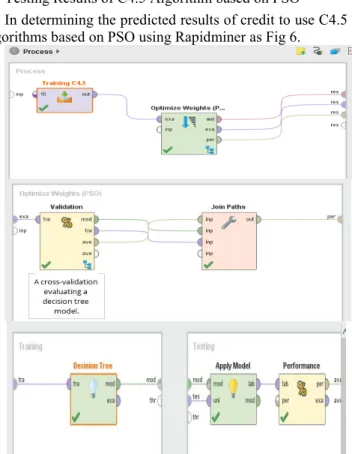
B. Testing Results of C4.5 Algorithm based on PSO In determining the predicted results of credit to use C4.5 algorithms based on PSO using Rapidminer as Fig 6.
Fig 6. Testing of K-Fold Cross Validation C4.5 Algorithm Based PSO
The results of tests using the C4.5 algorithm based on PSO are shown in Table VI.
Results of model testing that has been done is to measure the level of accuracy and AUC (Area Under the Curve).
1) Confusion Matrix
Number of True Positive (TP) is 332 record classified as Good and False Negative (FN) from 0 record classified as Good but Bad. Next 620 records for True Negative (TN) classified as Bad, and 92 record False Positive (FP) are classified as Bad turns Good.
Table VI. Conversion Confusion Matrix Classification C4.5 Algorithm Based On PSO
accuracy: 91.18% +/- 2.90% (micro: 91.19%)
true Good true Bad class precision pred. Good 332 0 100.00% pred. Bad 92 620 87.08% class recall 78.30% 100 %
Based on Table VI shows that, the level of accuracy by using an C4.5 algorithm amounted to 90.18%, and can be calculated to find the value of accuracy, sensitivity, specificity, ppv, and the npv at the following equation:
Conclusions The results of the calculation of the above equation is shown in Table VII.
Table VII. Results of calculations C4.5 algorithm based on PSO Value (%) Accuracy 91,18 Sensitivity 100 Specitivity 87,08 PPV 78,30 NPV 100 2) ROC Curve
In the Fig 7 shows ROC graph with the value AUC (Area Under the Curve) of 0.913 at the level diagnostics Classification Excellent.
Fig 7. AUC values in ROC graph C4.5 algorithm based on PSO
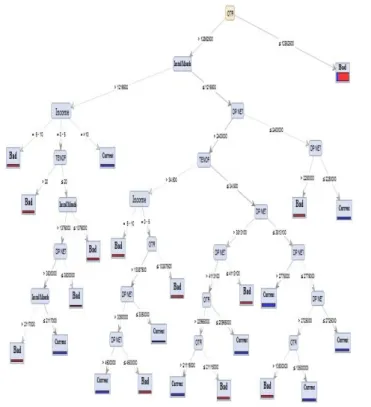
Results of decision tree C4.5 classification algorithm based on PSO testing K-Folds cross Validation are as Fig 8.
Fig 8. The results of Decision Tree C4.5 algorithm based on PSO
C. Evaluation and Validation Analysis Model
From the results of the above evaluation, either confusion matrix and ROC curve showed that the C4.5 classification algorithm based on Particle Swarm Optimization has a value higher accuracy compared to just using the C4.5 classification algorithm. Accuracy value for C4.5 classification algorithm model amounted to 90.99% and the accuracy of C4.5 classification algorithm based on PSO (Particle Swarm Optimization) amounted to 91.18% with an accuracy of 0.19% difference can be seen in Table VIII.
Tabel VIII. Tests C4.5 classification and C4.5 classification algorithm based on PSO
Accuracy AUC
C4.5 90,99% 0,911
C4.5 based on PSO 91,18% 0,913
Based on table VIII can be analyzed that, C4.5 algorithms based PSO has the distinction of a very good value because it has a probability of <0.05 are 0.018 against the C4.5 algorithm. It concluded that the C4.5 algorithm based on PSO has better value accurate in predicting the credit worthiness with the highest value of 91.18% accuracy and has a high AUC value test is 0.913 (Excellent Classification).
VI. CONCLUSION
From the analysis of the C4.5 algorithm in optimization with particle swarm optimization (PSO) can be concluded that the value of accuracy obtained C4.5 algorithm model based PSO is 91.18%. Better than by simply using the C4.5 algorithm model, that produces a value of 90.99% accuracy. The results obtained from the difference between both models is of 0.18%.
As for the evaluation using ROC curve for both models has a difference of 0.002 with the details of the model algorithm C4.5 generating AUC value of 0.911 to the level diagnostics Classification Excellent and C4.5 algorithm model based PSO produce AUC value of 0.913 to the level diagnostics Classification Excellent. It concluded that the application of particle swarm optimization techniques can improve the accuracy of the algorithm C4.5.
REFERENCES
[1] Yu, L., Lai, K. K. & Wang, S., “Credit Risk Assessment with Least Squares Fuzzy Support Vector Machine”, in proceedings of IEEE International Conference on Data Mining Workshops (ICDMW'06), December, 2006, pp. 823-827.
[2] Lai, Kin Keung, Lean Yu, Ligang Zhou and Shouyang Wang., “Credit Risk Evaluation with Least Square Support Vector Machine”. G. Wang et al. (Eds.): RSKT 2006, LNAI 4062, pp. 490–495, 2006. Springer-Verlag Berlin Heidelberg,2006
[3] Jiang, Yi., “Credit Scoring Model Based on the Decision Tree and the Simulated Annealing Algorithm”, 978-0-7695-3507-4/08 $25.00 © 2008 IEEE. DOI 10.1109/CSIE.2009, pp. 481.
[4] Zurada, Josef, “Could Decision Trees Improve the Classification Accuracy and Interpretability of Loan Granting Decisions?”, in Proceedings of the 43rd Hawaii International Conference on System Sciences -2010. 978-0-7695-3869-3/10 $26.00 © 2010 IEEE, 2010. [5] Zurada, J., and Kunene, N., "Performance Assessment of Data
Mining Methods for Loan Granting Decisions: A Preliminary Study", Artificial Intelligence and Soft Computing -The Proceedings of the 10th International Conference on Artificial Intelligence and Soft Computing(ICAISC 2010), (L. Rutkowski, R.Scherer, R. Tadeusiewicz, L.A., Zadeh,,J.M. Zurada, Eds), Part I, pp. 495-502, Lecture Notes in Artificial Intelligence. Berlin: Springer, 2010. [6] Sousa, Tiago, Silva, Arlindo and Neves, Ana, “Particle Swarm based
Data Mining Algorithms for Classification Tasks, in Parallel Computing 30 (2004),18 May 2004, pp.767-783, Available at: http://citeseerx.ist.psu.edu/viewdoc/download?doi=10.1.1.294.8575& rep=rep1&type=pdf, [ Accessed 04 January 2019 ].
[7] Maimon, Oded & Lior Rokach. “Data Mining and Knowledge Discovery Handbook”. New York: Springer, 2010
[8] Aggarwal, Charu C., “Data Mining”. New York: Springer, 2015. [9] Han, J., Kamber, M & Jian Pei. “Data Mining: Concepts and
Techniques”, (Third Edition ed.), San Francisco: Elsevier Inc., 2012. [10] Yun Ling, Qiu-yan Cao, & Hua Zhang. (2011). “Application of the
PSO-SVM model for Credit Scoring’, In Seventh International Conference on Computational Intelligence and Security. DOI 10.1109/CIS.2011.19
[11] Brown, Meta S., “Data Mining for Dummies a Wiley Brand”. Hoboken: John Wiley & Sons, Inc., 2014.
[12] Witten, H. I., Frank, E., & Hall, M. A., “Data Mining Pratical Mechine Learning Tools And Technique”, Burlington: Elsevier Inc., 2011.