Molecular phylogeny of Parnassiinae butterfl ies (Lepidoptera:
Papilionidae) based on the sequences of four mitochondrial
DNA segments
Abstract. A molecular phylogeny of Parnassiinae (Lepidoptera: Papilionidae) was generated by combining the partial sequences of three mitochondrial genes (LSU, ND1 and CO1; 1639 aligned sites) with a somewhat enlarged version of the ND5 mitochondrial dataset of Omoto et al. (2004). A total of 125 individuals were sampled (109 Parnassiinae, 14 Papilioninae, two outgroups) with the emphasis being put on genus Parnassius (94 specimens, most of them from natural history collections). Our phylogenetic reconstructions differ in particular from recently published ones in that (i) Baronia brevicornis Salvin 1893, an isolated taxon from Mexico, which had generally been placed in a subfamily of its own, is suggested to belong to Parnassiini, together with Hypermnestra
and Parnassius; (ii) the earliest split within Parnassius is shown to be between subgenus Parnasssius
(the ‘apollo’ group, whose caterpillars feed on Crassulaceae, exceptionally Saxifragaceae) and the ancestor of the remaining seven subgenera whose existence is confi rmed by molecular phylogenies: six of them have Fumariaceae as larval foodplant, while Kreizbergia uses Scrophulariaceae. Within
Parnassius, a number of systematic rearrangements at the species level are proposed, in particular within subgenera Parnassius and Koramius (28 and 23 taxa sampled, respectively), by reanalyzing available biological information in the light of our mitochondrial phylogenies. Finally, implications of this work for the biogeography of Parnassiini and shifts in larval host plant use are briefl y discussed, the evolution of other adaptive traits in Parnassiinae being the subject of a separate paper.
Résumé. Phylogénie moléculaire des Parnassiinae (Lepidoptera : Papilionidae) basée sur les séquences de quatre segments d’ADN mitochondrial. Nous avons généré une phylogénie moléculaire des Parnassiinae et, plus spécifi quement, du genre Parnassius en combinant les séquences partielles de trois gènes mitochondriaux ((LSU, ND1 and CO1; 1639 sites alignés au total) avec une version quelque peu élargie du tableau de séquences mitochondriales ND5 publié par Omoto et al. (2004). Notre échantillon comprend un total de 125 individus (109 Parnassiinae, 14 Papilioninae, deux membres d’autres familles), parmi lesquels 94 spécimens, provenant pour la plupart de collections d’histoire naturelle, appartiennent au genre Parnassius. Nos reconstructions phylogénétiques diffèrent en particulier de celles récemment publiées par d’autres en ce que (i) nous suggérons que Baronia brevicornis Salvin 1893, une espèce mexicaine qui est généralement présentée comme le seul représentant vivant d’une sous-famille distincte, pourrait appartenir en fait aux Parnassiini, à côté de Hypermnestra et Parnassius; (ii) il est démontré que la division la plus ancienne du genre Parnassius a séparé le sous-genre Parnassius (le groupe de P. apollo L. 1758, dont les chenilles utilisent des Crassulaceae, exceptionnellement des Saxifragaceae) des autres lignées. De fait, des sept autres sous-genres dont l’existence est confi rmée par la phylogénie moléculaire, six utilisent des Fumariaceae comme plantes-hôtes larvaires, tandis que Kreizbergia se nourrit de Scrophulariaceae. A l’intérieur du genre Parnassius, de nombreux réarrangements sont proposés aux niveaux spécifi que et infraspécifi que après réexamen des informations biologiques disponibles à la lumière de nos phylogénies mitochondriales : c’est en particulier le cas dans les sous-genres
Parnassius et Koramius, dont nous avons analysé respectivement 28 et 23 individus. Enfi n, les implications de ce travail pour la biogéographie des Parnassiini et les changements de plante-hôte sont brièvement discutées, l’évolution des autres caractères adaptatifs des Parnassiinae devant faire l’objet d’une publication séparée.
Keywords: Parnassiinae systematics, molecular evolution, foodplant choice, DNA barcoding, museum DNA.
François Michel (1), Cécile Rebourg (2), Emmanuel Cosson (3) & Henri Descimon (4)
(1) Centre de Génétique Moléculaire du C.N.R.S, 1 Avenue de la Terrasse, F-91190 Gif-sur-Yvette, France (2) 62 rue Rochon, F-69270 Couzon-au-Mont d’Or, France (3) Groupe Chiroptères de Provence, rue Villeneuve, F-04230 Saint-Etienne-les-Orgues, France (4) 2 rue Rougemont, F-13012 Marseille, France
E-mail: michel@cgm.cnrs-gif.fr, cecile.rebourg@free.fr, emmanuel. cosson@gcprovence.org, descimon.henri@free.fr
A
mong the four currently recognized families of butterfl ies, Papilionidae have elicited the largest number of “modern” biological and molecular studies (see e.g. Scriber et al. 1995). Parts of this family have undergone a spectacular adaptive radiation, in particular the genus Papilio (subfamily Papilioninae): several molecular phylogenies of Papilio, which sampled a reasonably representative fraction of its over 200 species worldwide, have already been published (Aubert et al. 1999; Caterino et al. 1999; Zakharov et al. 2004). Th e subject of the present work is another subfamily of the Papilionidae, the Parnassiinae, several lineages of which provide a lesser, albeit still spectacular example of bursts of speciation.Th e distribution area of Parnassiinae is restricted to the Holarctis, with a centre of gravity in Asia and a few outliers in North America and Europe. Within that range, members of the Parnassiinae occupy a variety of temperate (rarely subtropical), Mediterranean, subdesertic and mountain biomes, including some extreme habitats. For instance, one species, Parnassius hunnyngtoni Avinoff 1916, has been claimed to reach the elevation of 6000 m in the Himalayas (Weiss 1992). Th e morphological and physiological adaptations that enabled Parnassiinae to colonize such an impressive diversity of environments during their extended
evolutionary history have rightly fascinated a fair number of entomologists. However, far larger troops of them were drawn to these butterfl ies primarily by the extraordinary aesthetic appeal of many of the species when in the adult stage. Th is has generated a huge nomenclatural infl ation, especially at the subspecies scale, with many taxa only recognizable by their own author. In contrast, studies dealing with the evolutionary processes that gave rise to this adaptive radiation are relatively few, compared to those devoted to some less attractive groups. Moreover, the evolutionary relationships of the major subdivisions of the Parnassiinae have remained controversial, so that a fi rm basis to build evolutionary scenarios is lacking.
About two-thirds of currently recognized species in Parnassiinae belong to genus Parnassius, which is the type of the subfamily and was described in 1804 by the French entomologist Latreille, founder of the Société entomologique de France, to whose memory we dedicate this work. Counting some 45 species, Parnassius was divided into several genera by various authors, but is still regarded as a single genus (here designated as Parnassius s.l.) in such recent works as Nazari et al. (2007), Weiss (1991–2005) and Turlin and Manil (2005). Th us, according to a classical and conservative perspective (Tab. 1), the Parnassiinae Table 1. A list of genera and subgenera commonly included in the Parnassiinae. Numbers of species are indicated between
brackets.
Genus subgenus type species
Hypermnestra Ménétriès1846 (1 species) helios Nickerl 1846
Parnassius Latreille 1804 (ca 45)
Parnassius apollo L. 1758
Driopa Korshunov, 1988 mnemosyne L. 1759
Kailasius Moore, 1902 charltonius Gray 1853
Koramius Moore, 1902 delphius Eversmann 1843
Lingamius Bryk, 1935 hardwickii Gray 1831
Sachaia Korshunov, 1988 tenedius Eversmann 1851
Kreuzbergia Korshunov 1990 simo Gray 1853
Tadumia Moore, 1902 acco Gray 1853
Archon Hübner 1822 (3) thia Hübner 1806
= apollinus Herbst 1798
Luehdorfi a Kruger 1878 (4) eximia Crüger 1878
= puziloi Erschoff 1872
Sericinus Westwood 1851 (1) telamon Donovan 1798
= montela Gray 1853
Buthanitis Atkinson 1873 (4) thaidina Blanchard 1871
Zerynthia Ochsenheimer 1816 (7)
Zerynthia hypsipyle Fabricius 1777 = polyxena Denis & Schiff ermüller 1775
include 7 (or 8) genera – Hypermnestra, Parnassius, Archon, Luehdorfi a, Sericinus, Bhutanitis, Zerynthia (to include Allancastria) – which are distributed into Parnassiini, comprising the fi rst three genera, and one (Luehdorfi ini) or two (Luehdorfi ini and Zerynthiini; e.g. Nazari et al. 2007) other tribes.
Even though there has long prevailed a rather general consensus about this arrangement, controversies have arisen regarding the position of some taxa. To begin with, the monophyly of the subfamily has been questioned by various authors (e.g. Haüser 1993b; Caterino et al. 2001; Stekolnikov & Kuznetsov 2003). In a rather extreme example, some peculiarities of the adult and larval morphology of Hypermnestra resulted in this taxon being placed in a monobasic tribe or family by a number of specialists (Dujardin 1965; Hiura 1980; Häuser 1993b; Stekolnikov & Kuznetsov 2003). Archon has repeatedly been dragged from Parnassiini to Zerynthiini, owing to quite contradictory morphological and biological data, and it was even moved to a tribe of its own (‘Archontini’; Koçak 1989). However, recent molecular studies have revealed a quite unexpected, yet signifi cant affi nity with Luehdorfi a (Omoto et al. 2004; Katoh et al. 2005; Nazari et al. 2007). Th e latter genus was also proposed to deserve tribe rank in a study based on male genitalia by Stekolnikov & Kuznetsov (2003). Finally, some species of Zerynthia were segregated in the genus Allancastria by Bryk (1935); such a division, as well as that previously mentioned of Parnassius s.l., merely refl ects diff erent conceptions – splitter or lumper – of the genus.
Another taxon of controversial status, which might be allied to the Parnassiinae, is the genus Baronia Salvin 1893, with one species, B. brevicornis Salvin 1893 from Mexico. Baronia has been presented as the closest living approximation to the ancestor of all Papilionidae (e.g. Ehrlich 1958) or even of the Papilionoidea (butterfl ies; Scott 1985). However, some ancient works (Jordan 1907) had it incorporated in the Parnassiinae and it has in fact been placed basal to the Parnassiinae in a quite recent study (Nazari et al. 2007): undoubtedly, the exact phylogenetic affi nities of Baronia have bearings on any biogeographical scenario for the origin and diversifi cation of the Parnassiinae.
Th e systematic status of the genus Parnassius – a set of some 45 species – is a ticklish question as well. Some systematicians, including respected ones (e.g. Moore 1902; Bryk 1935; Munroe 1961; Korshunov 1988, 1990; see tab. 1), have proposed to split it in various, partly incompatible ways. Irrespective of the ongoing debate about a possible objective defi nition of the genus concept, it is of interest to determine which
of the suggested subsets are monophyletic indeed. Two recent papers (Omoto et al. 2004; Katoh et al. 2005) have used molecular data to address this question, but with only partial success, since no clear consensus could be reached regarding the order of divergence of the major subdivisions. Finally, at a fi ne scale, many of the uncertainties that persist about species delimitation in Parnassius (see Weiss 1991–2005) remain to be addressed in a systematic way by molecular tools.
Th e present study was undertaken in an attempt to generate a stable molecular phylogeny of Parnassiinae, with emphasis on Parnassius. Because the recently introduced Bayesian analyses make it straightforward to combine molecular data with morphological or physiological characters, the current trend is to present phylogenies based on ‘total evidence’ (e.g. for butterfl ies, Wahlberg et al. 2005; Nazari et al. 2007). Unfortunately, any subsequent analysis of the evolution of individual characters becomes circular to some extent. Th at is why we chose to resist the tide and use the phylograms (or, simply, trees) we generated from DNA sequences alone as a reference for discussing the evolution of other types of characters. Accordingly, the work is organized in two separate papers: in the fi rst, present one, a thorough analysis of molecular data is carried out, the reader being provided with minimal background information about the insects, while the second one (in preparation) is specifi cally devoted to the evolution of adaptive traits.
Preliminary results were presented at the Fourth International Conference on the Biology of Butterfl ies (‘Butterfl y Ecology and Evolution’ symposium), March 23-27, 2002, at Leyden, in the form of an abstract and poster, submitted by C. Rebourg, F. Michel, E. Cosson, H. Descimon and E. Faure. Recently, an article derived from this poster was published by three of the authors of the abstract (Rebourg et al. 2006). Unfortunately, this paper, which makes use of only a fraction of the sequence data that had been generated by us back in 2002, is severely fl awed by factual errors and misinterpretations (see below). In contrast, we chose to analyse the much enlarged Parnasssiinae dataset we and others (Omoto et al. 2004; Katoh et al. 2005; Nazari et al. 2007) have accumulated since that time, and have done our best to provide the reader with a multi-faceted perspective on the evolution of this fascinating group of butterfl ies.
Material and Methods DNA extraction, amplifi cation and sequencing
Individuals analyzed in this work are listed in the Annex Table, together with their origin, when known, and voucher code.
Th ey are stored in Gif or Marseille, either as dried, mounted insects, or frozen material. Specifi c and (tentative) subspecifi c identifi cation was performed by F. M. and H. D., and in case of doubt, double-checked by J.-C. Weiss.
DNA was extracted exactly as described in Aubert et al. (1999), usually from a single leg, occasionally from the thorax or anterior part of the abdomen. Samples were resuspended in 100 μl of 10 mM Tris-HCl pH 7.5, 1 mM Na2-EDTA, and 0.2 μl was routinely used for amplifi cation.
Th e primers used for PCR amplifi cation of the four mitochondrial DNA segments analyzed in this work are listed in tab. 2. Amplifi cation was performed in 50 μl of 20 mM Tris-HCl pH 8.8, 2 mM MgSO4, 10 mM KCl, 10 mM (NH4)2SO4, 0.1% Triton X-100, 1 μM of each primer, and 0.2 mM of each dNTP. Reactions were started by addition of Taq polymerase at 90 °C. A typical PCR cycle included 10 s denaturation at 92 °C and 3 min polymerization at 62 °C preceded by 45 s at the temperature chosen for renaturation (between 38 °C and 54 °C, depending on the pair of primers). Between 20 and 40 cycles, depending on the amount and quality of the DNA, were found to be necessary to obtain a visible band at the expected distance from the origin of migration after ethidium bromide staining of agarose gels. Th at band was cut from the gel and 1
μl of melted agarose was used for reamplifi cation (20 cycles). Reamplifi ed DNA was purifi ed with the GenElute kit from Sigma and sequenced on both strands with the primers used for amplifi cation. Any ambiguity was resolved by examining chromatograms with BioEdit version 7.0.4.1 (Hall 1999). A majority (69 %) of specimens were dried insects, a number of which came from old collections (up to about a century old). As has been experienced by others (Hajibabaei et al. 2005, and references therein), amplifi cation from material that had been kept at room temperature for more than 15 years proved unreliable and in a number of cases, we had to resort to amplifi cation of smaller fragments by using internal primers located about halfway between the termini of the DNA segment of interest (in the case of the CO1 and LSU segments, our two internal primers overlapped, resulting for each segment in the loss of a 20-nt stretch of sequence, which was coded as missing; recall, however, that in the case of the LSU gene, the missing stretch is invariant in all butterfl y taxa that we examined so far – Aubert et al. 1999; Martin et al. 2000; F.M., unpublished data – so that the loss of information should be minimal). We attempted to analyze the observed distribution of successes and failures as a function of the age of specimens by using a simple model according to which the probability of successful amplifi cation and sequencing is P = 1 – (1 – (1 – k)λ.t)N, where Table 2. List of primers used for amplifi cation and sequencing.
Segment Designation, orientation, and location
(if not terminal)
Sequence (from 5’ to 3’) LSU 984 (S) CGCCTGTTTATCAAAAACAT 20457 (S) TTCACTTGTTTATCAAAAACAT 3259 (R) CCGGTTTGAGCTCAGATCA 22157 (R) AAACCAACCTGGCTCACA 20870 (S,M) GAGAAGACCCTATAGAGTTT 20907 (R,M) AAACTCTATAGGGTCTTCTC ND1 1957 (S) CGTAAAGTCCTAGGTTATATTCAGATTCG 3264 (R) ATCAAAAGGAGCTCGATTAGTTTC 21578 (S,M) ATTTTATTTTTTTATGTTGTA 21536 (R,M) GTTTGTGCAACAGCTCGTAA
CO1 LCO1490(1) (S) GGTCAACAAATCATAAAGATATTGG
17379 (S) ATTCAACAAATCATAAAGATAT 21686 (S) ATTCAACAAATCATAAAGATATTGG 16736 (S) AGCGAAGTCGACTTTAtTCWACWAATCATAAaGATATtGG HCO2198(1)(R) TAAACTTCAGGGTGACCAAAAAATCA 17378 (R) AAACTTCTGGATGACCAAAAAATCA 16737 (R) TAGAATGCATGCTTCWGGRTGNCCaAAaAATCA 22014 (S,M) GAAAATGGRGCAGGAACT 21930 (R,M) AGTTCCTGCYCCATTTTC ND5 16740 (S) GCTGCTCGTACGCCTGTWTCWGCTTTaGTTCA 16741 (R) CCATAAGTCGACAAaTTHGGYATAAATCAtAT 22158 (S,M) ATAATAAATGATAATCAAGATATTCG 22159 (R,M) CTTATTCTTACTATYTCTAAAATTAAATC
Abbreviations: S, sense; R, reverse; M, middle; R, A(0.5):G(0.5); Y, T(0.5):C(0.5); W, A(0.5):T(0.5); H, A(0.33):C(0.33):T(0.33); a, A(0.9):G(0.1); t, T(0.9): C(0.1); N, A(0.25):G(0.25):T(0.25):C(0.25)
k is the rate of decay per nucleotide and time unit; t, the time elapsed at room temperature; N, the average number of intact molecules at t0; and λ is linearly related to the length of the segment to be amplifi ed. Consistent with this model, the critical age at which no more than half of the samples can successfully be exploited appears inversely related to the length of the segment of interest (fi g. 1); k and N were estimated from the entire dataset, whereas values of λ and their standard error were obtained by fi tting the available data for individual primer combination; t1/2 is the time at which P is calculated to be 0.5). In actual fact, the rate of successful amplifi cation and sequencing using our internal primers was no higher than 25 % for older specimens (aged 60–112 years), which makes the use of such samples too costly for consideration, except for taxa that are extinct or extremely diffi cult to obtain in reasonably fresh condition.
Sequence alignment and phylogenetic analyses
While alignment of the ND1 (472 nt), CO1 (649 nt) and ND5 (807 nt) sequences was straightforward, a number of indels were detected in the LSU data. Whenever possible, the precise location of these indels was determined by taking into account both the sequence and potential secondary structure of the large ribosomal RNA (fi g. 2), which we modelled after Niehuis et al. (2006). However, there remained a small number of subsegments that could not be unambiguously aligned and had to be left over. For analyses confi ned to Parnassiini, only positions 6–9 (coordinates as in fi g. 2) were removed from the dataset, while in the case of Papilionidae, we chose to discard also subsegments 40–42 and 317–324, leaving 513 and 494 aligned sites, respectively (the LSU alignments used for phylogenetic analyses are available from the authors). For analysis of amino-acid substitutions in the CO1 segment (see Results) all lepidopteran sequences made available in databases by March 2007 were downloaded and aligned (a maximum of ten entries were retained for any given taxon).
Analyses based on maximum parsimony and distance were conducted with PAUP* 4.0b10 (Swoff ord 2002), with gaps in the LSU alignment coded as ‘fi fth base’ and ‘missing data’, respectively. To calculate distances between subtrees (e.g. in order to estimate percent divergences over the CO1 segment, see Results), pairs of terminal nodes were replaced recursively by a single one, whose distances to other taxa were obtained from the arithmetic mean of the original ones. In order to assess the compatibility of any two datasets, we used the approach advocated by Delorme & Henaut (1988). Uncorrected distance matrices, generated by counting nucleotide diff erences, were converted into coordinates in multidimensional space by Principal Coordinate Analysis and the resulting clouds of points (each point standing for a taxon) were superimposed by minimizing the sum of squared distances between those taxa that are shared by the two datasets (Kabsch 1978). Histograms of absolute distances between shared taxa in multidimensional space were then generated and examined to detect possible outliers (fi g. 4).
Because of the large size of our datasets, maximum likelihood analyses were carried out using the fast approach implemented in Phyml 2.4.4 (Guindon & Gascuel 2003). A GTR (general time-reversible) substitution model was used, together with a fraction of invariant sites and four rate categories. Th e gamma shape parameter for the distribution of rate categories and the fraction of invariant sites were optimized by maximizing the
likelihood of the phylogeny prior to bootstrapping. Phylip 3.63 Consense program was used to generate a consensus tree topology and bootstrap percentages from the (at least) 200 pseudo trees generated by Phyml during bootstrapping. Th is consensus topology was then fed back to Phyml for parameter and branch length optimization.
Bayesian analyses were performed with program Mr Bayes 3.1.2 (Huelsenbeck & Ronquist 2001; Ronquist & Huelsenbeck 2003). A GTR substitution model with four site-specifi c rates and a proportion of invariant sites was specifi ed before running the program for 1,000,000 generations with default settings. Th e fi rst 4000 trees (out of 20000) were discarded prior to computing a consensus phylogeny and posterior probabilities. For some analyses involving the LSU segment (e.g. fi g. 5B) we took advantage of the diversity of models accepted by the program to code separately both the nucleotides that are part of secondary structure helices (using the ‘Doublet’ model option) and 18 alignment gaps (37 aligned sites, otherwise coded as ‘missing data’). In the latter case, a second partition and ‘restriction site’ (binary) coding were used (the ascertainment bias was taken into account by setting coding=variable and the two partitions were allowed to evolve at diff erent rates). In order to convert the phylograms generated by maximum likelihood and Bayesian analyses into chronograms, we used penalized likelihood, as implemented in program r8s, version 1.7 (Sanderson 2002), together with the cross-validation option. To Figure 1
Th e critical age for a dried specimen is an inverse function of the number of nucleotides to be amplifi ed and read. Abscissa: 1/L, where L is the length of a PCR-amplifi ed segment – primers included – in base pairs; ordinates: t1/2 is the duration of room-temperature storage for which half of the DNA samples could be successfully amplifi ed and sequenced (t1/2 and its standard error were estimated for each primer combination by fi tting the distribution of successes and failure as a function of age to the equation provided in Material and Methods). Using a linear equation, A/L, to fi t the data (straight line) yielded A = 12460 ± 520 bp.y (Pearson’s R = 0.918; the fi t was forced through the origin, since when a constant term was added, its value was smaller than its standard error).
Figure 2
Predicted secondary structure of domains IV and V of the mitochondrial large ribosomal RNA of P. apollo graslini (AJ224055), adapted from Niehuis et al. (2006). Th e segment analyzed in this work extends from positions 0 to 484. Th ick curves delimit sections that could not be unambiguously aligned throughout Papilionidae and were discarded from the analysis (for analyses limited to Parnassiini, only positions 6-9 were removed). Arrows point to rare substitution events, confi ned to one (exceptionally two) lineages (see Text, and for stem-loop G3, fi g. 13).
generate a chronogram of the entire Parnassius genus (fi g. 12), we proceeded as follows. First, the tree in fi g. 8, which is based on all four mitochondrial DNA segments, was converted into a chronogram by program r8s and calibrated by assuming a fi xed age of 38 MY (as inferred in fi g. 11) for the root of Parnassius. Th e procedure was then repeated on the LSU-ND1-CO1-based Phyml (maximum likelihood) tree of the genus, some sections of which are shown in fi g. 10. Finally, those subtrees with an expanded content in fi g. 10 (corresponding to subgenera Parnassius and Koramius and the clade of P. mnemosyne L. 1759) were grafted into the chronogram derived from the tree in fi g. 8 after having been brought to scale.
Results and discussion
Combining datasets
We have used four distinct sequence datasets to infer a molecular phylogeny of Parnassiinae, with emphasis on Parnassius. Th e four segments sequenced, abbreviated as LSU (518 aligned sites), CO1 (649 nt), ND1 (472 nt) and ND5 (807 nt), correspond to sections of the mitochondrial genes for the large subunit of ribosomal RNA (see fi g. 2), subunit 1 of cytochrome oxidase and subunits 1 and 5 of NADH-dehydrogenase, respectively (see Material and Methods; note that the CO1 segment coincides with the section of the gene used for ‘bar-coding’, see Hebert et al. (2003)). Sequence accession numbers are provided in the Annex Table. All LSU and ND1 sequences and most of the CO1 ones were generated from DNA that was extracted either in Gif or Marseille (this work; Aubert et al. 1999, and Rebourg et al. 2006).
Insect mitochondrial DNA is maternally inherited and is not expected to undergo recombination, so that datasets consisting exclusively of mitochondrial sequences should share the same phylogenetic history, including at infraspecifi c levels. Th at the sets of sequences used in this work are mutually compatible indeed is confi rmed by plotting the mean of bootstrap percentages as a function of the number of sites aligned for single and combined analyses (fi g. 3). As expected, bootstrap support is found to increase steadily as a function of the combined length of sequence, whether for our 32-taxa ‘Papilionidae’ (fi g. 5) or 65-taxa ‘Parnassiinae’ (fi g. 8) datasets.
Overall agreement between datasets does not eliminate the possibility that a limited fraction of the data for individual taxa are actually incompatible. Th ree possible sources of occasional inconsistencies may be contemplated : PCR contamination, sequencing of NUMTs (nuclear-located mitochondrial pseudogenes; reviewed by Bensasson et al. 2001) and combination of data obtained from individuals that actually belong to diff erent phylogenetic units. In order to try and avoid
these pitfalls we systematically resorted to the approach advocated by Delorme & Henaut (1989), which consists in superimposing distance matrices generated from the datasets to be combined (see Material and Methods) and looking for inconsistently located taxa. Of special concern was the merging of our Parnassius LSU+ND1+CO1 dataset with the ND5 dataset since
Figure 3
Mean of bootstrap percentages as a function of the number of aligned sites. Ordinates: bootstrap percentages were generated by PAUP* 4.0b10 from 200 pseudo datasets using the Neighbor-Joining algorithm and a LogDet distance measure. A, Papilionidae dataset (see fi g. 5); B, Parnassiinae dataset (see fi g. 8).
the vast majority of sequences in the latter had been generated in another laboratory from specimens distinct from ours (Omoto et al. 2004; see also Legend to the Annex Table). Nevertheless, the agreement between those two datasets is excellent, as indicated by the narrow distribution of distances between presumably
homologous phylogenetic units in multidimensional space (fi g. 4). P. hardwickii Gray 1831 is the only taxon to lie well outside the bulk of the distribution, and we believe that the likely reason for its position is not misidentifi cation (which is quite unlikely for this very distinctive species), but, rather, that the two individuals
Figure 4
Superimposition of nucleotide distance matrices over segment ND5 and the combination of segments LSU, ND1 and CO1 for 57 Parnassius taxa (the ones in fi g. 8). A, histogram of distances in the space defi ned by the fi rst six axes. B, C and D, relative positions of individual taxa in the two matrices along the fi rst three axes. Arrows indicate the location of P. hardwickii.
whose sequences were determined happened to come from the very two extremities of the species range (see Annex and further discussion below).
On the other hand, we did uncover one clear case of misidentifi cation, by examining the data published by Rebourg et al. (2006). Th e LSU and CO1 sequences claimed by these authors to be those of Parnassius acdestis Grum-Grshimailo 1891 (individual UP100-22, misspelled as ‘P. acdetis’ in their tab. 1; accession numbers DQ407794 and DQ407760) clearly pertain to another subgenus (Tadumia). We have been able to examine specimen UP100-22 and can confi rm that it was misidentifi ed and belongs instead to P. maharaja maharaja Avinoff 1916. By combining the two sequences determined in Marseille with the ND1 and ND5 sequences of the true P. acdestis, Rebourg et al. unwittingly created a chimera between two
subgenera, thus compromising the validity of their entire phylogenetic dataset and conclusions.
Molecular phylogeny of Parnassiinae and relationships with other Papilionidae
In an attempt to derive a molecular phylogeny of Parnassiinae and test for the monophyly of the subfamily, we sampled all 15 genera and subgenera that are traditionally grouped within Parnassiinae, together with 15 species from the rest of Papilionidae and two outgroups, selected from two of the remaining three families of butterfl ies. Th e dataset we assembled (2422 aligned sites) is defi nitely smaller than the one recently published by Nazari et al. (2007), which covers 5775 nt (including all four segments we analyzed). However, the latter lacks the ND1 sequence of Baronia (which is generally placed in a subfamily of its own) and
Figure 5
Molecular phylogeny of a sample of Papilionidae based on 2422 aligned sites (combined LSU, ND1, CO1 and ND5 segments). (A) consensus maximum likelihood tree (program Phyml 2.4.4, GTR substitution model, four site-specifi c rates plus invariant sites); numbers are bootstrap proportions. (B) consensus tree from Bayesian analysis (program mrbayes-3.1.2, GTR substitution model, four site-specifi c rates plus invariant sites); numbers are posterior probabilities. Subtrees at far right and numbers on the right side of slashes correspond to a variant model in which 18 indels were coded and loops were distinguished from base-paired stems in the LSU segment (see Material and Methods). Branches are coloured according to larval foodplant (indicated at bottom; see tab. 3 for a complete list).
comprises fewer Papilioninae (9 instead of 14).
Distance methods fail to take all information into account, while maximum parsimony is hardly appropriate to establish deep relationships with fast-evolving sequences (that is, unless sites are weighted according to their rates of evolution – Goloboff 1993). Th is is why we chose to resort to maximum likelihood and Bayesian analyses in order to derive the phylogenetic information presented in fi g. 5. Both approaches allow site-specifi c rate variation to be taken into account, something which largely obviates the need for data partitioning provided the individual subsets to be combined have comparable base composition and base-specifi c patterns of substitution. Still, an attempt was made to take advantage of the variety of models that can be integrated into Bayesian analysis by coding the indels in the LSU segment (otherwise interpreted as ‘missing data’) and treating separately the nucleotides that are included in secondary structure pairings, whose evolution is subject to (partly) explicit evolutionary constraints (see Material and Methods; it should, however, be stressed that the continued use of such naive evolutionary models as the ‘Doublet’ option of MrBayes is quite questionable now that the publication of atomic resolution structures of entire ribosomes with their ligands – e.g. Selmer et al. 2006 – has made it possible to gauge the complexity and diversity of constraints to which the evolution of individual nucleotides is subjected). Th ese two refi nements were expected to change in opposite ways the relative weight of the LSU segment in the complete dataset and in fact, they can be seen to have pretty little eff ect on the resulting tree topology and posterior probabilities: the only nodes to be aff ected are the most poorly supported ones (see fi g. 5B).
Very similar phylograms were generated by maximum likelihood and Bayesian analysis of the Papilionidae dataset (fi g. 5): only the statistical support
associated with individual nodes diff ers signifi cantly, the bootstrap test associated with the former method being defi nitely more conservative than Bayesian posterior probabilities. Monophyly of the three traditionally recognized tribes of Papilioninae is well supported in both trees, as is the sister-clade status of Papilionini and Troidini, and the basal position within the latter of Battus. Th ese features were already apparent in the morphology-based cladistic analyses of Hancock (1983) and Miller (1987) and in at least some molecular studies (e.g. Caterino et al. 2001; Braby et al. 2005; Nazari et al. 2007). Within Parnassiinae, the sister-clade relationships of Archon and Luehdorfi a on the one hand, and Hypermnestra and Parnassius on the other (both of them already recognized by Katoh et al. 2005, and Nazari et al. 2007) are all the more compelling that they are supported by separate analyses of each of the four sequenced segments (not shown). Th e former was totally unanticipated on morphological grounds: ‘common sense’, based on superfi cial analysis of wing patterns, had Luehdorfi a grouped with Bhutanitis, despite the latter sharing a divided hind-wing cell pattern with Zerynthia and Sericinus, and larval morphology (Igarashi 1984) with Zerynthia. As for grouping of Parnassius with Hypermnestra rather than Archon, it has repeatedly been debated (Hiura 1980; Haüser 1993), despite the traditional designation of Hypermnestra helios Nickerl 1846 as ‘Desert apollo’. A third, well-supported Parnassiinae clade consists of Sericinus, Bhutanitis and Zerynthia. Its phylogenetic relationship with the other two Parnassiinae subdivisions remains uncertain, which justifi es the recognition of three tribes (fi g. 5), as proposed by Nazari et al. (2007).
As expected from the redundancy of datasets, the trees in fi g. 5 are very similar indeed to those recently presented by Nazari et al. (2007). Still, our analysis diff ers signifi cantly from theirs in the placement of Baronia, presumably because of the inclusion of the ND1 sequence of this insect in our dataset. Baronia brevicornis, an isolated taxon confi ned to Mexico and a relatively late discovery (1893), has been regarded as a ‘living fossil’ and is traditionally placed in a separate subfamily of its own, at the root of Papilionidae. It was therefore somewhat unexpected to fi nd it located well within the Papilionidae consensus tree, next to the root of the Parnassiinae, in the maximum likelihood analysis of Nazari et al. (2007). Its position in our own phylogenetic trees is even more extreme, since it is part of the clade labelled Parnassiini, together with Parnassius and Hypermnestra.
Such an unconventional defi nition of Parnassiini is reasonably well supported by statistical analyses, Figure 6
Diversity of wing patterns in subgenus Koramius. Scale: x 0.96. Voucher codes (Annex Table) are provided for individuals whose mitochondrial DNA was analyzed or that came from the same population as individuals analyzed (in the latter case, the code is between square brackets). From left to right, 1st row: P. delphius male [UP100-12], P. patricius uzyngyrus D. Weiss 1979 male (W231), P. hide meveli Weiss & Michel 1989 female (W225); 2nd row: P. staudingeri infernalis male (Taldyk Pass, Kirghizstan),
P. staudingeri darvasicus male (W310), P. staudingeri kiritshenkoi female (W243); 3rd row: P. (staudingeri) jacobsoni male (W278), P. cardinal male [W246], P. (staudingeri) ruth male (W334); 4th row: P. (staudingeri) kohibaba male (W323), P. (staudingeri) affi nis female [UP100-10], P. stoliczkanus nobuko male (W256); 5th row: P. stoliczkanuszojilaica male [W267], P. (stoliczkanus) stenosemus male [W224], P. stoliczkanus stoliczkanus male [W261].
with a Bayesian posterior probability of 1.0 and a bootstrap percentage of 72. In order to assess the precise signifi cance of this fi nding, the 200 trees generated from pseudo-datasets and used to compute bootstrap percentages were sorted according to the position of Baronia and the root of Papilionidae (fi g. 7). Two topologies dominate among unrooted Papilionidae trees: in the prevailing one (Type I, 131 trees), Baronia is next to Parnassius and Hypermnestra, like in fi g. 5, whereas in the other one (Type II, 29 trees), it is located as proposed by Nazari et al. (2007), at the root of Parnassiinae (27 of the remaining 40 trees were discarded because at least one traditionally recognized phylogenetic unit was not monophyletic). Once the position of the root is taken into account, Baronia is found to be the sister group of Parnassius + Hypermnestra in 122 trees, against 29 in which it lies at the root of Parnassiinae. It should be added that a maximum likelihood consensus tree derived from two nuclear genes that were not sampled in our study (Nazari et al. 2007) also places Baronia at the root of Parnassiinae.
Molecular phylogeny of Parnassius
Th e molecular phylogeny of Parnassius shown in fi g. 8 is the most complete one to date: we have sampled essentially all taxa generally assumed or suspected to constitute species (with the exception of the very recently described P. davydovi Churkin 2006), as well as some major subspecies. It is also the one that rests on the largest number of aligned sites (2422).
Eight outgroups, whose phylogenetic relationships can be verifi ed to be the same as in unrooted versions
of the Parnassiinae subtrees of fi g. 5, were used to root our Parnassius trees. Inclusion of a larger number of Parnassiinae outgroup taxa, whose sequences were available for all but the ND5 segment, did not change signifi cantly either the relationships between outgroups or those within Parnassius (fi g. 9). And just as was the case for the phylogeny of Papilionidae, consensus trees obtained by Bayesian and maximum likelihood analyses were found to diff er only by a few exchanges at some poorly supported nodes (Legend to fi g. 8).
Th e genus Parnassius is currently subdivided into some eight subgenera (tab. 1) that correspond closely to Munroe’s ten ‘groups’ (1961), which were based primarily on venational and genitalic characters (the close relationship of the acco Gray 1853 and szechenyii Frivaldszky 1886 groups, which constitute together subgenus Tadumia, was already recognized by Munroe). As seen in fi g. 8, all these subgenera receive strong statistical support from molecular data (Bayesian posterior probability 1.0; bootstrap percentages ranging from 97 to 100); only the position of acdestis, within Kailasius rather than the related Koramius, is incongruent with the traditional classifi cation based on morphology. Th e same conclusion was already reached by Omoto et al. (2004) and Katoh et al. (2005), based on smaller datasets. However, our phylogeny of Parnassius diff ers signifi cantly from theirs, and also from the one recently published by Nazari et al. (2007), which was based on an incomplete set of six segments and eight taxa, in that there is a major split at the base of the genus between subgenus Parnassius (the ‘apollo’ group) and the other species.
Th e early branching position of P. apollo L. 1758and its relatives has rather good statistical backing (Bayes posterior probability 1.0, bootstrap percentage 73) and is further supported by a rare amino acid substitution in the CO1 segment we sequenced, at codon 159 (this is codon 174 in the reference Drosophila yakuba Burla 1954 sequence of Clary & Wolstenholme 1985; accession number NC_001322). At that position, which is part of the variable loop between transmembrane helices IV and V (Tsukihara et al. 1996), asparagine (AAY) predominates in Lepidoptera,
Figure 7
Two possible topologies for the unrooted phylogenetic tree of Papilionidae. Th e 200 bootstrap trees used to generate the consensus maximum likelihood tree in fi g. 5A were sorted according to the position of Baronia with respect to the six major lineages of Papilionidae (27 trees were rejected because one major subdivision was poly- or paraphyletic and 13 trees had topologies incompatible with types I and II). Figures next to branches are numbers of trees in which the root lay within that branch.
Figure 8
Phylogeny of Parnassiinae with emphasis on Parnassius according to Bayesian and maximum likelihood analysis of 2422 aligned sites. Numbers next to nodes are Bayesian posterior probabilities (left of slashes) and bootstrap percentages (right of slashes). Th e consensus tree from Bayesian analysis is shown, the maximum likelihood consensus tree has the same topology except within subgenus Parnassius (see also fi g. 10) and with respect to Sachaia and Lingamius, which form a distinct, poorly supported (43 percent) clade branching between Tadumia and the rest of Parnassius.
being present in 85 % of Rhopalocera and 95 % of a sample of other families (Material and Methods). In addition to asparagine, two amino-acids, serine (AGN) and lysine (AAR), appear to constitute well tolerated, yet rather short-lived variants at position 159, with scattered occurrences in all, or nearly all, families (overall frequencies 6.5 and 2.7 % of Rhopalocera, respectively). In contrast, glycine (GGN) and histidine (CAY), the other two signifi cant variants in terms of frequency (2.1 and 3.5 %, respectively), are confi ned to a small number of subtrees. Nearly all occurrences
of the former are in Nymphalidae (in Coenonympha Hübner 1819, Junonia Hübner 1819, and the American section of Limenitis Fabricius 1807, in particular), while the latter is restricted almost exclusively to Parnassius (only three additional occurrences in 2238 Rhopalocera sequences): whereas subgenus Parnassius (30 sequences) has asparagine (or serine, in P. apollo graslini Oberthür 1891), the remaining seven subgenera (80 sequences) have histidine (with three exceptions; secondary mutations leading to tyrosine (UAY) occurred in P. nordmanni Nordmann 1851 and
Figure 9
Unrooted maximum likelihood consensus tree of Parnassiinae for the combined LSU, ND1 and CO1 segments (1615 aligned sites). Numbers next to nodes are bootstrap proportions.
Figure 10
Internal phylogenetic structure of sugenera Parnassius, Koramius and Driopa according to Bayesian analysis (left) and maximum likelihood analysis (right) of the combined LSU, ND1 and CO1 segments (1634 aligned sites). Selected sections of consensus trees of Parnassius + Hypermnestra are shown, drawn to the same scale. Numbers next to nodes are Bayesian posterior probabilities (left) and bootstrap percentages (right; see fi g. 12 for the complete topology of the maximum likelihood tree). Th e two Driopa consensus trees were combined into a single one since their topology was the same except within the (poorly resolved) eurasiatic clade of P. mnemosyne.
P. mnemosyne farsica Bang-Haas 1938, and there was a reversion to asparagine in P. mnemosyne shelzhujkoi Bryk 1912). Since all other Parnassiinae (49 sequencs) have asparagine at position 159, by far the most likely interpretation of the pattern observed in Parnassius is that (i) the asparagine codon mutated to a histidine codon after subgenus Parnassius had separated from the rest; (ii) histidine confers some sort of selective advantage, which accounts for its evolutionary stability in the lineage that acquired it.
Aside from the apollo group, the relationships between Parnassius subgenera remain mostly obscure. Kailasius and Koramius clearly constitute sister clades, as again anticipated by Munroe, and it is rather likely (Bayesian posterior probabilities 0.97) that Kreizbergia and Driopa on the one hand, and Lingamius and Tadumia on the other, are related (the latter share a rare transversion at position 280 of the LSU segment, see fi g. 2). However, the relative arrangement of the four
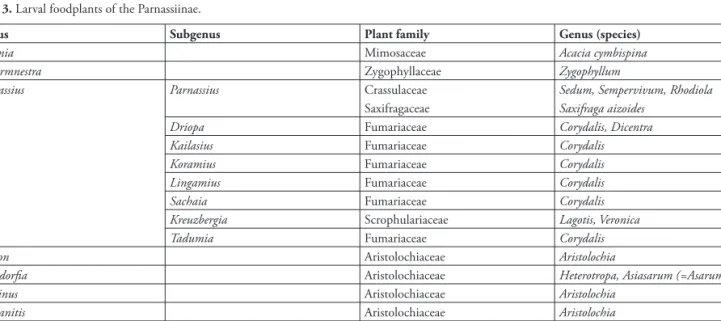
resulting subdivisions – Sachaia, Lingamius + Tadumia, Kailasius + Koramius, Kreizbergia + Driopa – is largely uncertain, which suggests that divergence occurred over a short period of time, possibly as a result of the colonization of the new ecological niche constituted by Fumariaceae (see tab. 3 and General Discussion).
Within subgenera, phylogenetic relationships tend to be better recovered. In Driopa for instance, P. orleans Oberthür 1890, which is the only species to have retained a primitive pattern of blue marginal spots, is located basally and the special relatedness of P. clodius Ménétriés 1855 and P. eversmanni Ménétriés 1855 (the two species that coexist in North America) on the one hand, and P. stubbendorfi Ménétriés 1849 and P. glacialis Butler 1866 on the other, is confi rmed. Th e fi ne structure of subgenera Parnassius and Koramius (fi g. 10) is discussed in a subsequent subsection, together with the possible bearings of molecular data on species delimitation.
A temporal frame for the evolution of Parnassiinae and Parnassius
While the phylograms in fi gs. 5 and 8 were generated without any assumption about the pace of evolution, hence their unequal branch lengths, all terminal nodes can be forced to stand an equal distance from the root (P. brassicae L. 1758+ L. celtis Laicharting 1782 in fi g. 5) by assuming a molecular clock to exist (clock option in Paup*). Th is, however, is at the expense of likelihood, which jumps from –21552.1 to –21633.0 for the tree topology in fi g. 5A, indicating that individual lineages experienced signifi cantly diff erent rates of molecular evolution over the DNA segments analyzed (Felsenstein 1988).
Diff erent rates of mitochondrial evolution can result from some localized sections of mitochondrial DNA experiencing markedly slower or faster evolution in some lineages or else, from the evolution of the entire genome changing pace, e.g. following some mutation(s) in the replication and reparation apparatus: in the former, but not the latter case, the magnitude of the eff ect should decrease as the number of sampled genome segments grows (the undetected presence of NUMTs among sequence data could also
Figure 11
A possible temporal frame for the evolution of Papilionidae. Th e maximum likelihood consensus tree of fi g. 5A was processed by program r8s (Sanderson 2002). Th e solution shown is the one generated by the cross-validation test. Calibration was generated by placing the root at -100 million years (see Text).
Figure 12
Possible time frames for the evolution of Parnassius. Th e maximum likelihood consensus tree of fi g. 10 (rooted with Hypermnestra helios) was processed by program r8s (Sanderson 2002). Th e solution shown is the one generated by the cross-validation test. Two putative calibrations were generated (i) by placing the root of the genus at -38 million years, as in fi g. 11; (ii) by assuming an uncorrected rate of 1.5 substitutions per site per million year (see Text).
be responsible for a seemingly higher rate of evolution for particular segments and taxa). In order to try and distinguish between these possibilities we compared distances to outgroups for each of the four segments sequenced. When uncorrected, absolute numbers of substitutions relative to P. brassicae and L. celtis (fi g. 5) are tabulated (not shown; 3rd codon positions were excluded from protein-coding sequences), Cressida is found to rank second out of 30 ingroups for the LSU segment, fi rst for ND1, fi rst (by far) for CO1 and fourth for ND5, which leaves little doubt that all or most of the mitochondrial DNA of that taxon has experienced a marked increase in its rate of evolution compared to the other Papilionidae we sampled. On the slow side, however, there is no undisputed winner among the taxa connected by much shorter branches than their closest relatives: P. apollo ranks 26/30 for LSU, 26/30 for ND1, 23/30 for ND5, but only 14/30 for CO1; similarly, B.philenor L. 1771(a Troidini, like Cressida) is 26/30, 25/30 and 27/30 for LSU, CO1 and ND5, respectively, but only 13/30 for ND1.
In order to convert our phylograms into chrono-grams, we resorted to the ‘r8s’ program of Sanderson (2002) which performs semi-parametric rate smoothing under a penalized likelihood framework and provides the user with a cross-validation procedure to adjust the extent of smoothing to a presumably optimal value. Th e outcome is shown in fi g. 11 for the tree of fi g. 5A. Th e root of the tree was put somewhat arbitrarily at –100 MY (million years), in a compromise attempt to match as closely as possible both the date of diver-gence of Troidini (–90 MY) in Braby et al. (2005) – –87 MY in fi g. 11 – and the slightly confl icting date of divergence of Troidini from Papilionini (between –82.5 and –89.1 MY) in Zakharov et al. (2004) – –90 MY in fi g. 11.
Strikingly, all six Papilionidae tribes are seen to antedate the Cretaceous-Tertiary boundary (at –65 MY), as seems also to be the case for some 43 lineages of placental mammals (Bininda-Emonds et al., 2007) and 40 bird lineages (Brown et al., 2007). Parnassiinae (including Baronia) appears somewhat older than proposed by Nazari et al. (2007) – ca 86 MY instead of ca 77 MY. Finally, despite our internal phylogeny of Parnassius being distinct from that of Nazari et al. (2007), the age we inferred for the genus (38 MY) is very similar to the one estimated by these authors.
Just as is the case for Papilionidae, some lineages within Parnassius (e.g. subgenus Parnassius) evolved at a distinctly slower pace than the rest, while others (e.g. the clade of P. mnemosyne) underwent accelerated evolution. Nevertheless, a chronogram may be generated for the entire genus (fi g. 12; see Material
and Methods) by resorting again to program r8s, together with a fi xed age of –38 MY for the root of Parnassius. As immediately apparent from that chronogram, once subgenus Parnassius had separated from the rest, the successive splits that gave rise to the other seven subgenera occurred in rather quick succession – between ca –34 and ca –27 MY according to fi g. 12, that is, within a lapse of time of less than one-fi fth the age of the genus. It is tempting to ascribe this rapid diversifi cation, which makes it diffi cult to recover the precise phylogenetic relationships of the major Parnassius subdivisions (fi g. 8), to a newly available ecological niche, which we suggest was created by the initial colonization of Fumariaceae (see General Discussion).
In a second phase, from ca –24 to –17 MY, subgenera that currently include multiple species (Parnassius, Tadumia, Kailasius, Koramius and Driopa) started in turn to diversify. Kreizbergia is a special case, because the extant taxa in this phylogenetic unit appear to have diverged from one another much later than is the case for other subgenera – posterior to –7 MY according to the temporal calibration used in this subsection, and possibly much more recently (see next subsection). While a tardy process (fi g. 12), the diversifi cation of Kreizbergia was rapid and allowed its member taxa to occupy nearly all of the central Asian mountains. A likely possibility is that this rapid expansion resulted from the colonization of a new niche (tab. 3): all P. simo Gray 1853relatives appear to use Lagotis (Scrophulariaceae) rather than Corydalis as a larval foodplant (Veronica, another genus from Scrophulariaceae, was also recorded by Kreuzberg 1987, as an alternative larval foodplant for P. simonius Staudinger 1889).
An alternative time frame for relatively recent events
Extending our temporal calibration of Parnassius evolution to the specifi c and infra-specifi c levels (fi g. 12) results in unexpectedly elevated estimates for the ages of mitochondrial clades associated with species. For instance, the ancestral mitochondrial genomes of P. apollo and P. mnemosyne are calculated to be 8.0 and 10.5 MY old, respectively. Just the same, the estimated dates of divergence of many pairs of sister species are surprisingly large. Th us, P. apollonius Eversmann 1847 and P. honrathi Staudinger 1882, which occasionally generate viable hybrids in nature (one of them is illustrated in Turlin & Manil 2005), are found to have separated some 15.0 MY ago according to fi g. 12. Th e problem is not specifi c to this work; similar fi gures were proposed by Nazari et al. (2007), who estimated for instance the date of divergence of Zerynthia polyxena
and Z. rumina at some –15 MY (much the same value was obtained by calibrating the tree in fi g. 9 – data not shown). Th is seems exaggerate, given the fact that the two species, whose ranges overlap only in parts of South-Eastern France, yield hybrids that, although very rare in nature, are not only viable, but proved quite fertile when backcrossed to the parental stocks (Descimon & Michel 1989).
Should then the assumptions used by Zakharov et al. (2004), Braby et al. (2005), Nazari et al. (2007) or ourselves to generate a time frame for the diversifi cation of Papilionidae be challenged? All these works have in common that the divergence of major Papilionidae subdivisions is assumed to antedate the fi nal break-up of Gondwanaland, a process which, as thoroughly discussed by Braby et al. (2005), is held responsible for the present distribution of Troidini by most authors in the fi eld. Th e problem is, that as already noted by Zakharov et al. (2004), these assumptions result in estimates of numbers of substitutions per site and million years that tend to be much smaller than those published for other insects. However, the latter are mostly based on relatively recent events, so that this apparent discrepancy, rather than being specifi c to butterfl ies or insects, is more likely to illustrate the now well-recognized transition in metazoans between a high mutation rate on the short-term and a much lower substitution rate on the long term (Ho et al. 2005).
Unfortunately, the calibration curves that would enable one to convert small percentages of nucleotide substitutions into times of divergence remain to be generated for butterfl ies. Nevertheless, it should remain meaningful to compare relative estimates of dates as long as they are within the same range: in order to try and provide the reader with an alternate, tentative time scale for relatively recent events, we have added at the bottom of fi g. 12 a second ruler, which corresponds to an uncorrected substitution rate of 1.5 substitutions per site per million year, as estimated by Farrell (2001) for CO1, and adopted by Kandul et al. (2004) to calibrate their phylogenetic tree of Agrodiaetus Hübner 1822, a butterfl y genus estimated to be about 3 MY old (see Material and Methods). All times of divergence quoted in the next subsection, which discusses primarily the relationships between mitochondrial clades and species trees, are based on the latter calibration; they are indicated in italics and diff er from the ones used heretofore by nearly 5-fold.
Mitochondrial lineages and species delimitation in Parnassius
Th ere is considerable controversy currently regard-ing the extent to which intra- and interspecifi c levels
of mitochondrial DNA divergence overlap. Whereas advocates of the identifi cation of species by DNA ‘barcoding’ (using the CO1 segment of mitochondrial DNA we sequenced) claim that interspecifi c nucleotide divergence is as a rule far greater than intraspecifi c vari-ation (Hebert et al. 2003), no such gap is apparent in a comprehensive analysis of available barcode sequences of Lycaenid butterfl ies (Wiemers & Fiedler 2007). Admittedly, there appears to be an upper bound for intraspecifi c divergence in the Lycaenidae that were sampled – it is less than 3.2 % in at least 95 percent of species – but there exists no lower limit to interspe-cifi c distance, which is often found to be less than 1 % (fi g. 5 in Wiemers & Fiedler) and can be nil.
A deeper issue at stake is whether or not mitochondrial phylogenetic trees are likely to be congruent with species trees for recently diverged taxa. Of course, recently isolated populations are likely to share some of the mitochondrial DNA diversity that existed prior to their separation, so that young species may not appear reciprocally monophyletic in mitochondrial phylogenies until their mitochondrial genetic pools have been purifi ed by lineage sorting. Of more concern is the possibility of phylogenetic relationships being confounded by the repeated introgression of mitochondrial DNA. In the case of Lepidoptera, since the female, through which mitochondrial DNA is inherited, also happens to be the heterogametic sex, it is a consequence of Haldane’s rule (i.e. the much higher susceptibility of heterogametic hybrids to inviability and sterility), that introgression of mitochondrial DNA should become negligible once postzygotic incompatibility is established (except, perhaps, if transfection by male-killing Wolbachia bacteria, as observed in Acraea, were to prove a widespread phenomenon; Jiggins 2003; Hurst & Jiggins 2005). On the whole then, mitochondrial clades should generally agree with other criteria used to delimit lepidopteran species, provided the latter are defi ned according to their ability to maintain genetic integrity when in contact and have not diverged too recently (reviewed by Sperling 2003). Th us, we regard the fi gure reported by Wiemers & Fiedler (2007), that at most 43 % of Agrodiaetus species appear monophyletic in a mitochondrial phylogeny of the genus, as likely to refl ect primarily an explosive speciation rate – 1.6 species per MY according to Kandul et al. (2007) – and possibly also, some problems in the delimitation of species.
In the case of Parnassius, we have systematically confronted our inferred mitochondrial clades and estimated relative dates of divergence with currently available information regarding species and their
delimitation, using the latest version (2005) of C. Häuser’s Papilionidae checklist as a primary reference (in order to allow comparison with Wiemers & Fiedler, 2007, percent divergence over CO1, calculated according to Kimura’s two-parameter model, is quoted next to the date of divergence, estimated from all sequence data over the LSU, ND1 and CO1 segments). As is to be seen hereunder, the main lesson of this exercise is that despite the extraordinary attractiveness of Parnassius both to amateurs and professionals, much remains to be learnt about the biological systematics of its member species.
(i) Subgenus Parnassius s. str. Latreille 1804
In all our trees but the one based on Bayesian analysis of the LSU+ND1+CO1 segments (fi g. 10), the fi rst lineage to split from the main trunk of subgenus Parnassius consists of P. apollonius and P. honrathi. Th e two taxa, whose sister-species status has long been recognized, have overlapping ranges in the mountains of western Central Asia. On the other hand, we were unable to come up with a stable phylogeny for the rest of the subgenus. However, a number of signifi cant facts emerge from the inspection of available data and trees.
In our sampling of subgenus Parnassius, we focused on P. apollo and P. phoebus Fabricius 1793 on the one hand, and taxa traditionally grouped into P. epaphus Oberthür 1879, P. nomion Fischer De Waldheim 1823 and P. jacquemontii Boisduval 1836 on the other. P. apollo, which is widely distributed from southern Spain to Mongolia, has attracted much interest because of conservation issues: a number of local European populations, many of which had been granted subspecifi c status by afi cionados based on minor deviations in wing pattern, have gone extinct or are endangered. While we sampled only fi ve individuals from the entire range of the species, two points are already apparent: P. apollo displays considerable mitochondrial polymorphism (fi gs. 12–13), pointing to its relative antiquity (estimated at –1.7 MY; 2.6 % nucleotide divergence between graslini and other subspecies); however, as far as can be judged from such limited data, there does not seem to be a major geographical component to that variability.
In the Alps, the distribution of P. apollo broadly overlaps with that of P. phoebus sacerdos Stichel 1806 and hybrids are not infrequent in some of the localities where the two species meet (Deschamps-Cottin et al. 2000). Interestingly, these hybrids are fertile, pointing to a closer relationship between P. apollo and P. phoebus than with the rest of the genus, something that is also apparent from the trees in fi gs. 8 and 10. In contrast
to P. apollo, there has been much controversy regarding the taxa that should be included into P. phoebus, which tends currently to be split into at least three, and more frequently four or fi ve distinct morphological ‘species’. Th e distribution of P. phoebus in Eurasia is a highly disjoint one, with the morphologically distinct P. phoebus sacerdos from the European Alps being quite isolated from the main nucleus, which extends from the Urals to far eastern Siberia. Even in the relatively limited territory of the Alps, two ecologically distinct populations coexist without overlapping: gazeli Praviel 1936 in the extreme Southwest and styriacus Fruhstörfer 1907in the East share with other phoebus subspecies the use of Crassulaceae as larval foodplant, whereas the remaining populations have shifted to Saxifraga aizoides.
At the southern edge of the Asian range of phoebus, the status of ruckbeili Deckert 1909 has remained controversial. Initially described as a subspecies of phoebus, it has alternatively been grouped with actius Eversmann 1843 or regarded as a distinct species (Häuser 2005, and references therein). Nor is the situation clearer in North America. Th e asiatic P. phoebus reaches western Yukon as the weakly diff erentiated subspecies golovinus Holland 1930. In southern Yukon, it is replaced by populations of the smintheus Doubleday 1847group, with a diff erent wing pattern, body vestiture and egg microsculpture (Shepard & Manley 1998). Th e latter character has been used to raise not only smintheus, but the allied behrii Edwards 1870from the Sierra Nevada of California, to species rank. A fi nal potential point of controversy is the status of P. bremeri Bremer 1864, which replaces P. phoebus in far eastern Russia, Manchuria and Korea. Th e wing pattern and antennae of typical bremeri are quite diff erent from those of typical phoebus, and it has long been regarded as a diff erent species. However, there exist populations – e.g. amgunensis Sheljuzhko 1928, from the lower Amur basin – with characters intermediate between those of phoebus and bremeri, and their existence raises the question of the actual identity of the latter taxon (Korshunov & Gorbunov 1995; Gorbunov 2001).
We sampled all aforementioned taxa of the phoebus complex and used the resulting data to generate the mitochondrial phylogenies and chronogram shown in fi gs. 10 and 12. Our results confi rm and extend those of Omoto et al. (2004) who published ND5 sequences of phoebus, bremeri and smintheus. Mitochondrial DNA variation in the Alps is nil: there is not a single nucleotide diff erence between gazeli and neighbouring sacerdos populations over the LSU, ND1 and CO1 segments. P. bremeri from Korea stands halfway
between P. phoebus interpositus Herz 1903 and P. p. golovinus – four nucleotide substitutions from each; the distance between interpositus and golovinus is 6 substitutions – which leaves little room for doubt that instead of being a distinct species, bremeri is just another Asian form of phoebus. As expected, smintheus and behrii are closely allied, but the two are rather well separated from the rest of phoebus, with an estimated date of divergence (–1.0 MY; 1.8 % nucleotide divergence) which is smaller than the age of P. apollo, for instance, but larger than that at which mercurius Grum-Grshimailo 1890 separated from the nomion-epaphus lineage (see below). We believe that unless localities in which the two taxa coexist happened to be found in Yukon, it is only by examining the viability and fertility of hybrids between the phoebus and smintheus lineages that it might be possible to decide whether they should be regarded as constituting distinct species.
Th e argument for elevating ruckbeili to species rank would seem a priori much stronger: in all but the tree based on maximum parsimony (fi g. 13), the branch leading to ruckbeili lies basally with respect to the point of divergence of apollo from phoebus and the date estimated for the separation from the apollo-phoebus lineage is a relatively elevated one (–2.3 MY; 2.4 %). Still, ruckbeili shares with all the other taxa potentially grouped with phoebus a unique substitution (an A to C transversion) at position 265 of the LSU segment. Th is mutation creates a U:C mismatch in the middle of ribosomal RNA helix G3 (fi g. 13), and it may have been positively selected, since at least in the basal part of that helix, most substitutions are compensatory (i.e. they restore base-pairing), even at the intraspecifi c level (compare the sequences of P. apollo graslini, venaissinus Fruhstörfer 1921, graecus Ziegler 1901and nevadensis Oberthür 1891), which indicates that on an evolutionary time scale, mismatches tend to be short-lived. However, the evidence from another rare event, at codon 151 of the ND1 segment, is contradictory and pleads strongly in favour of ruckbeili being a distinct entity: whereas the apollo and phoebus lineages show a serine codon at that position, ruckbeili has a cysteine codon, which it shares with all other Parnassiinae, including Baronia. Either the latter substitution or the one in the gene coding for the large ribosomal RNA molecule must have become fi xed more than once, possibly in response to the selection pressure created by a mutation in a nuclear gene, whose history need not be congruent with that of the rest of the genome.
Th e other section of subgenus Parnassius whose systematics are clearly addressed by sequence data comprises the taxa generally grouped into jacquemontii,
epaphus and nomion. P. jacquemontii is traditionally presented as a species with marked geographical variation and a curiously disjoint distribution. Our data indicate that it corresponds to the artifi cial grouping of two essentially unrelated lineages, jacquemontii in western Central Asia and mercurius in central China. Th e latter includes populations with lightly marked wings (actinoboloides Bang-Haas 1928) or with an intermediate pattern (mercurius), as well as others with a dark grey background (tibetanus Rühl 1893), which we were unable to sample but that most likely belong here. As seen in fi gs. 8, 10 and 13, mercurius is part of a well-supported clade, whose members share a unique A to C transversion in the terminal loop of helix G3 (the C subsequently mutated to U in nomion nominulus Staudinger 1895 and nomion mandschuricus Oberthür 1891 – see Katoh et al., 2005, for the latter sequence). Th e sister lineage of mercurius consists of the epaphus-nomion taxon group: the two lines diverged rather recently, around –0.7 MY (1.3 % nucleotide divergence). Despite this relatively late separation, mercurius is readily distinguished on morphological grounds from those members of the epaphus-nomion complex with which it cohabits. In contrast, the small, high-altitude epaphus and the large, low-altitude nomion, which had always been regarded as distinct species, cannot be distinguished from one another by their mitochondrial DNA sequences, nor can all individuals from those localities where the distributions of epaphus and nomion meet be confi dently sorted out based on morphological criteria (H. Descimon, unpublished observations). Finally, dongalaicus Tytler 1926, which has a very restricted distribution in southern Tibet and had often been grouped with epaphus despite its (slightly) keeled sphragis and its sympatry with some populations of the latter, does possess the A to C transversion in helix G3. However, it diverged from the epaphus-nomion-mercurius clade some 2.0 MY ago (3.3 % divergence), that is, long before the split between mercurius and its sister taxa.
(ii) Subgenus Sachaia Korshunov 1988
As already noted by Omoto et al. (2004), the extreme similarity of the ND5 sequences of tenedius Eversmann 1851 and arcticus Eisner 1968 was somewhat unexpected given the divergent wing patterns and ecology of the two taxa. Th e lack of genetic diff erentiation between tenedius and arcticus has been confi rmed by Chichvarkhin (2004), who sequenced sections of two nuclear genes in addition to other mitochondrial segments from a larger number of individuals and observed minimal variation. Th e