Title:
The control of upper body segment speed and velocity during the golf swing
Authors and affiliations:
Sean A Horan1, 2 & Justin J Kavanagh1, 2
1. School of Rehabilitation Sciences, Griffith University, Australia
2. Musculoskeletal Research Program, Griffith Health Institute, Griffith University, Australia
Corresponding author details: Sean Horan
School of Physiotherapy and Exercise Science Gold Coast campus
Griffith University QLD, 4222 AUSTRALIA Ph: +61 7 5552 8038 Fax: +61 7 5552 8674 Email: s.horan@griffith.edu.au
Abstract
Understanding the dynamics of upper body motion during the downswing is an important step in determining the control strategies required for a successful and repeatable golf swing. The purpose of this study was to examine the relationship between head, thorax and pelvis motion, during the downswing of professional golfers. 3D data were collected for fourteen male professional golfers (age 27 8 yrs, golf playing experience 13.3 8 yrs) using an optical motion analysis system. The amplitude and timing of peak speed and peak velocities were calculated for the head, thorax and pelvis during the downswing. Cross-correlation analysis was used to examine the strength of coupling and phasing between- and within-segments. The results indicated the thorax segment had the highest peak speeds and peak velocities for the upper body during the downswing. A strong coupling relationship was evident between the thorax and pelvis (average R2 = 0.92 across all directions), while the head and thorax exhibited a much more variable relationship (average R2 = 0.76 across all directions). The strong coupling between the thorax and pelvis is possibly a method for simplifying the motor control strategy utilised during the downswing, and a way of ensuring consistent motor patterns.
Introduction
The motion of the head, thorax and pelvis are considered to be critical to a successful and repeatable golf swing in professional golfers (Myers et al., 2008; Wiren, 1997). Understanding the dynamics of upper body motion becomes particularly relevant when one considers that the golf swing is a powerful short duration movement that allows for minimal feedback and error correction during the task. Recent evidence suggests that skilled golfers are able to perform the golf swing in a relatively invariant manner (Bradshaw et al., 2009; Horan et al., 2011). However, to gain further insight to the control strategy employed during the golf swing, a more detailed examination of the dynamics of the head, thorax and pelvis is warranted.
Sports scientists and biomechanists have frequently used the amplitude and timing of 3-dimensional (3D) peak velocity (Lindsay et al., 2002; Myers et al., 2008; Zheng et al., 2008) as well as total speed of segment movement (Evans et al., 2008; Tinmark et al., 2010) to describe golf swing dynamics. However, these two measures have not been used in conjunction, and therefore, interpretation of speed and velocity of individual body segments performing the same task may not be consistent. From a biomechanical perspective velocity is a vector measurement that provides information about the 3D orientation of a body segment, and in particular, the rate of change in orientation. Reporting the total speed of a body segment also describes the rate of change in motion, however, it is a scalar measurement that does not account for orientation, and as a result certain subtleties of the golf swing may be lost in analysis. For example, while it is commonly accepted that total thorax speed exceeds total pelvis speed during the downswing, examining velocity profiles of individual segments allows for a greater understanding of which movement directions contribute most to the difference. It is of considerable interest to determine if different
information is extracted from the golf swing depending on whether segmental motion is partitioned into 3D components or if a global representation of segment motion is examined.
The relationship between golf swing performance and inter-segment dynamics has typically been focussed towards the thorax and pelvis. Although never formally investigated, it has been proposed that specific patterns of thorax-pelvis motion during the downswing are related to more powerful swings in certain individuals (Burden et al., 1998; Cheetham et al., 2001). Interestingly, although a large extent of golf coaching literature highlights the importance of maintaining stable head motion (Adams and Tomasi, 2001; Wiren, 1997), little empirical evidence exists concerning head-thorax coordination during the golf swing. The timing of segment motion and thorax-pelvis separation (X-Factor) has revealed that in skilled golfers, the motion of the pelvis precedes the motion of the trunk during the downswing (Burden et al., 1998; Cheetham et al., 2001; Tinmark et al., 2010). However, the control strategies adopted by individuals when performing the golf swing are not well understood.
It has been proposed that to control the many degrees of freedom present in the neuromuscular system, the central nervous system reduces the complexity of control by activating functionally cooperative muscles as a group rather than individually (Bernstein, 1967). Simplified functionality is further exploited with practice, where a more optimal strategy for movement is formulated by the neuromuscular system (Shemmell et al., 2005). If this concept is extended to the motor output of well practiced skilled golfers, a simplified control strategy would be reflected by similar motor output between segments and between directions. Horan and colleagues (2010) have observed similar patterns of motion between segments and within segments, particularly for the thorax where lateral tilt and axial rotation velocities exhibit very similar amplitude and phasing relationships. Analyses that examine coupling between upper body segments and between directions of movement may reveal important control strategies not yet realised.
The purpose of this study was to examine the relationship between head, thorax and pelvis motion, during the downswing in professional golfers. The amplitude and timing of peak segment speed, as well as the peak velocity for individual movement directions, was compared between segments. It was hypothesised that the thorax would exhibit the greatest total speed of movement due to the importance attributed to the trunk in assisting in the generation of power during the downswing. It was also hypothesised that coupling for the thorax and pelvis would be greater than for the head and thorax, due to the importance of thorax-pelvis interactions during the downswing. Collectively, it is expected that the results of this study will provide further insight into the control strategies adopted in the largest and most proximal segments of the body, by professional golfers.
Methods
Participants
Fourteen male professional golfers (mean standard deviation; age 27 8 yrs, height 1.79 0.04 m, mass 81.2 9.6 kg, golf playing experience 13.3 8 yrs, practice per week 14 9.6 hrs) volunteered for the study. All golfers were free from injury at the time of testing as determined by an experienced physiotherapist (SH). Written informed consent was obtained prior to data collection, and all experimental procedures were approved by the Griffith University Human Research Ethics Committee.
Data collection
Four retro-reflective markers were attached to the head on the right and left sides of the frontal eminence and right and left sides of the occipital protuberance. Four markers were attached to the pelvis on the right and left anterior-superior iliac spines and posterior superior
iliac spines. Four markers were attached to the thorax over the suprasternal notch, xiphoid process, C7 and T10 spinous processes. To create a local coordinate system (LCS) for kinematic analysis, a further two markers were attached to the right and left heel of the subject’s golf shoes which approximated the calcanei.
3D marker trajectories were collected using an optoelectronic motion analysis system (Vicon, Oxford Metrics, Oxford, UK), consisting of eight MX13 near-infrared cameras, operating at 500Hz. Raw 3D coordinate data were filtered using a zero-lag fourth-order low-pass Butterworth filter, with cut-off frequencies for individual markers (6-10Hz) determined via residual analysis (Giakas and Baltzopoulos, 1997). Filtered marker trajectories were subsequently modeled using custom-designed BodyBuilder software, version 3.6 (Vicon, Oxford Metrics, Oxford, UK).
Once all markers were attached, each participant performed a standardized 10 minute warm-up which included large dynamic movements, static stretches and graded air swings (Fradkin et al., 2004). Participants then familiarised themselves with the laboratory environment by hitting golf balls covered in retro-reflective tape from a rubber tee embedded in an artificial turf mat (1.8 × 1.8 m) into a net approximately three meters away. Data collection consisted of each participant hitting five full shots with their driver. Participants were instructed to imagine they were standing on the tee, adopt a neutral stance position, and hit their usual driver shot as straight as possible. Two vertical lines placed on the net 0.5 m apart were used as an aiming guide and if any shot was not between the two lines, it was deemed ineligible and a further trial was collected. In the current study, only 4% of shots were repeated after being deemed ineligible.
Head, thorax and pelvis kinematics were calculated relative to a LCS created from the position of the heel markers at ball address (Horan et al., 2010). The origin of the LCS was the midpoint between the left and right heel markers. The y-axis was a vector oriented with the two heel markers. The LCS z-axis was coincidental with the global vertical and the LCS x-axis was the cross product of the plane formed between the LCS y- and z-axis. Lateral tilt, forward tilt, and axial rotation were defined as angular rotation about each segments x, y, and z axes respectively. As no two setup positions are exactly the same, a body-centric LCS has the potential to avoid offsets in the data compared to a global coordinate system as an LCS can adjust according to a golfers’ stance. 3D angular kinematics were determined using the Euler angle decomposition method. Speed of the head, thorax and pelvis were calculated as the square root of the squared sum of lateral tilt, forward tilt and axial rotation angular velocity. Calculation of angular velocity of the head, thorax and pelvis was performed using the Poisson equation, as described by Zatsiorsky (1998) and Craig (2005).
All data analyses were based on the downswing phase and performed using custom written software in Matlab version 7.8.0 (The MathWorks, Natick, MA). In this study the downswing phase was defined from the top of backswing, that is minimum pelvis axial rotation away from the target, to ball contact. Data for the downswing phase were normalised to 101 points for each individual using piecewise cubic spline interpolation, enabling swing data to be reported as 0-100% of the downswing cycle. Peak speeds and timing of the peak speeds during the downswing were calculated for the head, thorax and pelvis. Peak velocity and the timing of the peak velocity during the downswing were also calculated for forward tilt, lateral tilt, and axial rotation of the head, thorax and pelvis segments.
Cross-correlation analysis in accordance with the method outlined by Derrick & Thomas (2004) was used to examine inter-segment coupling between the continuous time-series signals of the head and thorax, and the thorax and pelvis. Intra-segment coupling was
determined by applying cross-correlation analysis between directions of movement for each segment. Cross-correlation analyses were applied to normalised downswing velocities where the strength of coupling, R2, and the phasing difference between velocity data were revealed. The resolution of phasing was one percent of the downswing and each cross-correlation performed was set to a maximum phasing difference (i.e. lag) of 50 samples to ensure at least half the data were overlapping. For the purposes of this study R2 values > 0.8 were defined as high, R2 values between 0.7-0.8 were defined as moderate and R2 values < 0.7 as low (Vincent, 2005). As cross-correlation coefficients are not normally distributed, R2 values for all trials were averaged by taking the Fisher Z-transformations of the absolute cross-correlation coefficient values (Derrick and Thomas, 2004). In this study, a positive phasing value for between-segment and within-segment correlations indicated the second named segment was leading the first named segment. Phasing was determined by taking the average of the time lags across the five captured swings.
Statistical Analyses
Amplitude and timing of peak velocity, and amplitude and timing of peak speed were examined using ANOVA (SPSS for Windows 17.0, SPSS, Chicago, Illinois), with significant main effects evaluated using Tukey’s HSD (Honestly Significant Difference) test. For the speed and velocity analyses, a between-segment and within-segment approach was adopted. Although Tukey’s HSD test is adjusted to account for multiple comparisons, the primary focus of this study was to compare either the same segment across different directions or between segments across the same direction. Therefore, only physiologically relevant pair-wise comparisons are reported. The level of significance was set at p < 0.05.
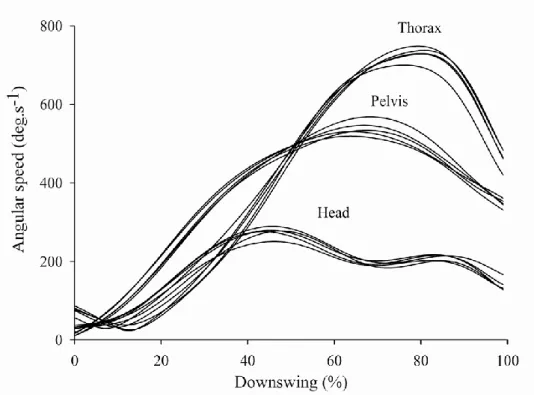
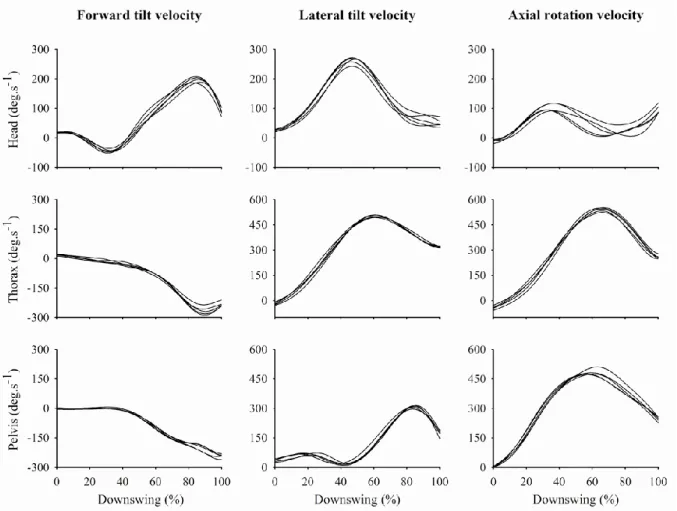
Average clubhead and ball speed for the professional golfers in this study was 50.1 2.1 m/s and 70.6 4.2 m/s (mean SD) respectively. Representative speed and velocity profiles for a single male professional golfer are presented in Figures 1 and 2, respectively. Peak speed was typically reached in the latter half of the downswing and was greatest for the thorax, followed by the pelvis and then the head. A notable feature of the velocity profiles was the similar patterns of thorax lateral tilt and axial rotation velocity, whereas, pelvis lateral tilt was approximately half the amplitude of pelvis axial rotation.
<<Insert Figures 1 and 2>>
Speed
The thorax had significantly greater peak speed than the pelvis (p < 0.001) and head (p < 0.001), and the pelvis had significantly greater peak speed than the head (p < 0.001) (Table 1). No significant differences were detected for the timing of peak speeds between segments. The strength of coupling for thorax-pelvis speed was high (Table 2). Strength of coupling was also high for thorax correlations, however, an additional feature of head-thorax correlations was the relatively large variability in correlation coefficients. The predominantly negative phasing for the head-thorax speed indicated that the head lead the thorax, while thorax-pelvis phasing indicated the pelvis predominantly lead the thorax during the downswing.
Velocity: between-segment analysis
Forward tilt peak velocity for the head was significantly greater than the pelvis (p < 0.001) and thorax (p < 0.001) (Table 1). Lateral tilt peak velocity was significantly greater for the thorax compared to the head (p < 0.001) and the thorax compared to the pelvis (p < 0.001). Axial rotation peak velocity was greater for the thorax compared to the head (p < 0.001) and the pelvis compared to the head (p < 0.001). Analysis of timing of peak velocities revealed that thorax forward tilt peak velocity occurred later in the downswing than head forward tilt peak velocity (p < 0.001). Head-thorax correlation coefficients were generally lower than the thorax-pelvis correlation coefficients (Table 2). High R2 values were observed for thorax-pelvis axial rotation. The phasing for head-thorax velocity were overall negative in each direction indicating head velocity lead thorax velocity. However, it should be noted that this phase relationship was variable between subjects as evidenced by high SD’s and the spread of negative, zero, and positive time lags. Similar to speed, thorax-pelvis velocity phasing for the axial rotation direction were predominately positive, indicating the pelvis was leading the thorax.
Velocity: within-segment analysis
Head peak velocity was significantly greater for lateral tilt than axial rotation (p = 0.021) (Table 1). Thorax peak velocity was greater for axial rotation than lateral tilt (p < 0.001) and forward tilt (p < 0.001), and thorax lateral tilt peak velocity was greater than thorax forward tilt peak velocity (p < 0.001). Pelvis peak velocity was greater for axial rotation than lateral tilt (p < 0.001) and forward tilt (p < 0.001), and pelvis lateral tilt peak velocity was greater than pelvis forward tilt peak velocity (p < 0.001). Analysis of timing of peak velocities revealed that thorax forward tilt peak velocity occurred later in the downswing cycle compared to thorax lateral tilt (p < 0.001) and thorax axial rotation peak
velocity (p < 0.001). Pelvis forward tilt peak velocity occurred later in the downswing cycle compared to pelvis lateral tilt (p = 0.013) and pelvis axial rotation peak velocity (p < 0.001), while pelvis lateral tilt peak velocity occurred later than pelvis axial rotation peak velocity (p < 0.001). Overall the head correlation coefficients were lower than the thorax and pelvis correlation coefficients for all within-segment couplings (Table 2). The number of positive R2 values was also generally mixed for the head indicating that a single movement strategy did not exist amongst professional golfers. The highest correlation coefficients were for axial rotation-lateral tilt velocity for both the thorax and the pelvis, indicating strong coupling relationships during the downswing. Thorax and pelvis phasing values were generally positive, indicating the second direction in the pair was leading the first. The thorax lateral tilt-axial rotation velocity pair, which had the highest R2 values, exhibited a predominately in phase relationship across all subjects presumably as a strategy to ensure high velocities.
Discussion and implications
The purpose of this study was to examine the relationship between head, thorax and pelvis motion during the downswing in professional golfers. Amplitude and timing of peak segment speed as well as the peak velocity for individual movement directions were investigated. Strength of coupling and phasing were also analyzed between-segments and within-segments with the aim of providing a greater understanding of control strategies utilized by professional golfers during the golf swing.
Examining the amplitude of peak velocity in conjunction with the amplitude of peak speed was able to highlight important differences between segments that may not have been revealed by examining speed or velocity in isolation. As was hypothesised the thorax exhibited the greatest speed of angular movement compared to the pelvis and head, which is in agreement with other studies that have examined segmental speeds in skilled golfers
(Evans et al., 2008; Neal et al., 2008; Tinmark et al., 2010). Interestingly, peak axial rotation velocities were not significantly different between the thorax and pelvis during the downswing. While peak pelvis axial rotation velocity in this study is similar to others (Lephart et al., 2007; Myers et al., 2008), the magnitude of thorax axial rotation velocity is considerably lower than previous investigations of similar level golfers (Myers et al., 2008). This discrepancy may in part be explained by differences in kinematic modelling, where previous studies have reported segment motion relative to a global plane and used indirect marker placements to model thorax motion. The indirect marker method is prone to overestimating thorax rotation (Wheat et al., 2007) and potentially contributed to the observed velocity discrepancies. The current study examined individual directions of motion and revealed that while axial rotation of the thorax segment is the highest contributor to thorax speed, lateral tilt also plays a key role in generating high overall angular speed of the thorax. An added benefit of partitioning the movement into directions is that multi-directional analyses of coupling can be performed, allowing for a greater understanding of the motor control strategies adopted for the complex task requirements of the golf swing.
A unique feature of the current study was that cross-correlation analyses were applied to continuous kinematic data to examine coordination, as opposed to solely examining the timing of upper body motion at discrete events during the downswing. The results of the between-segment analyses indicated that, in general, thorax-pelvis couplings were observed to be highest with head-thorax couplings noticeably lower. Of particular note, axial rotation coupling between the thorax and pelvis approached an R2 value of 1, indicating very strong congruence between the velocity profiles of both segments. These findings confirm the importance that previous researchers have attributed to the relationship between thorax and pelvis displacement using analyses such as thorax-pelvis separation angle, or X-Factor (Burden et al., 1998; Cheetham et al., 2001; Cole and Grimshaw, 2009; Myers et al., 2008).
However, high thorax-pelvis correlation coefficients for forward tilt and lateral tilt velocities suggest that researchers and coaches must not solely rely on axial rotation-based analyses if they are to fully appreciate the coordination required to perform the golf swing. It is also important to appreciate that the relatively low coupling between the head and thorax suggests that no single control strategy exists for skilled golfers. Previous investigations of head motion during the golf swing have reported that compared to unskilled golfers, skilled golfers exhibit greater translational motion of the head during both the backswing and downswing (Sanders and Owens, 1992). This in conjunction with our finding of lower coupling suggests that skilled golfers do not necessarily need to regulate head motion to the same extent as thorax motion. This should not be surprising considering that the head is not a segment within the links from the feet to the golf club, and therefore, can move independently without affecting club motion. Accordingly, golf coaches may need to provide instruction on the general pattern of head motion but remain flexible enough to permit different control strategies amongst their students.
It has long been suggested that implementing a control strategy where motion of the pelvis leads motion of the thorax during the downswing assists in optimising club head speed, yet this feature has only recently been studied quantitatively (Tinmark et al., 2010). While studies have reported between-segment timing of upper body motion during the downswing, some significantly different (Tinmark et al., 2010) and some not (Neal et al., 2008), the analyses in the current study did not detect timing differences between the pelvis and thorax. However, the within-segment analysis of coupling was able to reveal strategies that skilled golfers employ to potentially increase speed of the upper body during the downswing. The thorax and pelvis exhibited strong coupling between directions, particularly for the lateral tilt-axial rotation direction. This coordination strategy implies that skilled golfers place a greater importance on regulating the global motion of the thorax and pelvis rather than independently
regulating motion in each direction. This finding has important practical implications for golf coaches. Through practice, the CNS can modify a pattern of muscle activity in an effort to utilise the most effective and simple movement strategy (Carson and Riek, 2001). When instructing highly practised golfers, changes in technique may be difficult to maintain due to a reliance on a highly developed, simplified, and ingrained control strategy. Coaches should also recognise that due to a lack of practice and repetition, unskilled golfers may not have refined their control strategy and hence perform less fluid movements that are regulated according to direction. In the future it would be of considerable interest to determine whether the same coupling relationships observed for skilled golfers exist for unskilled golfers.
Conclusion
The present study confirmed that the thorax segment has the highest peak speeds and peak velocities for the upper body during the downswing of professional golfers. It was also apparent from the large contributions of lateral tilt velocity to total segment angular speed, that analyses of trunk dynamics should not be merely restricted to the axial rotation direction. Analyses of coupling revealed that very strong coupling relationships exist for the thorax and pelvis, but not so for the head and thorax. The relatively large variability in head and thorax coupling suggests that no single control strategy exists for skilled golfers, and that coaches may need to provide instruction on the general pattern of head motion but remain flexible enough to permit different control strategies. Furthermore, the strong coupling between the thorax and pelvis is presumably a method for simplifying the motor control strategies during the downswing, and a way of ensuring consistent motor patterns.
References
Adams, M., and Tomasi, T. J. (2001). The complete golf manual. Singapore: Carlton Books Ltd.
Bernstein, N. (1967). The coordination and regulation of movements. Oxford: Pergamon.
Bradshaw, E. J., Keogh, J. W., Hume, P. A., Maulder, P. S., Nortje, J., and Marnewick, M. (2009). The effect of biological movement variability on the performance of the golf swing in high- and low-handicapped players. Research Quarterly for Exercise and Sport, 80, 185-196.
Burden, A. M., Grimshaw, P. N., and Wallace, E. S. (1998). Hip and shoulder rotations during the golf swing of sub-10 handicap players. Journal of Sports Science, 16, 165-176.
Carson, R. G., and Riek, S. (2001). Changes in muscle recruitment patterns during skill acquisition. Experimental Brain Research, 138, 71-87.
Cheetham, P. J., Martin, P. E., Mottram, R. E., and St. Laurent, B. F. (2001). The importance of stretching the 'X-Factor' in the downswing of golf: 'The X-Factor stretch'. In P. R. Thomas (Ed.), Optimising Performance in Golf (pp. 192-199). Brisbane: Australian Academic Press.
Cole, M. H., and Grimshaw, P. N. (2009). The x-factor and its relationship to golfing performance. Journal of Quantitative Analysis in Sports, 5, 1-19.
Craig, J. J. (2005). Introduction to robotics: Mechanics and control (3rd ed.). Upper Saddle River, NJ: Pearson Prentice Hall.
Derrick, T. R., and Thomas, J. M. (2004). Time series analysis: The cross-correlation function. In N. Stergiou (Ed.), Innovative Analyses of Human Movement (pp. 189-205). Champaign, IL: Human Kinetics.
Evans, K., Refshauge, K., Adams, R., and Barrett, R. (2008). Swing kinematics in skilled male golfers following putting practice. Journal of Orthopaedic & Sports Physical Therapy, 38, 425-433.
Fradkin, A. J., Sherman, C. A., and Finch, C. F. (2004). Improving golf performance with a warm up conditioning programme. British Journal of Sports Medicine, 38, 762-765.
Giakas, G., and Baltzopoulos, V. (1997). A comparison of automatic filtering techniques applied to biomechanical walking data. Journal of Biomechanics, 30, 847-850.
Horan, S. A., Evans, K., and Kavanagh, J. J. (2011). Movement variability in the golf swing of male and female skilled golfers. Medicine & Science in Sports & Exercise, 43, 1474-1483.
Horan, S. A., Evans, K., Morris, N. R., and Kavanagh, J. J. (2010). Thorax and pelvis kinematics during the downswing of male and female skilled golfers. Journal of Biomechanics, 43, 1456-1462.
Lephart, S. M., Smoliga, J. M., Myers, J. B., Sell, T. C., and Tsai, Y. S. (2007). An eight-week golf-specific exercise program improves physical characteristics, swing mechanics, and golf performance in recreational golfers. Journal of Strength and Conditioning Research, 21, 860-869.
Lindsay, D. M., Horton, J. F., and Paley, R. D. (2002). Trunk motion of male professional golfers using two different golf clubs. Journal of Applied Biomechanics, 18, 366-373.
Myers, J., Lephart, S., Tsai, Y.-S., Sell, T., Smoliga, J., and Jolly, J. (2008). The role of upper torso and pelvis rotation in driving performance during the golf swing. Journal of Sports Sciences, 26, 181-188.
Neal, R. J., Lumsden, R. G., Holland, M., and Mason, B. (2008). Segment interactions: sequencing and timing in the downswing. In D. Crews and R. Lutz (Eds.), Science and Golf V: Proceedings of the World Scientific Congress of Golf (pp. 21-29). Mesa, AZ: Energy in Motion Inc.
Sanders, R. H., and Owens, P. C. (1992). Hub movement during the swing of elite and novice golfers. International Journal of Sport Biomechanics, 8, 320-330.
Shemmell, J., Tresilian, J. R., Riek, S., Barry, B. K., and Carson, R. G. (2005). Neuromuscular adaptation during skill acquisition on a two degree-of-freedom target-acquisition task: Dynamic movement. Journal of Neurophysiology, 94, 3058-3068.
Tinmark, F., Hellström, J., Halvorsen, K., and Thorstensson, A. (2010). Elite golfers' kinematic sequence in full-swing and partial-swing shots. Sports Biomechanics, 9, 236-244.
Vincent, W. J. (2005). Statistics in kinesiology (3rd ed.). Champaign, IL: Human Kinetics.
Wheat, J. S., Vernon, T., and Milner, C. E. (2007). The measurement of upper body alignment in the golf drive. Journal of Sports Sciences, 25, 749-755.
Wiren, G. (1997). The PGA manual of golf: The professional way to play better golf. New York: Macmillan.
Zheng, N., Barrentine, S. W., Fleisig, G. S., and Andrews, J. R. (2008). Kinematic analysis of swing in pro and amateur golfers. International Journal of Sports Medicine, 29, 487-493.
Figure Captions
Figure 1. Representative head, thorax and pelvis speed for five trials of a male professional golfer using a driver. The speeds from the five trials are expressed relative to the downswing.
Figure 2. Angular velocity of the head, thorax and pelvis for a representative male professional golfer using a driver. Five trials are presented for forward tilt, lateral tilt and axial rotation, with each segment expressed relative to the downswing.
Table 1. Amplitude of peak speed and peak velocity for each segment and direction with respect to the timing of peaks within the downswing.
Peak Speed (deg/s) Percent of Downswing Direction Peak Velocity (deg/s) Percent of Downswing
Head 210 ± 56 79 ± 19 Forward tilt 115 ± 65 2,3 82 ± 11
Lateral tilt 156 ± 57 a 67 ± 23
Axial rotation 67 ± 114 77 ± 19
Thorax 650 ± 60 1,3
83 ± 9 Forward tilt -197 ± 29 95 ± 5 1,a,b Lateral tilt 406 ± 50 1,3,c 78 ± 12 Axial rotation 491 ± 54 1,b,c 77 ± 12
Pelvis 507 ± 52 1
76 ± 5 Forward tilt -177 ± 36 89 ± 8 a,c
Lateral tilt 188 ± 52 c 81 ± 6 a Axial rotation 464 ± 46 1,b,c 71 ± 6
Between-segment: 1 significantly different from head, 2 significantly different from thorax, 3 significantly different from pelvis
Within-segment: a significantly different from axial rotation, b significantly different from lateral tilt, c significantly different from forward tilt
Table 2. Maximum cross-correlation coefficients (R2) and phasing for between-segment and within-segment analyses.
Max R2 Positive R2 Phasing -:0:+
Speed: between-segment coupling
Head-thorax Speed 0.83 ± 0.17 100% -6 ± 8 55:45:0
Thorax-pelvis Speed 0.99 ± 0.01 100% 3 ± 3 0:28:72
Velocity: between-segment coupling
Head-thorax Forward tilt 0.78 ± 0.14 29% -4 ± 7 59:36:5
Lateral tilt 0.86 ± 0.13 100% -12 ± 11 67:29:4
Axial rotation 0.65 ± 0.19 57% -10 ± 19 64:17:19
Thorax-pelvis Forward tilt 0.87 ± 0.14 100% 2 ± 7 0:75:25
Lateral tilt 0.91 ± 0.10 100% -2 ± 3 50:36:14
Axial Rotation 0.98 ± 0.01 100% 4 ± 5 2:8:90
Velocity: within-segment coupling
Head Forward tilt-lateral tilt 0.70 ± 0.12 89% 23 ± 15 8:15:77
Forward tilt-axial rotation 0.63 ± 0.15 53% 15 ± 14 14:0:86
Lateral tilt-axial rotation 0.63 ± 0.21 70% -3 ± 13 38:29:33
Thorax Forward tilt-lateral tilt 0.79 ± 0.11 0% 5 ± 7 0:50:50
Forward tilt-axial rotation 0.80 ± 0.11 0% 7 ± 8 0:36:64
Lateral tilt-axial rotation 0.98 ± 0.05 100% 0 ± 3 4:92:4
Pelvis Forward tilt-lateral tilt 0.86 ± 0.11 0% 3 ± 7 21:35:44
Forward tilt-axial rotation 0.85 ± 0.11 0% 9 ± 6 0:9:91
Lateral tilt-axial rotation 0.91 ± 0.08 100% 5 ± 4 5:8:87
Positive R2 represent the percentage of subjects with maximum R2 values that were positive. A positive phasing value for between-segment and within-segment correlations indicated the second named segment was leading the first named segment. -:0:+ represents the percentage of trials that exhibited either negative, zero, or positive phasing values respectively.