Health Sciences Papers and Journal Articles
School of Health Sciences
2016
Multi-segment trunk models used to investigate the crunch factor in golf and their
relationship with selected swing and launch parameters
Christopher Joyce
University of Notre Dame Australia, [email protected]
Follow this and additional works at:http://researchonline.nd.edu.au/health_article Part of theMedicine and Health Sciences Commons
This article was originally published as:
Joyce, C. (2016). Multi-segment trunk models used to investigate the crunch factor in golf and their relationship with selected swing and launch parameters.Journal of Sports Sciences,.
http://doi.org/http://dx.doi.org/10.1080/02640414.2016.1149600 Original article available here:
http://www.tandfonline.com/doi/full/10.1080/02640414.2016.1149600
This article is posted on ResearchOnline@ND at
http://researchonline.nd.edu.au/health_article/144. For more information, please [email protected].
For Peer Review Only
Multi-segment trunk models used to investigate the crunch factor in golf and their relationship with selected swing and
launch parameters
Journal: Journal of Sports Sciences
Manuscript ID RJSP-2015-0058.R2 Manuscript Type: Original Manuscript
Keywords: golf, crunch factor, clubhead speed
For Peer Review Only
Multi-segment trunk models used to investigate the crunch factor in golf
1and their relationship with selected swing and launch parameters
23
4
5
Running Title: 3D crunch factor and golf performance
6
Key Words: golf, 3D, crunch factor, clubhead velocity, launch angle
7
Word Count: 3741 (not including references)
8
Author Contact: [email protected] [+61 (8) 94330224]
9 3 4 5 6 7 8 9 10 11 12 13 14 15 16 17 18 19 20 21 22 23 24 25 26 27 28 29 30 31 32 33 34 35 36 37 38 39 40 41 42 43 44 45 46 47 48 49 50 51 52 53 54 55 56 57
For Peer Review Only
Abstract 10
The use of multi-segment trunk models to investigate the crunch factor in golf may be 11
warranted. The first aim of the study was to investigate the relationship between the trunk and 12
lower trunk for crunch factor related variables (trunk lateral bending and trunk axial rotation 13
velocity). The second aim was to determine the level of association between crunch factor 14
related variables with swing (clubhead velocity) and launch (launch angle). Thirty five high 15
level amateur male golfers (Mean ± SD: age = 23.8 ± 2.1 years, registered golfing handicap = 16
5 ± 1.9) without low back pain had kinematic data collected from their golf swing using a 10-17
camera motion analysis system operating at 500 Hz. Clubhead velocity and launch angle 18
were collected using a validated real-time launch monitor. A positive relationship was found 19
between the trunk and lower trunk for axial rotation velocity (r(35) = .47, p< .01). Cross-20
correlation analysis revealed a strong coupling relationship for the crunch factor (R2 = 0.98) 21
between the trunk and lower trunk. Using generalised linear model analysis, it was evident 22
that faster clubhead velocities and lower launch angles of the golf ball were related to 23
reduced lateral bending of the lower trunk. 24 3 4 5 6 7 8 9 10 11 12 13 14 15 16 17 18 19 20 21 22 23 24 25 26 27 28 29 30 31 32 33 34 35 36 37 38 39 40 41 42 43 44 45 46 47 48 49 50 51 52 53 54 55 56 57
For Peer Review Only
Introduction 25
Today’s high level golfers focus on distance when hitting a driver from the tee (Gluck et al., 26
2007). This has seen a change from a ‘classic’ to a ‘modern’ golf swing, where greater axial 27
rotation of the shoulders relative to the hips (also known as X-factor) is seen at the top of the 28
backswing (Cheetham et al., 2001; McHardy et al., 2006; Gluck et al., 2007). It would seem 29
logical that an increased X-factor at the top of the backswing, will lead to increased axial 30
rotation velocity of the trunk, which will in turn, lead to greater clubhead velocity at ball 31
impact (McLean, 1994; McHardy et al., 2006; Chu et al., 2010). Further, at the point of ball 32
impact, an increase in lateral bending of a line connecting the shoulders relative to the pelvis 33
(i.e. the trunk) on the trailing side is thought to increase the force applied behind the ball 34
(Gluck et al., 2007; Chu et al., 2010). The product of lateral bending and axial rotation 35
velocity is termed the ‘crunch factor’ (Gluck et al., 2007), and it is believed that this variable 36
is maximised around ball impact and the early stages of follow through (Morgan et al., 1997; 37
Sugaya et al., 1999). It could be argued that the crunch factor may have implications for both 38
performance enhancement and the causation of low back pain. 39
40
Investigations have reported dissimilar findings on the relationship between crunch factor and 41
low back pain (Sugaya et al., 1999; Lindsay & Horton, 2002; Glazier, 2010; Cole & 42
Grimshaw, 2014) as well as the magnitude of the X-factor and clubhead velocity (Lephart et 43
al., 2007; Chu et al., 2010). These inconsistent findings may be due to different methods 44
being employed to quantify trunk movement. For example, some studies have used angles 45
determined in the transverse plane (e.g. Chu et al., 2010) whereas other studies have utilised 46
Cardan angles (Joyce et al., 2013; Kwon et al., 2013). The latter method is more anatomically 47
and technically correct when analysing mechanics of the lower back, and this may make the 48
measurement of the crunch factor more anatomically meaningful (Morgan et al., 1997; Cole 49 3 4 5 6 7 8 9 10 11 12 13 14 15 16 17 18 19 20 21 22 23 24 25 26 27 28 29 30 31 32 33 34 35 36 37 38 39 40 41 42 43 44 45 46 47 48 49 50 51 52 53 54 55 56 57
For Peer Review Only
& Grimshaw, 2014). Furthermore, when examining lower back movement, the trunk should 50
be modelled with multiple segments (trunk and lower trunk) rather than a single segment due 51
to the varying kinematics of these segments. This may also avoid ambiguous measures of the 52
crunch factor (Joyce et al., 2010; Kwon et al., 2013; Cole & Grimshaw, 2014). The 53
interaction of multiple trunk segments, including proximal to distal segment sequencing has 54
been shown to be important in producing clubhead velocity (Tinmark et al., 2010; Horan & 55
Kavanagh, 2012). Using cross-correlation analyses it has been found that strong ‘coupling’, 56
or relationships exists between the torso and pelvis segments in the golf swing (Horan et al., 57
2012). However, the consideration of multiple trunk segments when analysing the crunch 58
factor has not previously been investigated. It is also unknown if a between-segment 59
relationship exists for crunch factor variables, i.e. is axial rotation velocity of the trunk 60
related to that of the lower trunk. 61
62
Investigations into the crunch factor have predominantly focused on its association with low 63
back pain (Hosea & Gatt, 1996; Cole & Grimshaw; 2008). However, the effect of crunch 64
factor on swing (clubhead velocity) and launch (launch angle of the ball) parameters have yet 65
to be investigated. It was previously suggested that an increase in lateral bending of the 66
trailing side results in more force being applied into the ball at impact (Gluck et al., 2007). 67
However, despite experimental investigations using projected angles in the transverse plane 68
reporting an association between X-factor, axial rotation velocity and clubhead velocity 69
(Lephart et al., 2007; Chu et al., 2010), none have shown a positive association between 70
increased lateral bending of the trailing side with clubhead velocity (Chu et al., 2010; Joyce 71
et al., 2013). It has also been disputed anecdotally that an increase in lateral bending of the 72
trailing side will facilitate ‘hitting-up’ on the ball, promoting higher launch angles (Foley, 73
2012). While it has been reported that although lateral bending of the trunk’s trailing side 74 3 4 5 6 7 8 9 10 11 12 13 14 15 16 17 18 19 20 21 22 23 24 25 26 27 28 29 30 31 32 33 34 35 36 37 38 39 40 41 42 43 44 45 46 47 48 49 50 51 52 53 54 55 56 57
For Peer Review Only
helps to increase the upward path of the clubhead towards impact, excessive trunk lateral 75
bending will restrict trunk rotation velocity and thus, reduce the magnitude of the crunch 76
factor (Chu et al., 2010). However, the effect of crunch factor in isolation on launch angle of 77
the golf ball has not previously been investigated. 78
79
The first aim of the study was to investigate the relationship between the trunk and lower 80
trunk for axial rotation velocity and lateral bending (crunch factor variables). The 81
coordination between the trunk and lower trunk segments was also examined. The second 82
aim of the study was to determine the level of association between axial rotation velocity and 83
lateral bending of the trunk and lower trunk with swing (clubhead velocity) and launch 84
(launch angle) parameters. These aims were investigated in a group of high level amateur 85
male golfers using their own driver. 86
87
Methods 88
Participants & Experimental Protocol 89
Thirty five high level amateur male golfers (Mean ± SD: age = 23.8 ± 2.1 years, registered 90
golfing handicap = 5 ± 1.9) were recruited for this study. Each participant was given a 91
modified Nordic Low Back Pain questionnaire (Kuorinka et al., 1987) to confirm an absence 92
of back pain within the last 12 months. All participants utilised a ‘modern’ rather than a 93
‘classic’ swing (Gluck et al., 2007) and this was confirmed via a qualitative video analysis of 94
each participant’s swing. This analysis was performed independently by two Australian 95
Professional Golfers Association teaching professionals. Presence of factors associated with a 96
classic golf swing, i.e. heel raise and pelvic movement, resulted in exclusion from the study. 97
On the basis of these criteria five of the originally screened 40 participants were excluded. 98 99 3 4 5 6 7 8 9 10 11 12 13 14 15 16 17 18 19 20 21 22 23 24 25 26 27 28 29 30 31 32 33 34 35 36 37 38 39 40 41 42 43 44 45 46 47 48 49 50 51 52 53 54 55 56 57
For Peer Review Only
The experimental protocol of this study involved each participant hitting five shots with their 100
own driver using the same leading brand of golf ball. During testing, participants wore 101
bicycle shorts, their own golf glove and golf shoes, and hit off a tee positioned on an artificial 102
turf surface into a net positioned five metres in front of the hitting area. This study was 103
undertaken in an indoor biomechanics laboratory. Ethical approval to conduct the study was 104
provided by the Institutional Human Research Ethics Committee. 105
106
Data Collection 107
A 10-camera MX-F20 Vicon-Peak Motion Analysis System (Oxford Metrics, Oxford, UK) 108
operating at 500 Hz was used to capture 3D coordinates from retro-reflective markers during 109
the golf swing. A previously validated multi-segment trunk model (Joyce et al., 2010) was 110
used to create three anatomical reference frames for the trunk, lower trunk and pelvis (Table 111
I). The top of the backswing was defined as the frame where the two club markers changed 112
direction to initiate the downswing (Lephart et al., 2007). A small piece of retro-reflective 113
tape attached to the golf ball was used to identify ball impact. Ball impact was defined as the 114
frame immediately before the ball was first seen to move after contact with the driver (Joyce 115
et al., 2013). A validated real-time launch monitor (PureLaunch™, Zelocity, USA) was 116
positioned at a distance of 3m adjacent to the participant’s target line to determine clubhead 117
velocity and launch angle at ball impact (Joyce et al., 2014). 118
119
**INSERT TABLE I ABOUT HERE** 120
121
Data Analysis 122
From the five trials recorded for each driver, the trials with the fastest and slowest clubhead
123
velocity were removed, and the remaining three trials were averaged, assuming that there
124 3 4 5 6 7 8 9 10 11 12 13 14 15 16 17 18 19 20 21 22 23 24 25 26 27 28 29 30 31 32 33 34 35 36 37 38 39 40 41 42 43 44 45 46 47 48 49 50 51 52 53 54 55 56 57
For Peer Review Only
was; minimal retro-reflective marker drop out, the ball landed within a predicted 37 m wide 125
fairway (from the launch monitor), and where the participant felt that improper contact had 126
been made were analysed. All kinematic trials were smoothed using a Woltring filter with a 127
mean square error of 20mm² (Woltring, 1986). 128
129
The multi-segment model used in this study was developed using Vicon BodyBuilder V.3.6.1 130
(Oxford, UK) and used in Vicon Nexus V.1.7.1 (Oxford, UK) to obtain all kinematic 131
variables (as described below). Cardan angles reported for the trunk were reduced from the 132
joint coordinate system of the shoulders relative to the joint coordinate system of the pelvis, 133
and lower trunk Cardan angles reduced from the joint coordinate system of the lower thorax 134
relative to the joint coordinate system of the pelvis (i.e. 0,0,0 indicates the shoulder or lower 135
thorax reference frame is relative to the pelvis reference frame). In order to calculate the 136
rotations relative to the pelvis, cardan angles for each segment were reported using a ZYX 137
(lateral bending, flexion / extension, axial rotation) order of rotation, followed by derivation 138
of axial rotation velocity using finite difference calculations. With previous research (Morgan 139
et al., 1997) and pilot work in this study indicating that the crunch factor is maximised at ball 140
impact, all kinematic variables (and launch monitor variables) were determined at this point. 141
Eight kinematic variables relating to the trunk and lower trunk segments, in addition to two 142
variables collected from the launch monitor (clubhead velocity and launch angle), were 143
analysed in this study (see Table II). Ensemble averages for the crunch factor determined for 144
the trunk and lower trunk from the top of the backswing to ball impact were created. All data 145
were time normalised (0-100%) using cubic spline interpolation. 146
147
Cross-correlation analysis was used to investigate the coordination between the trunk and 148
lower trunk segments for the crunch factor variable. Specifically, the lag, or phase difference 149 3 4 5 6 7 8 9 10 11 12 13 14 15 16 17 18 19 20 21 22 23 24 25 26 27 28 29 30 31 32 33 34 35 36 37 38 39 40 41 42 43 44 45 46 47 48 49 50 51 52 53 54 55 56 57
For Peer Review Only
between the two wave forms was examined (from the data shown in Figure I). A maximum 150
phase difference of 50 samples was examined to ensure at least half the data were 151
overlapping (101 time-normalised downswing data points). As the magnitude of the crunch 152
factor for the trunk and lower trunk differed, a normalised cross-correlation coefficient was 153
obtained (-1 to 1) (Derrick & Thomas, 2004). For R2 values > 0.8 these were defined as high, 154
0.7 – 0.8 moderate, and < 0.7 low (Vincent, 2005). As cross-correlation values are not 155
normally distributed, a Fisher Z-transformation of the normalised cross-correlation coefficient 156
was performed (Derrick & Thomas, 2004). 157
158
Statistical Analysis 159
All statistical analyses were performed using SPSS V22.0 for Windows (IBM Co., NY, 160
USA). The average of three trials were used for each variable for each participant, with 161
intraclass correlation coefficients [ICC (3,1)] and standard error of mean (SEM) statistics 162
used to determine within-trial reliability of all variables listed in Table II. All data were 163
screened to assess normality, and 95% confidence intervals for crunch factor and launch 164
monitor variables are reported. Bivariate Pearson Product-Moment Correlation analyses were 165
performed to investigate relationships for all kinematic variables between the trunk and lower 166
trunk. Pearson correlation coefficient values between 0.2 and 0.4 were considered as weak 167
associations, values between 0.4 and 0.7 were considered as moderate and values above 0.7 168
as strong (Johnson, 2000). 169
170
Two generalised linear models (GLM) were used to determine which kinematic variables 171
were associated with clubhead velocity and launch angle. All eight variables were entered 172
into each model then non-significant variables were removed one at a time until only 173
significant variables remained in the final model. The GLM was not used for the first aim, as 174 3 4 5 6 7 8 9 10 11 12 13 14 15 16 17 18 19 20 21 22 23 24 25 26 27 28 29 30 31 32 33 34 35 36 37 38 39 40 41 42 43 44 45 46 47 48 49 50 51 52 53 54 55 56 57
For Peer Review Only
multicolinearity of the kinematic variables; crunch factor, lateral bending and axial rotation 175
velocity would cause the information matrix to become ill-conditioned and cause difficulty 176
with the reliability of the estimates of the model parameters, e.g. inflated standard errors 177 (Alin, 2010). 178 179 Results 180
Kinematic variables with 95% confidence intervals are described in Table II. Figure I shows 181
the ensemble average of crunch factor for both the trunk and lower trunk segments from top 182
of backswing to ball impact. This figure shows that the crunch factor of the trunk (and 183
shoulder) movement is of a higher magnitude in the latter part of the downswing, than that of 184
the lower trunk. Maximum crunch factor was found to occur 0.032 s (± 0.045 s) and 0.015 s
185
(± 0.070 s) after ball impact for the trunk and lower trunk, respectively. Pearson correlation 186
analysis revealed a moderate and positive relationship for axial rotation velocity (r(35) = .47, 187
p< .01) between the trunk and lower trunk although, no correlation was reported for lateral 188
bending (r(35) = .14, p > .05) and thus, crunch factor (r(35) = .12, p > .05). Cross-correlation 189
analysis of crunch factor between the trunk and lower trunk revealed a high normalised R2
190
value of 0.98 (2.27 Fisher Z-score). It was also reported that no lag (phase difference) was 191
present for crunch factor between the trunk and lower trunk. 192
193
**INSERT TABLE II ABOUT HERE** 194
195
The two GLMs are shown in Table III. The GLM for clubhead velocity reported trunk crunch
196
factor (p< .01), lower trunk axial rotation (p<.01), lower trunk axial rotation velocity (p< .05)
197
and lower trunk crunch factor (p< .05) as a significantly associated variables (p<.05) with
198
faster clubhead velocity, b = .00, t(35) = 22.23, p< .01, b = .16, t(35) = 6.68, p< .01, b = -.02,
199 3 4 5 6 7 8 9 10 11 12 13 14 15 16 17 18 19 20 21 22 23 24 25 26 27 28 29 30 31 32 33 34 35 36 37 38 39 40 41 42 43 44 45 46 47 48 49 50 51 52 53 54 55 56 57
For Peer Review Only
t(35) = 4.61, p< .05, and b = -.00, t(35) = 6.41, p< .05, respectively. The GLM for clubhead 200
velocity can be described by the following equation: 201
202
Clubhead velocity (predicted) = intercept + Trunk crunch factor ̅ (0.001) + Lower trunk
203
axial rotation ̅ (0.163) + Lower trunk axial rotation velocity ̅ (-0.017) + Lower trunk
204
crunch factor ̅ (-0.001)
205
206
The model estimates and statistics are depicted in Table III. By interchanging estimates into 207
the equation, predicted clubhead velocity can be determined for any individual, dependent 208
upon the four associated variables. For example, for an individual with a trunk crunch factor
209
of 9486.0 deg2/s, a lower trunk axial rotation of 13.6º, a lower trunk axial rotation velocity of
210
123.9 deg/s and a lower trunk crunch factor of 1002.2 deg2/s, would have a predicted 211
clubhead velocity of 51.9 m/s. The GLM for launch angle resulted in trunk axial rotation (p< 212
.01) and lower trunk lateral bending (p < .05) as being significantly associated with clubhead 213
velocity, b = -.19, t(35) = 31.39, p< .01 and b = -.13, t(35) = 5.69, p< .05, respectively. The 214
model found that as trunk axial rotation and lower truck lateral bending increased, the launch 215
angle decreased. The final model for launch angle can be described by the following 216
equation: 217
218
Launch angle (predicted) = intercept + Trunk axial rotation ̅ (-0.189) + Lower trunk
219
lateral bending ̅ (-0.130)
220
221
The model estimates and statistics are depicted in Table III. By interchanging estimates into 222
the equation, predicted launch angle can be determined for any individual dependent upon 223
trunk axial rotation and lower trunk lateral bending. For example, for an individual with a 224 3 4 5 6 7 8 9 10 11 12 13 14 15 16 17 18 19 20 21 22 23 24 25 26 27 28 29 30 31 32 33 34 35 36 37 38 39 40 41 42 43 44 45 46 47 48 49 50 51 52 53 54 55 56 57
For Peer Review Only
trunk axial rotation of 24.9º and a lower trunk lateral bending of 8.5º, would have a predicted 225
launch angle of 8.0º. 226
227
**INSERT TABLE III ABOUT HERE** 228
229
Discussion 230
Dissimilar findings on the relationship between crunch factor and low back pain (Sugaya et 231
al., 1999; Lindsay & Horton, 2002; Glazier, 2010; Cole & Grimshaw, 2014) may possibly be 232
due to the use of ambiguous three dimensional methods. The use of multi-segment trunk 233
models which have been used to further understand segment interaction when producing 234
clubhead velocity (Tinmark et al., 2010; Horan & Kavanagh, 2012; Joyce et al., 2013), may 235
make crunch factor more anatomically meaningful (Morgan et al., 1997; Cole & Grimshaw, 236
2014). 237
238
The first aim of the study was to investigate the relationship for crunch factor between the 239
trunk and lower trunk. Pearson correlation analysis revealed a moderate and positive 240
relationship for axial rotation velocity between the trunk and lower trunk although, no 241
correlation was reported for lateral bending and thus, crunch factor. This agrees with previous 242
experimental research that lateral bending is probably not as important as axial rotation 243
velocity when maximising clubhead speed (Chu et al., 2010; Joyce et al., 2013). This would 244
then suggest that during the downswing, faster axial rotation of the lower trunk transfers to 245
the trunk through the summation of segments seen in the golf swing (Tinmark et al., 2010; 246
Horan & Kavanagh, 2012). Figure I shows the interaction between the trunk and lower trunk 247
for crunch factor during the downswing from the top of the backswing to ball impact. 248 249 3 4 5 6 7 8 9 10 11 12 13 14 15 16 17 18 19 20 21 22 23 24 25 26 27 28 29 30 31 32 33 34 35 36 37 38 39 40 41 42 43 44 45 46 47 48 49 50 51 52 53 54 55 56 57
For Peer Review Only
The use of cross-correlation analysis revealed a high correlation for crunch factor wave forms 250
between the trunk and lower trunk, with no lag or, phase difference being evident. The 251
instance of maximum crunch factor was in agreement with previous research with this 252
variable being maximised just after ball impact for both the trunk and lower trunk segments 253
(Morgan et al., 1997; Sugaya et al., 1999). However, both axial rotation velocity and lateral 254
bending of the trunk at ball impact were larger than that of the lower trunk which suggests the 255
trunk segment is more active during the downswing. This is also supported by the steepness 256
of the ensemble average curve for the trunk (Figure I). This slope links with the cross-257
correlation findings for segment-coupling reported by Horan & Kavanagh (2012) where, the 258
thorax-pelvis coupling reports a strong R2 value, and the motion of the thorax during the 259
downswing assists in producing clubhead speed at ball impact. 260
261
**INSERT FIGURE I ABOUT HERE** 262
263
The second aim of the study was to investigate the effect of crunch factor variables on swing 264
(clubhead velocity) and launch (launch angle) parameters. Firstly, for clubhead velocity the
265
GLM showed that significant associations with trunk crunch factor (p< .01), lower trunk axial
266
rotation (p< .01), lower trunk axial rotation velocity (p< .05), and lower trunk crunch factor
267
(p< .05) were evident. Positive beta coefficients for trunk crunch factor and lower trunk axial
268
rotation indicated that to increase clubhead velocity, these values are increased. Trunk crunch
269
factor had the largest F–value of the four variables (22.23), indicating the strongest
270
association with clubhead speed. The methods used in this study therefore suggest that
271
increased crunch factor produces faster clubhead speeds, similar to that of the X-factor
272
(Lephart et al., 2007; Chu et al., 2010). Despite previous research suggesting low back pain is
273
associated with crunch factor (Hosea & Gatt, 1996; Cole & Grimshaw; 2008), no research
274 3 4 5 6 7 8 9 10 11 12 13 14 15 16 17 18 19 20 21 22 23 24 25 26 27 28 29 30 31 32 33 34 35 36 37 38 39 40 41 42 43 44 45 46 47 48 49 50 51 52 53 54 55 56 57
For Peer Review Only
has investigated crunch factor from a performance perspective. Negative beta coefficients for
275
lower trunk axial rotation velocity and lower trunk crunch factor indicate that to increase
276
clubhead velocity, these values are decreased. It would suggest that lower trunk crunch factor
277
variables (crunch factor itself and axial rotation velocity) are not important in producing
278
faster clubhead velocities. This supports the data and findings related to Figure I, that the
279
trunk segment is more active in the downswing. These findings also support the kinematics
280
which are seen in the modern golf swing, which was previously described as greater shoulder
281
turn, and reduced hip movement at the top of the backswing (Gluck et al., 2007).
282
283
For launch angle, the GLM reported significant associations with trunk axial rotation (p< .01)
284
and lower trunk lateral bending (p< .05). Beta coefficients for both these variables were
285
negative, indicating a reduced axial rotation of the trunk as well as lower trunk lateral
286
bending resulted in an increased launch angle. Negative correlations for trunk axial rotation
287
and driver clubhead velocity have previously been reported at ball impact (Kwon et al.,
288
2013), possibly to return the body and clubhead to a position required for straight driver
289
shots. This is also supported by Hume et al. (2005), who stated in their narrative review that
290
at ball impact, hip rotation is greater than shoulder rotation. This also supports the finding
291
from the GLM for clubhead velocity where lower trunk axial rotation had a positive beta
292
coefficient. With reduced lower trunk lateral bending shown to increase launch angle, this
293
was found both anecdotally, where ‘hitting-up’ on the ball was reported not to produce higher
294
launch angles (however, lateral bending of the trunk was not reported in the GLM) (Foley,
295
2012), and experimentally, where excessive lateral bending restricts rotation velocity and
296
thus, the magnitude of crunch factor (Chu et al., 2010). Interestingly, lower trunk crunch
297
factor was found to be negatively associated with faster clubhead velocities, and may support
298
the previous finding for the launch angle GLM. With respect to both GLMs, the optimal 299 3 4 5 6 7 8 9 10 11 12 13 14 15 16 17 18 19 20 21 22 23 24 25 26 27 28 29 30 31 32 33 34 35 36 37 38 39 40 41 42 43 44 45 46 47 48 49 50 51 52 53 54 55 56 57
For Peer Review Only
launch conditions for highly skilled golfers report that faster clubhead velocities are 300
associated with lower launch angles when optimising distance (Wallace et al., 2007; Wishon, 301
2013). The crunch factor variables reported by each GLM would support body positioning at 302
ball impact to produce these optimal launch conditions. 303
304
Previous authors have reported excessive spinal loading and the potential for injury at ball 305
impact where, trunk lateral bending coupled with fast trunk axial rotation velocity are 306
required to produce faster clubhead velocity (Gluck et al., 2007; Sato et al., 2013). It is 307
important to note that the golfers who participated in this study all reported no incidence of 308
low back pain within the last 12 months. Based on the variables selected for both GLMs, this 309
could suggest that the golfers in this study avoid crunch factor related low back injury by 310
minimising the amount of lateral bending at ball impact, so that trunk and lower trunk 311
segment axial rotation and axial rotation velocity are not restricted during the downswing and 312
maximise clubhead velocity (Chu et al., 2010). It has been found that low level amateur 313
golfers (who display high variability in their golf swings) exhibit 80 % greater peak lateral 314
bending of the trunk, leading to increased shear loads on the lower back, than that of 315
professionals (Hosea & Gatt, 1996; Metz, 1999). This could explain why lateral bending was 316
not shown to be important for both aims of this study, based on the cohort used. 317
318
A limitation of the study was the use of only kinematic variables related to crunch factor 319
when explaining swing (clubhead velocity) and launch (launch angle) parameters in the 320
GLMs. Despite crunch factor variables showing significant associations for both clubhead 321
velocity and launch angle models, the addition of other kinematic variables (e.g. wrist 322
kinematics) may have given further explanation of the summation of segments in producing 323
each parameter (Chu et al., 2010; Tinmark et al., 2010; Horan & Kavanagh, 2012). Another 324 3 4 5 6 7 8 9 10 11 12 13 14 15 16 17 18 19 20 21 22 23 24 25 26 27 28 29 30 31 32 33 34 35 36 37 38 39 40 41 42 43 44 45 46 47 48 49 50 51 52 53 54 55 56 57
For Peer Review Only
limitation was that while the 3D methods used were more anatomically meaningful than that 325
of reporting plane-projected angles, the use of acromion markers does not lead to the 326
definition of a solid trunk segment. Finally, it is possible that skin movement artefact may
327
have affected the reported kinematics (Leardini et al., 2009). 328
329
In conclusion, the purpose of this study was to firstly investigate the relationship of crunch 330
factor variables between the trunk and lower trunk, then secondly, to see what crunch factor 331
variables are associated with swing (clubhead velocity) and launch (launch angle) parameters. 332
Firstly, a relationship was reported for axial rotation velocity, but no correlation for lateral 333
bending and thus, crunch factor was reported, using a Pearson correlation analysis. Cross-334
correlation analysis revealed a strong coupling relationship for the crunch factor between the 335
trunk and lower trunk. Secondly, reduced lateral bending at ball impact was shown to be 336
related to faster driver clubhead velocities and a lower launch angle. These findings have 337
implications for both injury prevention and improved golf performance. 338 3 4 5 6 7 8 9 10 11 12 13 14 15 16 17 18 19 20 21 22 23 24 25 26 27 28 29 30 31 32 33 34 35 36 37 38 39 40 41 42 43 44 45 46 47 48 49 50 51 52 53 54 55 56 57
For Peer Review Only
References 339
Alin, A. (2010). Multicolinearity. Interdisciplinary Reviews: Computational Statistics, 2(3), 340
370-374. 341
342
Cheetham, P., Martin, P., & Mottram, R. (2001). The importance of stretching the “X-factor” 343
in the downswing of golf: The “X-factor stretch”. In: Thomas, P. R. (4th Ed). Optimising
344
Performance in Golf. (pp.192-199). Brisbane, QLD: Australian Academic Press Ltd. 345
346
Cole, M.H., & Grimshaw, P.N. (2008).Trunk muscle onset and cessation in golfers with and 347
without low back pain. Journal of Biomechanics, 41(13), 2829-2833. 348
349
Cole, M.H., & Grimshaw, P.N. (2014).The crunch factor’s role in golf-related low back pain. 350
The Spine Journal, 14(5), 799-807. 351
352
Chu, Y., Sell, T.C., & Lephart, S.M. (2010). The relationship between biomechanical 353
variables and driving performance during the golf swing. Journal of Sports Sciences, 28(11),
354
1251-1259. 355
356
Derrick, T. R., & Thomas, J. M. (2004). Time series analysis: The cross-correlation function. 357
In N. Stergion (Ed.), Innovative analyses of human movement (pp. 189–205). Champaign, 358
IL: Human Kinetics. 359
360
Foley, S. (2012, February). Hit down with your driver. Golfers Digest. Retrieved November 361
6, 2014, from http://www.golfdigest.com/golf-instruction/2012-02/sean-foley-down-driver 362
363
Glazier, P. (2010). Is the ‘crunch factor’ an important consideration in the aetiology of 364
lumbar spine pathology in cricket fast bowlers? Sports Medicine, 40(10), 809-815. 365
366
Gluck, G.S., Bendo, J.A., & Spivak, J.M. (2007). The lumbar spine and low back pain in 367
golf: a literature review of swing biomechanics and injury prevention. The Spine Journal, 368
8(5), 1-11 369
370
Horan, S.A., & Kavanagh, J.J. (2012).The control of upper body segment speed and velocity 371
during the golf swing. Sports Biomechanics, 11(2), 165-174. 372
373
Hosea, T., & Gatt, C. (1996). Back pain in golf. Clinics in Sports Medicine, 15(1), 37-53. 374
375
Hume, P., Keogh, J., & Reid, D. (2005). The role of biomechanics in maximising distance
376
and accuracy of golf shots. Sports Medicine, 35 (5), 429–449.
377 378
Johnson, I. (2000). I’ll give you a definite maybe. An introductory handbook on probability,
379
statistics and Excel. Retrieved from http://records.viu.ca/~johntoi/maybe/title.htm. 380
381
Joyce, C., Burnett, A., & Ball, K. (2010). Methodological considerations for the 3D 382
measurement of the x-factor and lower trunk movement in golf. Sports Biomechanics, 9(3),
383
206-221. 384
385
Joyce, C., Burnett, A., Ball, K., & Cochrane, J. (2013). 3D trunk kinematics in golf: between-386
club differences and relationships to clubhead speed. Sports Biomechanics, 12(2), 108-120. 3 4 5 6 7 8 9 10 11 12 13 14 15 16 17 18 19 20 21 22 23 24 25 26 27 28 29 30 31 32 33 34 35 36 37 38 39 40 41 42 43 44 45 46 47 48 49 50 51 52 53 54 55 56 57
For Peer Review Only
388
Joyce, C., Burnett, A., Reyes, A., & Herbert, S. (2014). A dynamic evaluation of how kick 389
point location influences swing parameters and related launch conditions. Proceedings of the
390
Institution of Mechanical Engineers Part P: Journal of Sports Engineering and Technology,
391
228(2), 111-119. 392
393
Kuorinka, I., Jonsson, B., Kilbom, A., Vinterberg, H., Biering-Sorensen, F., Andersson, G., & 394
Jorgensen, K. (1987).Standardised Nordic questionnaires for the analysis of musculoskeletal 395
symptoms. Applied Ergonomics, 18(3), 233-237. 396
397
Kwon, Y.H., Han, K.H., Como, C., Lee, S., & Singhal, K. (2013).Validity of the x-factor 398
computation methods and relationship between the x-factor parameters and clubhead velocity 399
in skilled golfers. Sports Biomechanics, 12(3), 231-246. 400
401
Leardini, A., Biagi, F., Belvedere, C., & Benedetti, M.G. (2009). Quantitative comparison of 402
current models for trunk motion in human movement analysis. Clinical Biomechanics, 24, 403
542-550. 404
405
Lephart, S.M., Smoliga, J.M., Myers, J.B., Sell, T.C., & Tsai, Y. (2007). Eight-week golf-406
specific exercise program improves physical characteristics, swing mechanics, and golf 407
performance in recreational golfers. Journal of Strength and Conditioning Research, 21(3),
408
860-869. 409
410
Lindsay, D.M., & Horton, J.F. (2002).Comparison of spine motion in elite golfers with and 411
without low back pain. Journal of Sports Sciences, 20(8), 599-605. 412
413
McHardy, A., Pollard. H., & Bayley, G. (2006). A comparison of the modern and classic golf 414
swing: a clinician’s perspective. South African Journal of Sports Medicine, 18(3), 80-92. 415
416
McLean, J. (1992). Widening the gap. Golf Magazine, 12, pp. 49-53. 417
418
Metz, J.P (1999). Managing golf injuries. The Physician and Sports medicine, 39, 62-74. 419
420
Morgan, D., Sugaya, H., Banks, S., & Cook, F. (1997). A new twist on golf kinematics and 421
low back injuries: the crunch factor. In: Farrally, M.R., & Cochran, A.J. (Eds.), Science and
422
Golf III: Proceedings of the World Scientific Congress on Golf. (pp. 120-126). Leeds, UK: 423
Human Kinetics. 424
425
Sato, K., Kenny, I.C., & Dale, B.R (2013).Current golf performance literature and application 426
to training. Journal of Trainology, 2(2), 23-32. 427
428
Sugaya, H., Tsuchiya, H., Morgan, D.A., & Banks, S.A. (1999). Low back injury in elite and 429
professional golfers: and epidemiologic and radiographic study. In: Farrally, M.R., & 430
Cochran, A.J. (Eds.), Science and Golf III: Proceedings of the World Scientific Congress on
431
Golf. (pp. 83-91). Leeds, UK: Human Kinetics. 432
433
Tinmark, F., Hellstrom, J., Halvorsen, K., & Thorstensson, A. (2010).Elite golfers’ kinematic 434
sequence in full-swing and partial-swing shots.Sports Biomechanics, 9(4), 236-244. 435
Vincent, W. J. (2005). Statistics in kinesiology (3rd Ed.). Champaign, IL: Human Kinetics. 436 3 4 5 6 7 8 9 10 11 12 13 14 15 16 17 18 19 20 21 22 23 24 25 26 27 28 29 30 31 32 33 34 35 36 37 38 39 40 41 42 43 44 45 46 47 48 49 50 51 52 53 54 55 56 57
For Peer Review Only
Wallace, E.S., Otto, S.R., & Nevill, A. (2007). Ball launch conditions for skilled golfers 438
using drivers of different lengths in an indoor testing facility. Journal of Sports Sciences, 25, 439
731-737. 440
441
Wishon, T. (2013, August).A complete guide to fitting for maximizing distance. Wishon Golf. 442
Retrieved December 24, 2014, from http://wishongolf.com/etech/archive/2013-2/august-443
2013/ 444
445
Woltring, H.J. (1986). A FORTRAN package for generalised, cross-validatory spline 446
smoothing and differentiation. Advanced Engineering Software, 8(2), 104-113. 447 3 4 5 6 7 8 9 10 11 12 13 14 15 16 17 18 19 20 21 22 23 24 25 26 27 28 29 30 31 32 33 34 35 36 37 38 39 40 41 42 43 44 45 46 47 48 49 50 51 52 53 54 55 56 57
For Peer Review Only
449
Table I Anatomical placement of the retro-reflective markers. 450
451
Table II Crunch factor variables reported for the trunk and lower trunk segments and swing and 452
launch parameters (Mean ± SD). The 95% confidence intervals are reported, along with indices of 453
reliability. 454
455
Table III Final generalised linear model estimates for clubhead velocity and launch angle. 456
Figure I Ensemble averages of crunch factor data reported for the trunk and lower trunk segments 457
from the top of the backswing (0 %) to ball impact (100 %). Shaded areas represent one standard 458
deviation from the mean. 459 3 4 5 6 7 8 9 10 11 12 13 14 15 16 17 18 19 20 21 22 23 24 25 26 27 28 29 30 31 32 33 34 35 36 37 38 39 40 41 42 43 44 45 46 47 48 49 50 51 52 53 54 55 56 57
For Peer Review Only
Ensemble averages of crunch factor data reported for the trunk and lower trunk segments from the top of the backswing (0 %) to ball impact (100 %). Shaded areas represent one standard deviation from the
mean. 110x73mm (300 x 300 DPI) 3 4 5 6 7 8 9 10 11 12 13 14 15 16 17 18 19 20 21 22 23 24 25 26 27 28 29 30 31 32 33 34 35 36 37 38 39 40 41 42 43 44 45 46 47 48 49 50 51 52 53 54 55 56 57
For Peer Review Only
Table 2
Reference Frame Anatomical Marker Placement Defined Joint Coordinate System Shoulders1
Lower Thorax2
Pelvis2
Golf Club
Left Acromion Process (LACRM) Right Acromion Process (RACRM) Tenth Thoracic Spinous Process (T10) Xiphoid Process, distal end of the Sternum Tenth Thoracic Spinous Process (T10) First Lumbar Spinous Process (L1) Left Anterior Superior Illiac Spine (LASIS) Right Anterior Superior Illiac Spine (RASIS) Left Posterior Superior Illiac Spine (LPSIS) Right Posterior Superior Illiac Spine (RPSIS) 1/3 length of shaft from grip
2/3 length of shaft from grip
Mid-acromion, then T10 mid-point (origin). Mid-acromion, unit vector pointing right (X vector). A distal unit vector perpendicular to X from the origin (Y-temp vector). Common perpendicular of X and Y-temp, proximal unit vector, perpendicular to X (Z vector). Cross-product of X and Z, a unit vector perpendicular and anterior to X.
Mid-L1 and T10, then mid-sternum (origin). Mid-L1 and T10, unit vector pointing right (X vector). A distal unit vector perpendicular to X from the origin (Y-temp vector). Common perpendicular of X and Y-temp, proximal unit vector, perpendicular to X (Z vector). Cross-product of X and Z, a unit vector perpendicular and anterior to X.
Mid-point of mid-ASIS and mid-PSIS (origin). Unit vector pointing right from the origin (X vector). A distal unit vector perpendicular to X from the origin (Y-temp vector). Common perpendicular of X and Y-temp, proximal unit vector, perpendicular to X (Z vector). Cross-product of X and Z, a unit vector perpendicular and anterior to X.
None 1
– Trunk, 2 – Lower Trunk. Joint coordinate systems defined from anatomical position perspective.
URL: http://mc.manuscriptcentral.com/rjsp 3 4 5 6 7 8 9 10 11 12 13 14 15 16 17 18 19 20 21 22 23 24 25 26 27 28 29 30 31 32 33 34 35 36 37 38 39 40 41 42 43 44 45 46 47 48 49 50 51 52 53 54 55
For Peer Review Only
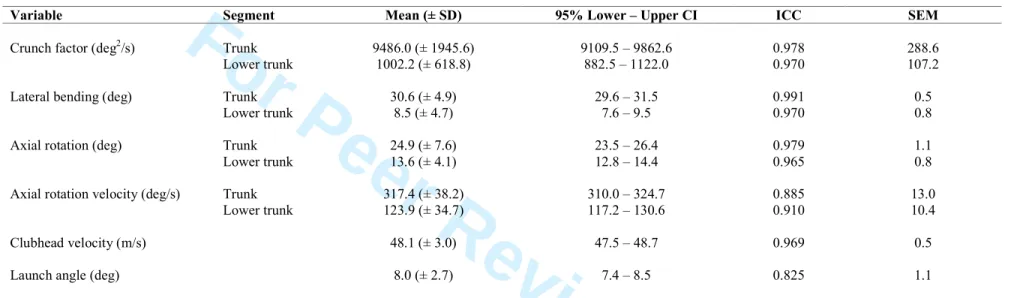
Table II Crunch factor variables reported for the trunk and lower trunk segments and swing and launch parameters (Mean ± SD). The 95 % confidence intervals are reported, along with indices of reliability.
Variable Segment Mean (± SD) 95% Lower – Upper CI ICC SEM
Crunch factor (deg2/s)
Lateral bending (deg)
Axial rotation (deg)
Axial rotation velocity (deg/s)
Clubhead velocity (m/s)
Launch angle (deg)
Trunk Lower trunk Trunk Lower trunk Trunk Lower trunk Trunk Lower trunk 9486.0 (± 1945.6) 1002.2 (± 618.8) 30.6 (± 4.9) 8.5 (± 4.7) 24.9 (± 7.6) 13.6 (± 4.1) 317.4 (± 38.2) 123.9 (± 34.7) 48.1 (± 3.0) 8.0 (± 2.7) 9109.5 – 9862.6 882.5 – 1122.0 29.6 – 31.5 7.6 – 9.5 23.5 – 26.4 12.8 – 14.4 310.0 – 324.7 117.2 – 130.6 47.5 – 48.7 7.4 – 8.5 0.978 0.970 0.991 0.970 0.979 0.965 0.885 0.910 0.969 0.825 288.6 107.2 0.5 0.8 1.1 0.8 13.0 10.4 0.5 1.1
CI – Confidence intervals, ICC – intra-class correlation coefficient, SEM – standard error of measurement
URL: http://mc.manuscriptcentral.com/rjsp 3 4 5 6 7 8 9 10 11 12 13 14 15 16 17 18 19 20 21 22 23 24 25 26 27 28 29 30 31 32 33 34 35 36 37 38 39 40 41 42 43 44 45 46 47 48 49 50 51 52 53 54 55
For Peer Review Only
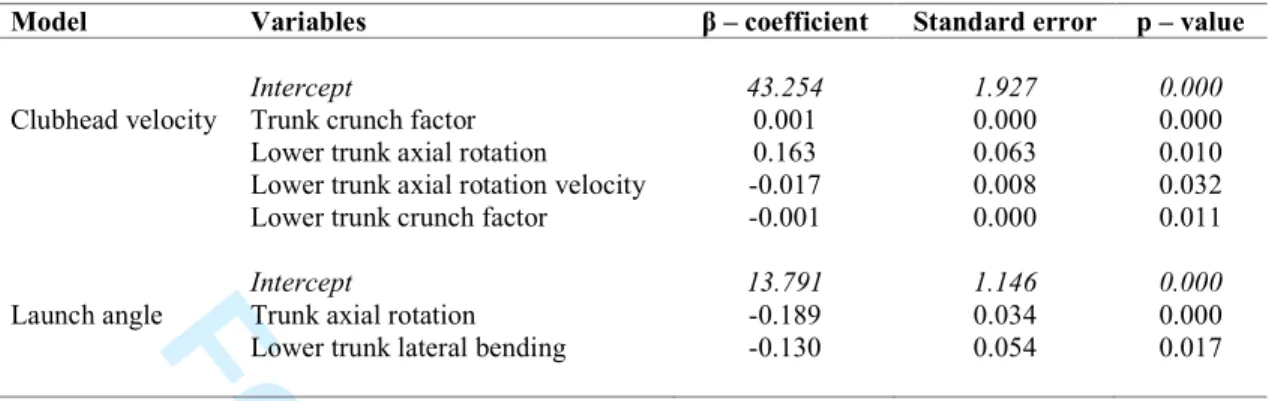
Table III Final generalised linear model estimates for clubhead velocity and launch angle.
Model Variables β – coefficient Standard error p – value
Clubhead velocity
Launch angle
Intercept
Trunk crunch factor Lower trunk axial rotation Lower trunk axial rotation velocity Lower trunk crunch factor
Intercept
Trunk axial rotation Lower trunk lateral bending
43.254 0.001 0.163 -0.017 -0.001 13.791 -0.189 -0.130 1.927 0.000 0.063 0.008 0.000 1.146 0.034 0.054 0.000 0.000 0.010 0.032 0.011 0.000 0.000 0.017 3 4 5 6 7 8 9 10 11 12 13 14 15 16 17 18 19 20 21 22 23 24 25 26 27 28 29 30 31 32 33 34 35 36 37 38 39 40 41 42 43 44 45 46 47 48 49 50 51 52 53 54 55 56 57