Kent Academic Repository
Full text document (pdf)
Copyright & reuse
Content in the Kent Academic Repository is made available for research purposes. Unless otherwise stated all content is protected by copyright and in the absence of an open licence (eg Creative Commons), permissions for further reuse of content should be sought from the publisher, author or other copyright holder.
Versions of research
The version in the Kent Academic Repository may differ from the final published version.
Users are advised to check http://kar.kent.ac.uk for the status of the paper. Users should always cite the published version of record.
Enquiries
For any further enquiries regarding the licence status of this document, please contact:
If you believe this document infringes copyright then please contact the KAR admin team with the take-down information provided at http://kar.kent.ac.uk/contact.html
Citation for published version
Loo, Ruey Leng and Xin, Zou and Appel, Lawrence and Nicholson, Jeremy K. and Holmes, Elaine
(2018) Characterization of metabolic responses to healthy diets and the association with blood
pressure: application to the Optimal Macronutrient Intake Trial for Heart Health (OmniHeart),
a Randomized Control Study. Characterization of metabolic responses to healthy diets and the
DOI
https://doi.org/10.1093/ajcn/nqx072
Link to record in KAR
http://kar.kent.ac.uk/65733/
Document Version
Characterization of metabolic responses to healthy diets and
association with blood pressure: application to the Optimal
Macronutrient Intake Trial for Heart Health (OmniHeart),
a randomized controlled study
Ruey Leng Loo,1Xin Zou,1,2Lawrence J Appel,3,4Jeremy K Nicholson,5,6and Elaine Holmes5,6
1Medway Metabonomics Research Group, Medway School of Pharmacy, Universities of Kent and Greenwich, Chatham Maritime, United Kingdom; 2Ministry of Education Key Laboratory of Systems Biomedicine, Shanghai Centre for Systems Biomedicine, Shanghai Jiao Tong University, Shanghai, China; 3Department of Medicine, Johns Hopkins University School of Medicine, Baltimore, MD;4Welch Center for Prevention, Epidemiology, and Clinical Research, Johns Hopkins University, Baltimore, MD;5Division of Computational and Systems Medicine, Department of Surgery and Cancer, Imperial College London, London, United Kingdom; and6MRC-HPA Centre for Environment and Health, Imperial College London, London, United Kingdom
ABSTRACT
Background: Interindividual variation in the response to diet is common, but the underlying mechanism for such variation is unclear.
Objective:The objective of this study was to use a metabolic pro-iling approach to identify a panel of urinary metabolites represent-ing individuals demonstratrepresent-ing typical (homogeneous) metabolic re-sponses to healthy diets, and subsequently to deine the association of these metabolites with improvement of risk factors for cardiovas-cular diseases (CVDs).
Design: 24-h urine samples from 158 participants with pre-hypertension and stage 1 pre-hypertension, collected at baseline and fol-lowing the consumption of a carbohydrate-rich, a protein-rich, and a monounsaturated fat–rich healthy diet (6 wk/diet) in a randomized,
crossover study, were analyzed by proton (1H) nuclear magnetic
res-onance (NMR) spectroscopy. Urinary metabolite proiles were inter-rogated to identify typical and variable responses to each diet. We quantiied the differences in absolute excretion of metabolites, dis-tinguishing between dietary comparisons within the typical response groups, and established their associations with CVD risk factors us-ing linear regression.
Results:Globally all 3 diets induced a similar pattern of change in the urinary metabolic proiles for the majority of participants (60.1%). Diet-dependent metabolic variation was not signiicantly associated with total cholesterol or low-density lipoprotein (LDL) cholesterol concentration. However, blood pressure (BP) was found to be sig-niicantly associated with 6 urinary metabolites relecting dietary intake [proline-betaine (inverse), carnitine (direct)], gut microbial co-metabolites [hippurate (direct), 4-cresyl sulfate (inverse),
pheny-lacetylglutamine (inverse)], and tryptophan metabolism [N
-methyl-2-pyridone-5-carboxamide (inverse)]. A dampened clinical response was observed in some individuals with variable metabolic responses,
which could be attributed to nonadherence to diet (≤25.3%),
vari-ation in gut microbiome activity (7.6%), or a combinvari-ation of both (7.0%).
Conclusions:These data indicate interindividual variations in BP in response to dietary change and highlight the potential inluence of the gut microbiome in mediating this relation. This approach pro-vides a framework for stratiication of individuals undergoing di-etary management. The original OmniHeart intervention study and
the metabolomics study were registered atwww.clinicaltrials.govas
NCT00051350 and NCT03369535, respectively. Am J Clin Nutr
2018;107:323–334.
Keywords: diets, gut microbiome, hypertension, metabolic proil-ing, metabonomic, metabolomic, personalized health care
INTRODUCTION
Of total global deaths, approximately half are attributed to car-diovascular diseases (CVDs), with elevated blood pressure (BP)
being a key risk factor (1). Genome-wide association studies have
identiied common genetic variants associated with high BP (2)
but these only account for a small proportion of the population variance in BP and do not take lifestyle factors such as physical inactivity or unhealthy diet into account. CVD remains the lead-ing cause of mortality for noncommunicable diseases worldwide, even though the adoption of healthy dietary patterns such as those promoted by Dietary Approaches to Stop Hypertension (DASH)
(3), Optimal Macronutrient Intake Trial for Heart Health
(Om-niHeart) (4), and Mediterranean diets (5) has unequivocally been
shown to reduce CVD risk. Humans demonstrate substantial vari-ation in response to dietary intervention, partially attributable to
genetic heterogeneity (6,7). For example, the apolipoprotein
A-IV protein modulates cholesterol-lowering responses to high-fat
diets (8,9). However, supporting evidence for genetic inluence
on variable dietary responses remains conlicting (10) and
modii-able factors such as changes in body weight (11,12), or variation
in the composition of the gut microbiome (13) and virome (14),
have been implicated in variation in dietary responses.
Metabolic phenotyping technologies provide a framework for investigating the inluences of environmental and lifestyle fac-tors on disease risk and have been successfully applied to
in-vestigate chronic diseases, e.g., diabetes (15). Systematic
mod-ulation of metabolism in response to food intake (16) has been
reported and the impact of diet on a range of pathological con-ditions, including gastrointestinal cancer risk, has been assessed
(17). Building on methodological approaches developed for
char-acterizing interindividual variation in response to drug toxicity or
therapies (18), we propose to demonstrate the feasibility of
iden-tifying interindividual variation in clinical response to 3 different
healthy diets, using a 1H nuclear magnetic resonance
(NMR)-based metabolic phenotyping approach, and establish the im-pact of this variation on CVD risk. We hypothesized that dietary change from a typical American diet to a healthy diet or between different healthy diets would result in typical changes in the uri-nary metabolic phenotypes for the majority of individuals, herein considered as the homogeneous dietary response (HDR) group. We ascertained that a minority of individuals demonstrated atyp-ical dietary responses, herein referred to as the variable (het-erogeneous or nonuniform) dietary response (VDR) group. We further hypothesized that these speciic urinary dietary response phenotypes would be associated with BP. Variation in diet-speciic biomarkers will further enhance our understanding of the link between variation in dietary response and the aetiopathogen-esis of hypertension.
METHODS
OmniHeart study design
The OmniHeart study (N=163) was a randomized, controlled,
3-period cross-over feeding study aiming to assess the effects of
3 healthy diets on BP and lipid proiles (19). The key indings
and study design of the OmniHeart study have been previously
published (4,19). Briely, all 3 OmniHeart diets had a similar
nu-trient composition to the established healthy DASH diet but var-ied in macronutrient composition. The Omniheart carbohydrate-rich diet (OmniCarb diet) provided 58% kcal from carbohydrate, 15% from protein, and 27% from fat; the remaining 2 diets
Supported by the Medical Research Council, New Investigator Grant Award (G1002151). XZ is also supported by the Natural Science Foun-dation of Shanghai (16ZR1417900) and Shanghai Pujiang Talent Fund (16PJ1405200). EH and JKN also acknowledge support from the Biotech-nology and Biological Sciences Research Council (PS8813) and National In-stitute for Health Research (PSA809).
Supplemental Figures 1–4 and Supplemental Tables 1–5 are available from the “Supplementary data” link in the online posting of the article and from the same link in the online table of contents athttps://academic.oup.com/ajcn/.
Address correspondence to RLL (e-mail:[email protected]).
Abbreviations used: BP, blood pressure; CVD, cardiovascular disease; DASH, Dietary Approaches to Stop Hypertension; HDR, homogeneous di-etary response; mOPLSDA, multilevel orthogonal partial least squares dis-criminant analysis; NIHR, National Institute for Health Research; NMR, nuclear magnetic resonance; OmniCarb, OmniHeart carbohydrate-rich diet; OmniHeart, Optimal Macronutrient Intake Trial for Heart Health; OmniMFA, OmniHeart monounsaturated fat–rich diet; OmniProt, OmniHeart protein-rich diet; SHOCSY, statistical homogeneous cluster spectroscopy; VDR, vari-able dietary response.
Received August 10, 2017. Accepted for publication December 13, 2017. First published online March 16, 2018; doi: https://doi.org/10.1093/ ajcn/nqx072.
replaced 10% of calories from carbohydrate with either protein, predominantly obtained from vegetable sources (OmniProt diet), or unsaturated fats, predominantly derived from monounsatu-rated fat (OmniMFA diet). Participants were randomly assigned to 1 of 6 possible orders of administration of the 3 diets, each intervention period lasting for 6 wk. During each intervention period, the participants were requested to only consume food
prepared in the diet kitchen and were allowed to consume≤2
al-coholic beverages/d and 3 noncaloric caffeinated beverages/d as part of the trial. Their main meal was consumed on-site on week-days and all other meals were eaten at home. Participants com-pleted a diary in which they indicated whether they had complied with the study food protocol during the feeding periods. During
the screening visits and washout periods (≥2 wk), participants
consumed their own food. The Willett food frequency
question-naire (20), administered by certiied staff as a means to describe
the usual food intake of participants during screening visits, indi-cated participants consumed a typical American diet at the outset of the study, corresponding to high intake of saturated fat, exces-sive reined sugar, and salt with low intake of fruit, vegetables, and omega-3-fat.
A total of 163 men and women aged 30–80 y from the Bal-timore and Boston areas, with prehypertension (systolic BP of 120–139 mmHg and/or diastolic BP of 80–89 mmHg) or stage 1 hypertension (systolic BP of 140–159 mm Hg and/or diastolic BP of 90–99 mm Hg) and without diabetes or prior CVD, were recruited to the study. The minimum detectable, between-diet dif-ferences for primary (systolic BP) and secondary (diastolic BP, LDL cholesterol, HDL cholesterol, triglyceride, and total
choles-terol) variables in the full cohort (n= 160) and in subgroups
(n=80 and 70) were at 80% and 90% power (2-sided alpha,
P=0.05).
The sample size of the trial (n=160) was selected because
it provided adequate power to detect between-diet differences in the primary outcome variables that have public health signii-cance, both overall and in subgroups. Speciically, the minimum
detectable effect size for systolic BP was<3 mmHg even in
sub-groups that comprised only 40% (n=64) of participants. One
individual completed just 1 dietary intervention period, and 4 in-dividuals completed 2 intervention periods. The remaining 158 completed all 3 dietary interventions, provided four 24-h urine collections, and supplied anthropometric and sociodemographic
metrics on CVD (Supplemental Figure 1). These four 24-h urine
collections corresponded to the baseline screening visit and 1 at the end of each of the three 6-wk dietary interventions. NMR urine spectra for these 158 individuals were used for the analyses presented here. During the last 10 d of each dietary intervention period, a fasting blood specimen was obtained to measure lipid concentrations. BP was measured on 5 d by trained staff using the OMRON 907 device for those requiring a normal or large
adult cuff, after participants had been seated for≥5 min. The
re-ported BP was based on the average of 9 BP measurements taken at screening visits and 15 measurements taken at the last 5 visits of each feeding period. Body weight for all participants was main-tained within 2% of their baseline throughout the study period by adjusting caloric levels each weekday. Baseline sociodem-ographic and anthropometric characteristics were obtained for each participant. Institutional ethics committee approval was ob-tained for each site and all participants provided written informed consent.
NMR-based metabolic phenotyping and data processing
Urine specimens were analyzed by 600 MHz1H NMR
spec-troscopy using a Bruker NMR spectrometer (Bruker Biospin,
Rheinstetten, Germany) according to a standard protocol (21) in
our London metabolic phenotyping laboratory. Urine specimens were allowed to thaw at room temperature and centrifuged at 12,000 g for 5 min to remove particulates. For each specimen,
500µL of urine was mixed with 250µL of phosphate buffer
so-lution at pH 7.4±0.1. The resulting mixtures were left to stand
for 10 min and then further centrifuged as before. A total volume
of 500µL of the supernatant was added to 50µL of sodium
3-trimethylsilyl-(2,2,3,3-2H4)-1-propionate (TSP) in deuterium
oxide, giving a inal concentration of 1 mM. This solution was transferred to a 5-mm NMR tube. The prepared urine specimens were placed in the auto-sampler and analyzed in a simple random-ized order generated by computer. A 1-dimensional (1D) pulse
sequence with a water saturation method (recycle delay–90°–t1–
90°–tm–90°–acquisition) was used to acquire standard1H NMR
spectra of the urine. The spectra were acquired with 64K data points and 128 scans over a spectral width of 12 kHz. The
re-cycle delay was set to 2 s with a mixing time (tm) of 100 ms
and a t1of 20µs, providing an acquisition time of approximately
2.72 s. All1H NMR spectra were phased, baseline corrected, and
manually referenced to TSP atδ 0 with Topspin software
(ver-sion 2.1, Bruker Biospin) prior to multiplication by an exponen-tial weighting function corresponding to a line broadening of 0.3
Hz. The spectral regions containing the water (δ4.5–5.05) and
urea (δ5.5–6.5) resonances, as well as the extreme ends (<δ0.7
and>δ 9.5) of the spectra that contain minimal metabolic in-formation, were removed. Initial analysis showed that the signal
arising from the –CH2and –CH3group of the creatinine peaks
dominated the analysis due to the high concentration of creatinine compared to other metabolites. Since there was no statistical dif-ference in the clinical creatinine measurements at screening visit and at the end of each study period based on Jaffé reaction
mea-surement (P>0.5 for all comparisons between each diet and the
baseline), we removed the creatinine regions containing the peaks
atδ3.035–3.062 andδ4.052–4.075 from all subsequent
analy-sis. A total of 23,998 NMR data variables, at a full resolution (0.0003 ppm), were then normalized by a probabilistic quotient
method (22) using the median spectrum of the whole data-set as
a reference and subsequently scaled to unit-variance.
Data analysis
We applied Statistical HOmogeneous Cluster SpectroscopY
(SHOCSY) (23) to the processed and normalized spectroscopic
data. SHOCSY is a variant of statistical spectroscopic techniques such as Subset Optimization by Reference Matching (STORM)
(24) and Statistical TOtal Correlation SpectroscopY (STOCSY)
(25). SHOCSY involves clustering of the spectral data based on
the similarity or dissimilarity of the spectral features followed by the association of clusters to different dietary groups using an enrichment test. The application of SHOCSY enables iden-tiication of the groups of spectra showing uniform or ho-mogeneous urinary metabolic responses (HDR) and those showing variation from the coherent metabolic response (VDR) following the consumption of different OmniHeart diets. Due to the nature of the cross-over study design, we employed
multilevel orthogonal partial least squares discriminant analysis
(mOPLSDA) (26,27), which incorporates the variation between
and within participants in the data-set to optimize visualiza-tion of dietary response, in conjuncvisualiza-tion with SHOCSY. We per-formed this in a pairwise fashion, comparing the urinary spec-tral data from the screening visit (relecting a basal dietary pattern) with those from the end of each dietary intervention, and modelled this separately for the urinary spectral data corre-sponding to an HDR (3 models, 1 model/diet) and those repre-senting a VDR (3 models). Thus, each subgroup was compared to its own baseline. We also performed comparison between dif-ferent OmniHeart diets and separately for the HDR (3 models) and VDR (3 models) groups, creating a total of 12 different
mOPLSDA models (Supplemental Table 1). Each mOPLSDA
comparison was validated using a 7-fold cross-validation
proce-dure. The model statistics, Q2Yhât (28), is deined as the
propor-tion of variance in the data predicted by the mOPLSDA model and is therefore a measure of the robustness of the model. In ad-dition, permutation testing was performed by randomly assigning classes to the samples and remodeling repeatedly 100 times. The
Q2Yhât statistic for the real model was then compared to the null
hypothesis distribution obtained from the permuted Q2Yhâtt
val-ues and was considered signiicant when thePvalue of the real
Q2Yhât was<0.05 on those permuted values.
The 3 criteria used to identify discriminatory metabolites were:
(i)Pvalues of the correlations between the spectral variable and
the mOPLSDA scores vector should be<1.85× 10⁻⁶
(corre-sponding toP<0.05 after Sidák correction); (ii) a variable
load-ing coeficient strength,r2>0.3 as deined in Zou et al. (23); and
(iii) the stability of the NMR variables, whereby a data point was considered signiicant when lanked by 2 NMR spectral variables conforming to criteria (i) and (ii). For peaks that were free from spectral overlap, the 24-h urinary excretion of each discrimina-tory metabolite was quantiied by integration of the NMR signal intensities. Since we found no signiicant difference in the ex-cretion of creatinine between different OmniHeart diets and the
typical American diet (P>0.5), the absolute excretion of each
discriminatory metabolite was normalized to the corresponding 24-h urinary creatinine excretion (in mmol/L). The difference in absolute excretion of each discriminatory metabolite was deter-mined for the comparison of each dietary intervention with base-line or between different OmniHeart dietary interventions. The association between the differences in absolute excretion of each discriminatory metabolite and changes in CVD risk factors (sys-tolic and dias(sys-tolic BP, LDL, total cholesterol) was established using linear regression for HDR groups. In addition, known co-variates for hypertension, including urinary excretion of sodium, potassium, calcium, and phosphate, were also established for the HDR and VDR groups for the comparisons between baseline and each OmniHeart diet. The statistical signiicance of these covari-ates was adjusted by Bonferroni correction (0.05 divided by num-ber of comparisons) to account for multiple testing. All analyses were performed using in-house software written in Matlab (ver-sion 2012a, MathWorks, Natick, MA).
Identiication of discriminatory metabolites
The discriminatory metabolites found to be signiicantly inluenced by the healthy dietary interventions were
authenticated by spiking in standard compounds purchased
from Sigma Aldrich. These compounds included: N
-methyl-2-pyridone-5-carboxamide, 4-hydroxyphenylacetic acid,
carni-tine, creacarni-tine, dimethylglycine, S-methyl-L-cysteine-S-oxide,
N-methyl nicotinic acid,N-methyl nicotinamide, proline-betaine,
and hippurate. For the remaining urinary metabolites where they were not available commercially, identiication was achieved us-ing further analytical methods such as 2-dimensional NMR ex-periments, solid phase extraction chromatography experiments coupled with NMR, ultra-performance liquid chromatography coupled to mass spectroscopy, and statistical analysis such as
STORM (24) as well as using published databases and/or
liter-ature.
RESULTS
Individuals show variation in urinary metabolic phenotypes on OmniHeart diets
Participants’ demographics and changes in CVD risk
fac-tors following each OmniHeart diet are provided in Table 1.
Each diet elicited a range of clinical responses over the 6-wk study in terms of reduction of CVD risk factors, which was re-lected in the urinary metabolome. Interindividual differences in dietary response were observed; the majority of the partici-pants showed a HDR to all of the OmniHeart diets when
com-pared to the baseline proile: 71.5% (n= 113) for OmniProt,
80.4% (n=127) for OmniMFA, and 86.7% (n=137) for
Om-niCarb. The remaining individuals who did not demonstrate a “typical” response to a given diet were grouped into the VDR
class:n=45 for OmniProt,n=31 for OmnMFA, andn=21
for OmniCarb. A similar modeling strategy was applied to
com-pare between pairs of OmniHeart diets. We found>70%
par-ticipants showed consistent metabolic differences between diets (Supplemental Table 1).
OmniHeart diets show distinctive urinary metabolic phenotypes
Each of the 3 OmniHeart diets was associated with a dis-tinct metabolic phenotype in the majority of participants (the HDR group). For the OmniHeart–baseline comparisons, the discriminatory metabolites were predominantly related to: (i) dietary intake—increased excretion of proline-betaine,
N-acetyl-S-methyl-L-cysteine sulfoxide, S
-methyl-L-cysteine-S-oxide, creatine, and carnitine; (ii) tryptophan–NAD
degradation—reduced excretion of N
-methyl-2-pyridone-5-carboxamide and N-methyl nicotinamide, and increased
excretion of N-methyl nicotinic acid; and (iii) gut
mi-crobial mammalian metabolism—increased excretion of
hippurate and dimethylglycine, and reduced excretion of 4-hydroxyphenylacetic acid (Supplemental Table 2). Compared to the baseline proiles, proline-betaine was the only metabolite uniformly increased in the urinary phenotypes of HDR groups across all 3 diets, consistent with increased citrus fruit
consump-tion (30). Increased excretion of carnitine and creatine in the
OmniProt diet relected the increase in protein intake (31).
Additional pairwise comparisons (P<10−5) between
differ-ent OmniHeart diets further indicated that each diet was associ-ated with a distinct metabolic phenotype. The HDR group of the OmniProt diet was generally characterized by higher excretion of
urinary creatine,N-methyl-2-pyridone-5-carboxamide and 2 gut
microbial mammalian co-metabolites, phenylacetylglutamine, and 4-cresyl sulfate compared to the other 2 OmniHeart diets; whilst the HDR group for the OmniCarb diet consistently showed
higher excretion of hippurate and guanodinoacetate (
Supple-mental Tables 3and4). The differences in the markers for dietary
intake of cruciferous vegetables (S-methyl-L-cysteine-S-oxide
andN-acetyl-S-methyl-L-cysteine sulfoxide) (32) and markers
for citrus fruit intake (proline-betaine) (30) observed when
com-paring urine of OmniHeart diets with the baseline proiles, were generally not observed for pairwise comparisons between the OmniHeart diets since all 3 diets included higher proportions of fruits or vegetables than the baseline.
Urinary metabolites signiicantly associated with BP
We quantiied 10 discriminatory metabolites altered in response to 1 or more OmniHeart diets and assessed their associations with BP and lipid proiles using the HDR groups only. Although no signiicant associations were found between dietary phenotypes and LDL or total cholesterol, we found signiicant associations between 2 of these food-related metabo-lites and BP. Proline-betaine was inversely associated with systolic and diastolic BP for OmniCarb and OmniMFA diets
when compared to baseline (P < 0.05, Table 2). A similar
trend was observed for the OmniProt diet although it was not statistically signiicant. A direct association was found be-tween systolic BP and carnitine for the OmniProt diet when
compared to baseline (P < 0.05). We found 3 metabolites
related to host-gut microbial pathways that were signiicantly associated with BP (hippurate, phenylacetylglutamine, and 4-cresyl sulfate). Hippurate showed a direct association with
systolic BP (P < 0.001) and diastolic BP (P < 0.01) levels
for the OmniCarb diet compared to baseline, whereas 4-cresyl sulfate and phenylacetylglutamine (distal colonic microbial metabolites of tyrosine and phenylalanine, respectively) were inversely associated with BP for the comparison between
OmniMFA and OmniProt diets. N
-methyl-2-pyridone-5-carboxamide (tryptophan–NAD metabolite) was also found to be inversely associated with systolic and diastolic BP levels
for the OmniCarb–baseline comparison (P<0.05). These data
demonstrate healthy diets can elicit coherent changes in the urinary metabolic phenotypes for the majority of individuals and that some of these metabolites are either directly or inversely associated with BP.
Urinary metabolic phenotypes can identify nonadherence to diets
The urinary spectral data for the VDR groups for each of the OmniHeart diets typically produced fewer dietary-speciic discriminatory metabolites than the HDR groups (Supplemental Tables 2 and 3). The VDR groups also showed discordance in the concentrations of proline-betaine and hippurate when com-pared to the HDR groups. Since increased consumption of citrus fruits was a feature of all dietary interventions, we there-fore classiied individuals with a lower concentration of
proline-betaine (a direct marker of citrus fruit intake) (33,34) as
non-adherent to these diets on the assumption that this was gener-ally indicative of dietary behavior. We found the majority of participants in the VDR groups excreted lower 24-h urinary
TABLE 1
Characteristics of participants who completed all 3 OmniHeart diets (n=158)1
Characteristics Pvalues Age, mean±SD 53.1±10.8 Ethnicity,n(%) African American 86 (54.4) Non-African American 72 (45.6) Gender,n(%) Male 88 (55.7) Female 70 (44.3) Hypertension,n(%) Prehypertension 127 (80.4) Hypertension 31 (19.6) Obesity status,n(%) Normal range 32 (20.3) Overweight 53 (33.5) Obese 73 (46.2) Smoking,n(%) Current 18 (11.4) Former 42 (26.6) Never 98 (62) Alcohol intake No alcohol,n(%) 88 (56)
Serving per week among drinkers, mean± SD 4.17± 3.5 Education,n(%)
≤High school 32 (20.3)
Some college 53 (33.5)
College graduate 73 (46.2)
Mean changes in SBP from baseline (95% CI), mm Hg
OmniCarb diet –8.0 (–9.4, –6.6) ‡
OmniMFA diet –9.4 (–10.7, –8.1) ‡
OmniProt diet –9.4 (–10.8, –8.1) ‡
Mean changes in DBP from baseline (95% CI), mm Hg
OmniCarb diet –4.1 (–4.9, –3.3) ‡
OmniMFA diet –4.9 (–5.7, –4.1) ‡
OmniProt diet –5.3 (–6.1, –4.4) ‡
Mean changes in LDL cholesterol from baseline (95% CI), mg/dL
OmniCarb diet –11.6 (–14.6, –8.6) ‡
OmniMFA diet –13.2 (–16.5, –9.9) ‡
OmniProt diet –14.4 (–17.7, –11.1) ‡
Mean changes in HDL cholesterol from baseline (95% CI), mg/dL
OmniCarb diet –1.5 (–2.6, –0.3) *
OmniMFA diet –0.4 (–1.4, 0.6)
OmniProt diet –2.7 (–3.7, –1.7) †
Mean changes in triglyceride from baseline (95% CI), mg/dL
OmniCarb diet –0.2 (–9.1, 8.7)
OmniMFA diet –9.7 (–17.9, –1.5) *
OmniProt diet –16.5 (–25.8, –7.3) *
Mean changes in total cholesterol from baseline (95% CI), mg/dL
OmniCarb diet –12.5 (–15.8, –9.1) ‡
OmniMFA diet –15.6 (–19.2, –11.9) ‡
OmniProt diet –20.2 (–23.7, –16.7) ‡
1Ttest comparison between baseline clinical data and after each dietary intervention:*P<0.05;†P<10−5; ‡P<10−10. DBP, diastolic blood pressure; OmniCarb, OmniHeart carbohydrate-rich diet; OmniHeart, Optimal Macronutrient Intake Trial for Heart Health; OmniMFA, OmniHeart monounsaturated fat-rich diet; OmniProt, OmniHeart protein-rich diet; SBP, systolic blood pressure.
concentrations of proline-betaine when compared to the HDR groups. Fifteen of the 21 individuals (71.4%) from the OmniCarb-VDR group showed a 24-h urinary excretion of less than the lower 95% CI obtained for proline-betaine excretion of the OmniCarb-HDR group. A similar trend was observed for the OmniMFA-VDR (21/31, 67.7%) and OmniProt-VDR (35/45, 77.8%) groups. The overall estimation of nonadherence to each
diet was: 9.5% (n=15) for the OmniCarb, 13.3% (n=21) for
the OmniMFA, and 22.2% (n=35) for the OmniProt diet.
De-spite sub-classiication of VDR groups as adherent or nonadher-ent, contrasting patterns remained in the VDR and HDR groups, as exempliied for hippurate (a gut microbial co-metabolite of di-etary phenols), where increased excretion of hippurate was char-acteristic for the HDR but not either of the VDR (diet adherent or
TABLE 2
Estimated mean differences in CVD risk factors1
2 SD excretion Total cholesterol
Urinary metabolites (mmol/L) SBP (mm Hg) DBP (mm Hg) LDL-C (mg/dL) (mg/dL) Homogeneous dietary responders for OmniCarb diet vs. baseline (n=137)
Proline-betaine 1.25 –4.10 (–2.90)† –1.77 (–2.15)* –3.90 (–1.26) –3.94 (–1.17) Hippurate 3.47 6.14 (4.64)‡ 2.27 (2.79)† –1.47 (–0.48) 2.70 (0.80) N-methyl-2-pyridone-5-carboxamide 0.21 –3.03 (–2.24)* –1.77 (–2.19)* 2.22 (0.75) 3.49 (1.11) N-methyl nicotinic acid 0.27 –0.20 (–0.14) 0.59 (0.71) –1.94 (0.64) –0.25 (–0.07)
N-methyl nicotinamide 0.03 –0.86 (–0.60) –0.75 (–0.97) 0.60 (0.20) –0.55 (0.17) Homogeneous dietary responders for OmniMFA vs. baseline (n=127)
Proline-betaine 0.87 –3.53 (–2.76)† –1.73 (–2.20)* 2.41 (0.73) 1.87 (0.48) Homogeneous dietary responders for OmniProt vs. baseline (n=113)
Proline-betaine 0.74 –1.16 (0.74) 0.14 (0.16) 1.31 (0.33) –1.42 (–0.33)
Carnitine 0.29 3.11 (1.99)* 1.13 (1.38) 0.45 (0.11) 1.03 (0.24)
Creatine 1.62 1.54 (1.05) –1.19 (–0.24) –4.34 (–1.11) –6.87 (–1.65) Homogeneous dietary responders for OmniCarb vs. OmniMFA (n=113)
Guanodinoacetate 0.95 0.29 (0.35) 0.06 (0.09) –0.51 (–0.21) 2.70 (0.94) Homogeneous dietary responders for OmniCarb vs. OmniProt (n=134)
Phenylacetylglutamine 0.70 –0.89 (–0.96) –0.93 (–1.42) –2.82 (–1.18) –0.44 (–0.15) 4-cresyl sulfate 0.27 0.06 (0.07) 0.73 (1.11) –0.91 (–0.79) 1.02 (0.35) Homogeneous dietary responders for OmniMFA vs. OmniProt (n=118)
Phenylacetylglutamine 0.68 –1.7 (–1.93) –1.89 (–3.32)† 0.31 (0.13) –0.33 (–0.14) 4-cresyl sulfate 0.30 –2.68 (–3.05)† –2.15 (–3.74)† 0.73 (0.31) –0.27 (–0.11) 1The SBP, DBP, LDL-C, and total cholesterol mean differences per 2-SD increase in absolute excretion for the comparison between baseline and post-OmniHeart diets and between different post-OmniHeart diets for the HDR groups. The correlations between changes in metabolites and CVD factors were evaluated by linear regression. 2 SD excretion of each urinary metabolite was calculated by the absolute differences between dietary comparisons. Numbers in parenthesis arezscores, i.e., regression coeficient divided by standard error (zscore≥1.96,P<0.05;≥2.58,P<0.01;≥3.89,P<0.001). NMR chemical shifts (mul-tiplicity) used for quantiication: proline-betaine,δ3.11 (singlet); hippurate,δ7.64 (triplet);N-methyl-2-pyridone-5-carboxamide,δ6.67 (doublet);N-methyl nicotinic acid,δ4.44 (singlet);N-methyl nicotinamide,δ8.89 (triplet); carnitine,δ3.23 (singlet); creatine,δ3.93 (singlet); guanodinoacetate,δ3.80 (singlet); phenylacetylglutamine,δ7.43 (triplet); 4-cresyl sulfate,δ2.35 (singlet). CVD, cardiovascular disease; DBP, diastolic blood pressure; LDL-C, LDL choles-terol; NMR, nuclear magnetic resonance; OmniCarb, OmniHeart carbohydrate-rich diet; OmniHeart, Optimal Macronutrient Intake Trial for Heart Health; OmniMFA, OmniHeart monounsaturated fat–rich diet; OmniProt, OmniHeart protein-rich diet; SBP, systolic blood pressure.
*P<0.05;†P<0.01;‡P<0.001.
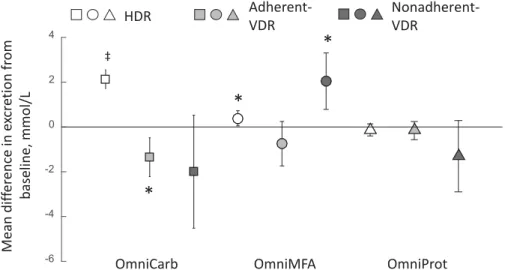
nonadherent) subgroups for OmniCarb. Differential metabolite patterns were also observed for different subgroups within the
OmniMFA (Figure 1).
Urinary metabolic variation relects interindividual differences in clinical responses
Discarding the nonadherent VDR group, we assessed the ef-fect of each diet, stratiied by HDR group compared to adherent-VDR group, on urinary electrolyte concentrations. We found sig-niicant overall changes in mean urinary sodium (decrease) and mean urinary potassium (increase) in the HDR groups for all
Om-niHeart diets when compared to baseline values (
Supplemen-tal Table 5). The mean changes in urinary electrolytes were of slightly greater magnitude when considering the subset of pre-hypertensive individuals within the HDR groups for sodium: –31.3 mmol/d (OmniCarb), –44.9 mmol/d (OmniMFA), and –35.9 mmol/d (OmniProt); and potassium 26.4 mmol/d (Omni-Carb), 28.4 mmol/d (OmniMFA), and 24.7 mmol/d (OmniProt),
P<0.001 (data not shown). This general trend in mean urinary
sodium and potassium levels was apparent for the adherent-VDR groups but the changes from baseline level were insigniicant. With regard to the intercomparison between OmnniHeart diets, no systematic differences were observed in the electrolyte levels
with the exception of higher urinary sodium and phosphate lev-els being characteristic of the OmniProt-HDR when compared to
the OmniMFA-HDR group (P<0.01, data not shown). No
sys-tematic differences in electrolytes were expected as micronutri-ents such as potassium, sodium, calcium, and magnesium were indexed to the energy level from the diet for each participant (19).
We also investigated the changes in CVD risk factors
post-diet and found a signiicant (P<10−10) reduction in all HDR
diet groups when compared to the baseline for systolic and di-astolic BP, LDL cholesterol, and total cholesterol. Addition-ally, the reduction in serum triglyceride concentrations was sig-niicant for the OmniProt-HDR group; and HDL cholesterol
for the OmniCarb-HDR and OmniProt-HDR groups,P<0.05
(Figure 2). High-risk individuals such as those who were hy-pertensive or those with nonoptimal lipid proiles in the HDR groups showed greater reduction in these CVD risk factors
than low-risk individuals (Supplemental Figure 2). For all
the VDR groups, a dampened reduction in CVD risk fac-tors was generally observed when compared to the
corre-sponding HDR comparator groups (Figure 2). A signiicant
(P<0.05) reduction in systolic and diastolic BP was observed
in both the adherent- and nonadherent-OmniMFA-VDR and the non-adherent-OmniProt-VDR groups; whilst the adherent- and
Mean dif fer ence in e xcr e tion fr om baseline, mmol/L -6 -4 -2 0 2 4 ‡
*
*
*
OmniCarb OmniMFA OmniProt
HDR
Adherent-VDR
Nonadherent-VDR
FIGURE 1 The observed mean differences in excretion for hippurate between HDR and adherent- and nonadherent-VDR groups when OmniHeart diets and their corresponding baseline spectra were compared. Open square, OmniCarb-HDR (n=137); light-grey closed square, adherent-OmniCarb-VDR (n=6); dark-grey closed square, nonadherent-OmniCarb-VDR (n=15); open circle, OmniMFA-HDR (n=127); light-grey closed circle, adherent-OmniMFA-VDR (n=10); dark-grey closed circle, nonadherent-OmniMFA-VDR (n=21); open triangle, OmniProt-HDR (n=113); light-grey closed triangle, adherent-OmniProt-VDR (n=10); dark-grey closed triangle, nonadherent-OmniProt-VDR (n=35). Error bars indicate 95% CIs. Signiicantttest comparison between baseline and post OmniHeart diets:*P<0.05;‡P<10−10. HDR, homogeneous dietary response; OmniCarb, OmniHeart carbohydrate-rich diet; OmniHeart, Optimal Macronutrient Intake Trial for Heart Health; OmniMFA, OmniHeart monounsaturated fat–rich diet; OmniProt, OmniHeart protein-rich diet; VDR, variable dietary response.
non-adherent-OmniProt-VDR groups also generally showed sig-niicant reductions for LDL, HDL, and total cholesterol al-though the magnitude of the change in CVD risk factors was generally more variable than that observed for the corre-sponding HDR groups. The observed lack of dietary-induced clinical beneit in the adherent-VDR groups may be partially
due to the reduced sample size (n < 10) following
stratiica-tion of the cohort. In addistratiica-tion to the observastratiica-tion that HDR groups of all 3 OmniHeart diets generally elicited a reduc-tion in CVD risk factors when compared to typical Ameri-can diets, we also found the HDR-OmniProt group generally showed a larger overall reduction in CVD risk factors when compared to the HDR-OmniMFA and HDR-OmniCarb groups (Supplemental Figure 3).
Stratiication of individual response based on urinary metabolic phenotypes
From a cohort of 158 individuals, who partook in all 3 dietary interventions, we were able to stratify individuals according to diet-response speciic urinary phenotypes: corresponding to those
who demonstrated: HDR to all 3 diets (n=95, 60.1%; Group 1);
HDR to 2 diets but VDR to 1 diet (n =35, 22.2%; Group 2);
HDR to only 1 diet but VDR to 2 diets (n=22, 13.9%; Group 3);
non-adherent-VDR to all 3 diets (n=4, 2.5%; Group 4); and mix
of nonadherent- and adherent-VDR to all 3 diets (n=2, 1.3%;
Group 5). Moreover, we were able to further sub-stratify indi-viduals in the VDR groups that demonstrated a dampened clin-ical response into those participants that were: (a) adherent to diets but showed differences in metabolic phenotypes from the majority of participants (including gut-microbial co-metabolites;
n= 12, 7.6%); (b) nonadherent to≥1 diet (n= 40, 25.3%);
or (c) a combination of the 2 (n=11, 7.0%); seeTable 3. We
found that individuals consistently classiied as HDR for all 3 OmniHeart diets generally manifested a greater reduction in CVD risk factors than those that were classiied as HDR for just 1 or 2
of the OmniHeart diets (Supplemental Figure 4).
DISCUSSION
We show that the majority, but not all, of the participants re-sponded similarly in terms of their expressed metabolic pheno-type to a particular diet and that each of the 3 diets had a distinct effect on the metabolism. However, regardless of the macronu-trient differences between the 3 OmniHeart diets and the diet-speciic impact on the metabolic proile, the majority of partic-ipants (60.1%), demonstrated post-diet improvement in clinical risk factors for CVD. We applied an agnostic multivariate sta-tistical tool to identify participants who showed a coherent bio-chemical response (HDR) to each of the diets and subdivided the data-set into high- and low-risk individuals based on their BP sta-tus or lipid proiles. Although both groups demonstrated a co-herent biochemical response irrespective of the CVD risk status, the high-risk groups generally demonstrated a larger reduction in CVD risk factors than low-risk individuals. Our results thus demonstrate that manipulation of dietary macronutrient content, without alteration of caloric intake and body weight, can elicit co-herent changes in metabolic proiles and contribute to beneicial effects on both BP levels and lipid proiles.
Notably, we identiied 2 gut microbial-host co-metabolites as-sociated with BP: phenylacetylglutamine and 4-cresyl sulfate, de-riving from phenylalanine and tyrosine, respectively, resulting from bacterial putrefaction of protein in the distal colon. The gut microbiota, in particular Firmicutes and Bacteroidetes, can adapt
to dietary changes and induce changes in host metabolism (35):
an increase of Firmicutes-to-Bacteroidetes ratio has been
-40 -30 -20 -10 0 10 20 30 40 Mean Differnce, mg/dl -100 -50 0 50 100 Mean Differnce, mg/dl -6 -4 -2 0 2 4 Mean Differnce, mg/dl -30 -20 -10 0 10 20 Mean Differnce, mg/dl -12 -10 -8 -6 -4 -2 0 2 Mean Differnce, mm Hg -20 -15 -10 -5 0 5 Mean Differnce, mm Hg
‡
‡
‡
*
*
†
(A) (B) (C) (D) (E) (F)‡
‡
‡
*
*
†
‡
‡
‡
* *
*
*
* *
*
*
‡
‡
‡
*
*
†
Mean dif fer ence SBP , mmHg Mean dif fer ence DBP , mmHg Mean dif fer ence LDL , mg /dL Mean dif fer ence HDL , mg /dL Mean dif fer ence trigly cerides, mg /dL Mean dif fer ence t o ta l choles ter ol , mg /dLOmniCarb OmniMFA OmniProt OmniCarb OmniMFA OmniProt
OmniCarb OmniMFA OmniProt OmniCarb OmniMFA OmniProt
OmniCarb OmniMFA OmniProt OmniCarb OmniMFA OmniProt
HDR Adherent-VDR Nonadherent-VDR
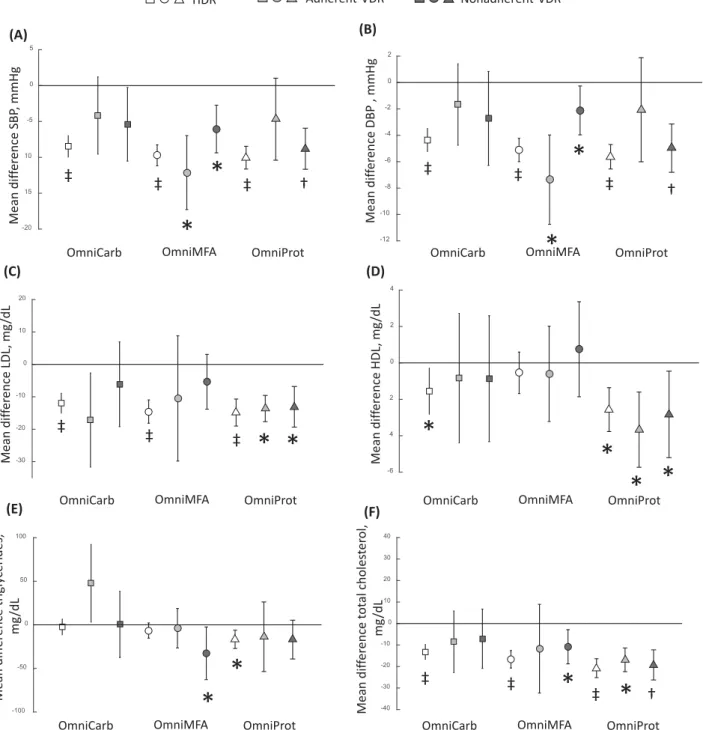
FIGURE 2 Key observations for changes in the cardiovascular disease risk factors showing differences in HDR and VDR groups for the comparisons between each OmniHeart diet and baseline corresponding to the changes in systolic BP (A), diastolic BP (B), LDL cholesterol (C), HDL cholesterol (D), triglycerides (E), and total cholesterol (F). Open square, OmniCarb-HDR (n=137); light-grey closed square, adherent-OmniCarb-VDR (n=6); dark-grey closed square, nonadherent-OmniCarb-VDR (n=15); open circle, OmniMFA-HDR (n=127); light-grey closed circle, adherent-OmniMFA-VDR (n=10); dark-grey closed circle, nonadherent-OmniMFA-VDR (n=21); open triangle, OmniProt-HDR (n=113); light-grey closed triangle, adherent-OmniProt-VDR (n=10); dark-grey closed triangle, nonadherent-OmniProt-VDR (n=35). Error bars indicate 95% CIs. Missing data include LDL cholesterol (n=2 for OmniMFA-VDR, OmniProt-VDR, OmniMFA-HDR, OmniProt-HDR andn=3 for OmniCarb-HDR), HDL cholesterol (n=1 for OmniMFA-VDR and OmniProt-VDR), triglycerides (n=1 for OmniMFA-VDR and OmniProt-VDR), and total cholesterol (n=1 for OmniMFA-VDR and OmniProt-VDR). Signiicantttest comparison between baseline and post-OmniHeart diets:*P<0.05;†P<10−5;‡P<10−10. DBP, diastolic blood pressure; HDR, homogeneous dietary response; OmniCarb, OmniHeart carbohydrate-rich diet; OmniHeart, Optimal Macronutrient Intake Trial for Heart Health; OmniMFA, OmniHeart monounsaturated fat–rich diet; OmniProt, OmniHeart protein-rich diet; VDR, variable dietary response.
TABLE 3
Stratiication by urinary phenotypes1
Summary of sub-phenotypes N %
Group 1: HDR to all 3 diets 95 60.1
Group 2: HDR to 2 diets but VDR to 1 diet 35 22.2
(a) Nonadherent-VDR to the other diet 25 15.8
(b) Adherent-VDR to the other diet 10 6.3
Group 3: HDR to 1 diet but VDR to 2 diets 22 13.9
(a) Nonadherent-VDR to the other 2 diets 11 7.0
(b) Adherent-VDR to the other 2 diets 2 1.2
(c) Mixed response—nonadherence-VDR to 1 diet and adherent-VDR to the other diet 9 5.7
Group 4: Nonadherent-VDR to all 3 diets 4 2.5
Group 5: Mix of nonadherent and adherent to all 3 diets 2 1.3 1Individuals were stratiied based on diet-speciic urinary phenotypes. HDR, homogeneous dietary response; VDR, variable dietary response.
have manipulated gut microbiota balance via probiotic
admin-istration with consequent beneicial effects on BP levels (37).
More recently, blood concentrations of phenylacetylglutamine were found to be strongly anti-correlated with BP, consistent with our results, and with carotid-femoral pulse-wave velocity, a
mea-sure of aortic stiffness (38). Although 4-cresyl sulfate has never
been formally linked to BP, its dietary excretion has been shown
to be highly correlated with that of phenylacetylglutamine (16).
The association between gut-microbial co-metabolites and BP is further evidenced in the direct association we found between BP and hippurate, originating from the conversion of benzoic acid
by gut microlora via the shikimate pathway (39). In contrast to
our results, hypertensive rats showed an anti-correlation between
hippurate and BP (40) but interpolation from animal data to
hu-man must be performed with care due to the differences in gut microbiomes between species. An inverse association between excretion of hippurate and BP has been reported in humans but this association was not signiicant after adjusting for BMI,
alco-hol intake, and urinary excretion of sodium and potassium (41).
A controlled feeding study by Wu et al. (35) showed that changes
in the gut microbiome occurred within 24 h of initiating a change in diet and that BMI and weight loss can also inluence the gut microbiome composition. However, in our dietary intervention study, all participants consumed a consistent healthy dietary pat-tern for 6 wk and maintained their body weight, with micronu-trients being indexed to the energy level of their diets. Our data, therefore, suggest modulation of diets can affect gut microbiome activity and that this may lead to a direct effect on BP regulation.
We observed an inverse association of N
-methyl-2-pyridone-5-carboxamide (tryptophan–NAD metabolite)
and BP. Bartus et al. (42) showed that ingestion of
1-methylnicotinamide in hypertriglyceridemic rats resulted
in an increase of 1-methylnicotinamide and its
metabo-lites such as N-methyl-2-pyridone-5-carboxamide and found
that ingestion of 1-methylnicotinamide in both the
dia-betic and hypertriglyceridemic rats can ameliorate the ni-tric oxide-dependent vasodilation, a surrogate marker for
atherosclerosis. Others have found that 1-methylnicotinamide
demonstrates anti-thrombotic activity (43). Our indings
fur-ther support the beneicial impact of N
-methyl-2-pyridone-5-carboxamide on CVD health. We suggest the tryptophan–NAD pathway may offer a new target for pharmacological treatment of hypertension.
We also conirmed the association of dietary markers with BP including: a direct association between BP and carnitine (a marker for protein ingestion); and an inverse association with proline-betaine (citrus fruit ingestion). Our results are consistent with previous studies linking hypertension with blood
concen-tration of carnitine (44) and variations in BP following carnitine
treatment in rats (45). Similarly our results support the previously
postulated beneit of citrus fruit intake in reduction of BP (34).
Speciically for the OmniProt diet, despite the increased excre-tion of carnitine, a marker which was linked to higher BP, over-all beneicial reductions in CVD risk factors (both BP levels and lipid proiles) were elicited and these beneits persisted for those who were considered as typical (HDR) as well as variable (VDR) responders. The speciic mechanisms for this remain unclear al-though it may be hypothesized that the altered large-bowel mi-crobiome following protein-rich dietary intervention may play a signiicant role.
We investigated our data stratiied by responders (HDR groups) and nonresponders (VDR groups) to ascertain whether the lack of demonstrated response was purely due to poor adher-ence to diet. We used a marker of citrus fruits, proline-betaine, as a proxy for dietary adherence to OmniHeart diets, as participants were given citrus fruits as part of their diets. Using the level of
proline-betaine excretion at<95% CI of the HDR groups as a
cut-off, we estimated that nonadherence contributed to the dampened clinical responses for 9.5–22.2% of the participants, depending on the type of OmniHeart diet. These nonadherence values are
considerably higher than the<5% nonadherence estimated from
the self-reported data from this study (4) and provided an
addi-tional objective measure to the mean urine urea nitrogen mea-surements, relecting protein intake, which was highest on the protein-rich diet. Our modeling strategy thus provided an objec-tive method for classiication of individuals in the VDR groups as nonadherent to each of the OmniHeart diets. The remaining dis-crepancy in metabolic response in individuals showing good dietary adherence was mainly attributable to variation in the ex-cretion of gut microbial metabolites (7.6%). These results are
consistent with indings from a recent study by Zeevi et al. (46)
who showed interindividual differences in glycemic response to foods and that these were correlated with differences in the com-position of the microbiome.
As a feeding study, this study has several strengths including: the provision of all meals to participants where their body weights
were held constant throughout the feeding periods, thereby re-moving the confounding effect of weight loss; the inclusion of 24-h urine collection; and the randomized cross-over design, which all add rigor to the study. Further, we have included in-dividuals from high CVD risk groups such as African American
(∼50%) and prehypertensive patients (∼80%), which
strength-ens the general applicability of our stratiication pipeline, al-though we recognize a large proportion of our participants was either overweight or obese and therefore not relective of the general population. However, this relects the higher incidence of obesity among the African American population. Since, by design, participants’ weight remained the same throughout the study, our models were not adjusted for BMI. We also did not adjust for socioeconomic status based on previous indings in a large-scale cross-sectional study, which demonstrated that the inverse association with BP was explained mostly by dietary differences (47).
Our study represents one of the largest dietary interventions of its kind where many prior nutritional metabolic phenotyping studies have typically involved a small number of participants
(N<25) (48,49). In this study, we used food-frequency
ques-tionnaires to describe participants’ food intake during the screen-ing visit (baseline) and this information was used to estimate the average intended food intake to maintain the participants’ body weight throughout the isocaloric feeding periods. However, one limitation is that we were unable to perform more detailed anal-ysis on individual dietary components and the dose–response re-lation with BP. An additional limitation of the current study was the use of NMR spectroscopy as the sole method of metabolic proiling. Although the robustness of the technique is advanta-geous for generating high-quality data, mass spectrometry would offer better sensitivity and selectivity and may have identiied fur-ther candidate biomarkers relating to BP. Nonetheless, we were able to uncover a number of biomarkers related to BP and these biomarkers were structurally authenticated.
In this global proiling study, we opted to use urine as our choice of bioluid as urine constitutes a rich source of informa-tion encompassing the inluence of dietary and gut microbiota.
We and others (41,50) have successfully identiied urinary
dis-criminatory metabolites related to BP. However, future studies should validate our indings by the use of urine specimens col-lected from independent epidemiological studies. Further to val-idating the candidate biomarkers related to dietary modulation of BP, a series of in vivo studies to establish causality would be
necessary. For example, Menni et al. (51) have shown a possible
causal relation between hexadecanedioate and BP using rodent models.
Our strategy illustrates the feasibility of adopting a rational stratiication approach for diabetologists, cardiologists, or dieti-tians to identify individuals’ nonadherence to diets and to opti-mize clinical responses to therapy. Extending this concept, we can envisage that further characterization of interindividual responses to healthy diets as determined by an individual’s phenotypic pat-terns and further determining an individual’s longitudinal pheno-typic stability prior to a healthy dietary intervention would need to be developed for the identiication of latent sub-phenotypes. This may confer a public health beneit with potential to provide a personalized approach to dietary recommendations aimed at optimizing prevention of CVD and related disorders.
In conclusion, variation in metabolic phenotypes in response to speciic healthy diets may hold clues as to the mechanisms underlying interindividual variations in response to dietary mod-ulation and points to the potential importance of the gut micro-biome in accounting for differences in dietary response and the subsequent impact on BP. The worklow presented here provides a clinically actionable framework to develop tailored dietary in-terventions designed to reduce BP and other CVD risk factors.
We thank T. Yap for her contribution to the sample preparation for NMR analyses. This manuscript was prepared using OmniHeart research materials obtained from the National Heart, Lung, and Blood Institute (NHLBI) Biologic Specimen and Data Repository Information Coordi-nating Center and does not necessarily relect the opinions or views of the NHLBI. The OmniHeart study description together with the study protocol and associated metadata are available from the Biologic Specimen and Data Repository Information Coordinating Center (BioLINCC) at
https://biolincc.nhlbi.nih.gov/static/studies/omniheart/MOP.pdf?link_time= 2017-07-02_01:45:33.646682. We thank the Imperial-National Institute for Health Research (NIHR) Clinical Phenome Centre, which is supported by the NIHR Imperial Biomedical Research Centre based at Imperial College Healthcare National Health Service (NHS) Trust and Imperial College London. The views expressed are those of the author(s) and not necessarily those of the NHS, the NIHR, or the Department of Health.
The authors’ responsibilities were as follows—RLL: designed metabolic proiling research; LJA: designed OmniHeart research; RLL and XZ: con-ducted the research and analyzed data; RLL, EH, and XZ: wrote the manuscript; RLL: had primary responsibility for inal content; EH and JKN: facilitated access to MRC-NIHR National Phenome Centre and related work; RLL, EH, and JKN: conducted metabolite identiication; and all authors: re-viewed and approved the inal manuscript. None of the authors reported any conlicts of interest.
REFERENCES
1. Global Disease Burden Risk Factor Collaborators. Global, regional, and national levels of maternal mortality, 1990–2015: a systematic analysis for the Global Burden of Disease Study 2015. Lancet 2016;388:1775– 812.
2. Ehret GB. Genome-wide association studies: contribution of genomics to understanding blood pressure and essential hypertension. Curr Hypertens Rep 2010;12:17–25.
3. Appel LJ, Moore TJ, Obarzanek E, Vollmer WM, Svetkey LP, Sacks FM, Bray GA, Vogt TM, Cutler JA, Windhauser MM, et al. A clinical trial of the effects of dietary patterns on blood pressure. DASH Collaborative Research Group. N Engl J Med 1997;336: 1117–24.
4. Appel LJ, Sacks FM, Carey VJ, Obarzanek E, Swain JF, Miller ER, Conlin PR, Erlinger TP, Rosner BA, Laranjo NM, et al. Effects of protein, monounsaturated fat, and carbohydrate intake on blood pressure and serum lipids: results of the OmniHeart randomized trial. JAMA 2005;294:2455–64.
5. Sleiman D, Al-Badri MR, Azar ST. Effect of Mediterranean diet in diabetes control and cardiovascular risk modiication: a systematic review. Front Public Health 2015;3:69.
6. Katan MB, Beynen AC, de Vries JH, Nobels A. Existence of consistent hypo- and hyperresponders to dietary cholesterol in man. Am J Epidemiol 1986;123:221–34.
7. Jacobs DR Jr., Anderson JT, Hannan P, Keys A, Blackburn H. Variability in individual serum cholesterol response to change in diet. Arteriosclerosis 1983;3:349–56.
8. Mata P, Ordovas JM, Lopez-Miranda J, Lichtenstein AH, Clevidence B, Judd JT, Schaefer EJ. ApoA-IV phenotype affects diet-induced plasma LDL cholesterol lowering. Arterioscler Thromb Vasc Biol 1994;14:884–91.
9. McCombs RJ, Marcadis DE, Ellis J, Weinberg RB. Attenuated hypercholesterolemic response to a high-cholesterol diet in subjects heterozygous for the apolipoprotein A-IV-2 allele. N Engl J Med 1994;331:706–10.
10. Masson LF, McNeill G, Avenell A. Genetic variation and the lipid response to dietary intervention: a systematic review. Am J Clin Nutr 2003;77:1098–111.
11. Denke MA. Review of human studies evaluating individual dietary responsiveness in patients with hypercholesterolemia. Am J Clin Nutr 1995;62:471S–7S.
12. Denke MA, Adams-Huet B, Nguyen AT. Individual cholesterol variation in response to a margarine- or butter-based diet: a study in families. JAMA 2000;284:2740–7.
13. Faith JJ, McNulty NP, Rey FE, Gordon JI. Predicting a human gut microbiota’s response to diet in gnotobiotic mice. Science 2011;333:101–4.
14. Minot S, Sinha R, Chen J, Li H, Keilbaugh SA, Wu GD, Lewis JD, Bushman FD. The human gut virome: inter-individual variation and dynamic response to diet. Genome Res 2011;21: 1616–25.
15. Pelantova H, Buganova M, Holubova M, Sediva B, Zemenova J, Sykora D, Kavalkova P, Haluzik M, Zelezna B, Maletinska L, et al. Urinary metabolomic proiling in mice with diet-induced obesity and type 2 diabetes mellitus after treatment with metformin, vildagliptin and their combination. Mol Cell Endocrinol 2016;431:88–100.
16. Heinzmann SS, Merriield CA, Rezzi S, Kochhar S, Lindon JC, Holmes E, Nicholson JK. Stability and robustness of human metabolic phenotypes in response to sequential food challenges. J Proteome Res 2012;11:643–55.
17. O’Keefe SJ, Li JV, Lahti L, Ou J, Carbonero F, Mohammed K, Posma JM, Kinross J, Wahl E, Ruder E, et al. Fat, ibre and cancer risk in African Americans and rural Africans. Nat Commun 2015; 6:6342.
18. Everett JR, Loo RL, Pullen FS. Pharmacometabonomics and personalized medicine. Ann Clin Biochem 2013;50(Pt 6):523–45. 19. Carey VJ, Bishop L, Charleston J, Conlin P, Erlinger T, Laranjo N,
McCarron P, Miller E, Rosner B, Swain J, et al. Rationale and design of the Optimal Macro-Nutrient Intake Heart Trial to Prevent Heart Disease (OMNI-Heart). Clin Trials 2005;2:529–37.
20. Rimm EB, Giovannucci EL, Stampfer MJ, Colditz GA, Litin LB, Willett WC. Reproducibility and validity of an expanded self-administered semiquantitative food frequency questionnaire among male health professionals. Am J Epidemiol 1992;135:1114–26; discussion 1127–36.
21. Beckonert O, Keun HC, Ebbels TM, Bundy J, Holmes E, Lindon JC, Nicholson JK. Metabolic proiling, metabolomic and metabonomic procedures for NMR spectroscopy of urine, plasma, serum and tissue extracts. Nat Protoc 2007;2:2692–703.
22. Dieterle F, Ross A, Schlotterbeck G, Senn H. Probabilistic quotient normalization as robust method to account for dilution of complex biological mixtures. Application in 1H NMR metabonomics. Anal Chem 2006;78:4281–90.
23. Zou X, Holmes E, Nicholson JK, Loo RL. Statistical HOmogeneous Cluster SpectroscopY (SHOCSY): an optimized statistical approach for clustering of (1)H NMR spectral data to reduce interference and enhance robust biomarkers selection. Anal Chem 2014;86:5308–15. 24. Posma JM, Garcia-Perez I, De Iorio M, Lindon JC, Elliott P, Holmes E,
Ebbels TM, Nicholson JK. Subset Optimization by Reference Matching (STORM): an optimized statistical approach for recovery of metabolic biomarker structural information from (1)H NMR spectra of bioluids. Anal Chem 2012;84:10694–701.
25. Cloarec O, Dumas ME, Craig A, Barton RH, Trygg J, Hudson J, Blancher C, Gauguier D, Lindon JC, Holmes E, et al. Statistical total correlation spectroscopy: an exploratory approach for latent biomarker identiication from metabolic1H NMR data sets. Anal Chem 2005;77:1282–9.
26. Westerhuis JA, van Velzen EJ, Hoefsloot HC, Smilde AK. Multivariate paired data analysis: multilevel PLSDA versus OPLSDA. Metabolomics 2010;6:119–28.
27. van Velzen EJ, Westerhuis JA, van Duynhoven JP, van Dorsten FA, Hoefsloot HC, Jacobs DM, Smit S, Draijer R, Kroner CI, Smilde AK. Multilevel data analysis of a crossover designed human nutritional intervention study. J Proteome Res 2008;7:4483–91.
28. Trygg J, Wold S. O2-PLS, a two-block (X–Y) latent variable regression (LVR) method with an integral OSC ilter. J Chemom 2003;17:53–64. 29. Wishart DS, Tzur D, Knox C, Eisner R, Guo AC, Young N, Cheng D,
Jewell K, Arndt D, Sawhney S, et al. HMDB: the Human Metabolome Database. Nucleic Acids Res 2007;35(Database issue):D521–6.
30. Heinzmann SS, Brown IJ, Chan Q, Bictash M, Dumas ME, Kochhar S, Stamler J, Holmes E, Elliott P, Nicholson JK. Metabolic proiling strategy for discovery of nutritional biomarkers: proline betaine as a marker of citrus consumption. Am J Clin Nutr 2010;92:436–43. 31. Stella C, Beckwith-Hall B, Cloarec O, Holmes E, Lindon JC, Powell J,
van der Ouderaa F, Bingham S, Cross AJ, Nicholson JK. Susceptibility of human metabolic phenotypes to dietary modulation. J Proteome Res 2006;5:2780–8.
32. Edmands WM, Beckonert OP, Stella C, Campbell A, Lake BG, Lindon JC, Holmes E, Gooderham NJ. Identiication of human urinary biomarkers of cruciferous vegetable consumption by metabonomic proiling. J Proteome Res 2011;10:4513–21.
33. May DH, Navarro SL, Ruczinski I, Hogan J, Ogata Y, Schwarz Y, Levy L, Holzman T, McIntosh MW, Lampe JW. Metabolomic proiling of urine: response to a randomised, controlled feeding study of select fruits and vegetables, and application to an observational study. Br J Nutr 2013;110:1760–70.
34. Lloyd AJ, Beckmann M, Fave G, Mathers JC, Draper J. Proline betaine and its biotransformation products in fasting urine samples are potential biomarkers of habitual citrus fruit consumption. Br J Nutr 2011;106:812–24.
35. Wu GD, Chen J, Hoffmann C, Bittinger K, Chen YY, Keilbaugh SA, Bewtra M, Knights D, Walters WA, Knight R, et al. Linking long-term dietary patterns with gut microbial enterotypes. Science 2011;334:105– 8.
36. Yang T, Santisteban MM, Rodriguez V, Li E, Ahmari N, Carvajal JM, Zadeh M, Gong M, Qi Y, Zubcevic J, et al. Gut dysbiosis is linked to hypertension. Hypertension 2015;65:1331–40.
37. Khalesi S, Sun J, Buys N, Jayasinghe R. Effect of probiotics on blood pressure: a systematic review and meta-analysis of randomized, controlled trials. Hypertension 2014;64:897–903.
38. Menni C, Mangino M, Cecelja M, Psatha M, Brosnan MJ, Trimmer J, Mohney RP, Chowienczyk P, Padmanabhan S, Spector TD, et al. Metabolomic study of carotid-femoral pulse-wave velocity in women. J Hypertens 2015;33:791–6; discussion 6.
39. Pero RW. Health consequences of catabolic synthesis of hippuric acid in humans. Curr Clin Pharmacol 2010;5:67–73.
40. Akira K, Masu S, Imachi M, Mitome H, Hashimoto T. A metabonomic study of biochemical changes characteristic of genetically hypertensive rats based on (1)H NMR spectroscopic urinalysis. Hypertens Res 2012;35:404–12.
41. Holmes E, Loo RL, Stamler J, Bictash M, Yap IKS, Chan Q, Ebbels T, De Iorio M, Brown IJ, Veselkov KA, et al. Human metabolic phenotype diversity and its association with diet and blood pressure. Nature 2008;453:396–400.
42. Bartus M, Lomnicka M, Kostogrys RB, Kazmierczak P, Watala C, Slominska EM, Smolenski RT, Pisulewski PM, Adamus J, Gebicki J, et al. 1-methylnicotinamide (MNA) prevents endothelial dysfunction in hypertriglyceridemic and diabetic rats. Pharmacol Rep 2008;60:127– 38.
43. Chlopicki S, Swies J, Mogielnicki A, Buczko W, Bartus M, Lomnicka M, Adamus J, Gebicki J. 1-methylnicotinamide (MNA), a primary metabolite of nicotinamide, exerts anti-thrombotic activity mediated by a cyclooxygenase-2/prostacyclin pathway. Br J Pharmacol 2007;152:230–9.
44. Mels CM, Schutte AE, Erasmus E, Huisman HW, Schutte R, Fourie CM, Kruger R, Van Rooyen JM, Smith W, Malan NT, et al. L-carnitine and long-chain acylcarnitines are positively correlated with ambulatory blood pressure in humans: the SABPA study. Lipids 2013; 48:63–73.
45. Rauchova H, Dobesova Z, Drahota Z, Zicha J, Kunes J. The effect of chronic L-carnitine treatment on blood pressure and plasma lipids in spontaneously hypertensive rats. Eur J Pharmacol 1998;342:235–9. 46. Zeevi D, Korem T, Zmora N, Israeli D, Rothschild D, Weinberger
A, Ben-Yacov O, Lador D, Avnit-Sagi T, Lotan-Pompan M, et al. Personalized nutrition by prediction of glycemic responses. Cell 2015;163:1079–94.
47. Stamler J, Elliott P, Appel L, Chan Q, Buzzard M, Dennis B, Dyer AR, Elmer P, Greenland P, Jones D, et al. Higher blood pressure in middle-aged American adults with less education—role of multiple dietary factors: the INTERMAP study. J Hum Hypertens 2003; 17:655–775.
48. Bondia-Pons I, Canellas N, Abete I, Rodriguez MA, Perez-Cornago A, Navas-Carretero S, Zulet MA, Correig X, Martinez JA.
Nutri-metabolomics: subtle serum metabolic differences in healthy subjects by NMR-based metabolomics after a short-term nutritional intervention with two tomato sauces. OMICS 2013;17: 611–18.
49. Lai S, Molino A, Coppola B, De Leo S, Tommasi V, Galani A, Migliaccio S, Greco EA, Gnerre Musto T, Muscaritoli M. Effect of personalized dietary intervention on nutritional, metabolic and vascular indices in patients with chronic kidney disease. Eur Rev Med Pharmacol Sci 2015;19:3351–9.
50. Hanson M, Zahradka P, Taylor CG, Aliani M. Identiication of urinary metabolites with potential blood pressure-lowering effects in lentil-fed spontaneously hypertensive rats. Eur J Nutr 2016: 1–12, doi:10.1007/s00394-016-1319-5.
51. Menni C, Graham D, Kastenmuller G, Alharbi NH, Alsanosi SM, McBride M, Mangino M, Titcombe P, Shin SY, Psatha M, et al. Metabolomic identiication of a novel pathway of blood pressure regulation involving hexadecanedioate. Hypertension 2015; 66:422–9.