© 2015 International Monetary Fund
FINLAND
FISCAL TRANSPARENCY EVALUATION
This Fiscal Transparency Evaluation for Finland was prepared by a staff team of the International Monetary Fund. It is based on the information available at the time it was completed in November 2014.
Copies of this report are available to the public from International Monetary Fund Publication Services
PO Box 92780 Washington, D.C. 20090 Telephone: (202) 623-7430 Fax: (202) 623-7201 E-mail: [email protected] Web: http://www.imf.org
Price: $18.00 per printed copy
International Monetary Fund
Washington, D.C.
Fiscal Affairs Department and Statistics Department
FINLAND
FISCAL TRANSPARENCY EVALUATION
February 2015
2 INTERNATIONAL MONETARY FUND
CONTENTS
Glossary __________________________________________________________________________________________ 5 Preface ___________________________________________________________________________________________ 6 EXECUTIVE SUMMARY __________________________________________________________________________ 7 I. FISCAL REPORTING __________________________________________________________________________ 13A. Coverage of Fiscal Reports ____________________________________________________________________ 15 B. Frequency and Timeliness of Fiscal Reporting _________________________________________________ 25 C. Quality of Fiscal Reports ______________________________________________________________________ 25 D. Integrity of Fiscal Reports _____________________________________________________________________ 29 E. Conclusions and Recommendations __________________________________________________________ 30
II. FISCAL FORECASTING AND BUDGETING ___________________________________________________ 33
A. Comprehensiveness___________________________________________________________________________ 34 B. Orderliness ____________________________________________________________________________________ 43 C. Policy Orientation _____________________________________________________________________________ 45 D. Credibility _____________________________________________________________________________________ 49 E. Conclusions and Recommendations __________________________________________________________ 52
III. FISCAL RISK ANALYSIS AND MANAGEMENT _____________________________________________ 55
A. Disclosure and Analysis _______________________________________________________________________ 56 B. Risk Management _____________________________________________________________________________ 60 C. Coordination __________________________________________________________________________________ 73 D. Conclusions and Recommendations __________________________________________________________ 77
BOX
1. Accounting for Pension Assets and Liabilities ________________________________________________________ 21
FIGURES
1.1. Public Sector Balance Sheet and Coverage in Fiscal Reports _______________________________________ 17 1.2. Public Sector Employees Gross Pension Liabilities in Selected Countries __________________________ 18 1.3. Public Sector Balance Sheet and Coverage in Fiscal Reports _______________________________________ 19 1.4. Public Sector Gross Liabilities in Selected Countries _______________________________________________ 20 1.5. Public Sector Net Worth in Selected Countries _____________________________________________________ 20 1.6. Tax Expenditures Selected Countries _______________________________________________________________ 24 1.7. Tax Expenditures by Sector _________________________________________________________________________ 24
INTERNATIONAL MONETARY FUND 3 1.8. Stock – Flow Reconciliation of the Financial Balance Sheet, 2013 __________________________________ 27 1.9. Size of Historical Data Revisions Under ESA 1995 __________________________________________________ 28 1.10. Size of Historical Data Revisions Due to the Implementation Of ESA 2010 ______________________ 28 2.1. Own Source Revenues ______________________________________________________________________________ 36 2.2. Average Medium-Term Real GDP Growth Forecast Errors, 2000-13 _______________________________ 37 2.3. Absolute Medium-Term Real Gdp Growth Forecast Errors, 2000-13 ______________________________ 37 2.4. Average Medium-Term General Government Expenditure Forecast Errors, 2000-13 ______________ 40 2.5. Average Medium-Term General Government Revenue Forecast Errors, 2000-13 _________________ 40 2.6. Investment Spending, 2002-13 _____________________________________________________________________ 42 2.7. Average Variation In Expenditures (Budgetary Central Government), 2002-13 ____________________ 44 2.8. Variation In Expenditures For Budgetary Central Government, 2010-13 ___________________________ 50 3.1. Volatility Of Real GDP, Western Europe, Ten Years To 2013 _______________________________________ 57 3.2. Volatility Of Real GDP, Nordic Countries, 1990–2013 ______________________________________________ 57 3.3. Volatility Of Real GDP And Government Revenue, Advanced Economies _________________________ 58 3.4. Long-Term Fiscal Projections, 2012-60 _____________________________________________________________ 59 3.5. Required Adjustment in Taxes and/or Spending for Sustainability, 2012 __________________________ 60 3.6. On-Balance-Sheet Financial Assets and Liabilities of General Government ________________________ 61 3.7. Financial Assets and Liabilities of General Government, June 2014 ________________________________ 62 3.8. Guarantees of Central Government, 2005-14:Q2 ___________________________________________________ 64 3.9. Central Government’s Guarantees by Sector, June 2014 ___________________________________________ 64 3.10. Guarantees of General Government, Europe, 2013 _______________________________________________ 65 3.11. Cumulative Investment in PPPs, 1990–2011 _______________________________________________________ 66 3.12. Bank Assets in Selected Advanced Economies, 2012 _____________________________________________ 68 3.13. House Prices, 1981–2014 __________________________________________________________________________ 70 3.14. Bank Equity Capital as Percentage of Assets, 2012 _______________________________________________ 70 3.15. Distance to Default of Average Finnish Bank, 1998–2014.Q1 _____________________________________ 71 3.16. Value of Subsoil Assets, Members of European Union, 2005 _____________________________________ 72 3.17. Government Compensation for the Costs of Floods and Crop Damage, 1995–2013 ____________ 73 3.18. Spending of Local Governments, Unitary Statesin the OECD _____________________________________ 74 3.19. Liabilities of Local Government, 1998-2014: Q2___________________________________________________ 74 3.20. Debt-To-Revenue Ratio by Municipality, 2013 ____________________________________________________ 75 3.21. Liabilities of Most-Indebted State-Owned Enterprises, 2013 _____________________________________ 76
TABLES
0.1. Summary Assessment Against Fiscal Transparency Code __________________________________________ 11 0.2: Public Sector Financial Overview, 2013 _____________________________________________________________ 12 1.1. List of Reports _______________________________________________________________________________________ 14 1.2. Public Sector Institutional Compositions and Finances, 2013 ______________________________________ 16 1.3. Reconciliation National Balance and Net Borrowing/Lending According to ESA 2010 ____________ 23 1.4. Comparability of the On-Budget Balance and the Central Government Net ______________________ 30 1.5. Summary Assessment of Finland Fiscal Reporting _________________________________________________ 32 2.1. Fiscal Forecasting And Budget Documents _________________________________________________________ 34 2.2. Comparison Of Real Gdp Growth Forecasts, _______________________________________________________ 38
4 INTERNATIONAL MONETARY FUND
2.3. Comparison of Forecasts for General Government Deficit _________________________________________ 41 2.4. Investment Projects in the Budget 2015 ____________________________________________________________ 42 2.5. Fiscal Policy Objectives in Finland __________________________________________________________________ 46 2.6. Compliance Report for the Structural Balance _____________________________________________________ 47 2.7. Compliance with Fiscal Rules _______________________________________________________________________ 47 2.8. Selected Performance Information in the Budget 2014 for Ministry of Education and Culture ___ 48 2.9. Expenditure Forecast Reconciliation in the Stability Programme __________________________________ 51 2.10. Summary Assessment of Finland’s Fiscal Forecasting and Budgeting ____________________________ 54 3.1. Selected Reports Describing Fiscal Risks ___________________________________________________________ 55 3.2. Selected Specific Fiscal Risks: Gross Exposure In 2012/13 __________________________________________ 59 3.3. Banks’ Liabilities, 2013 ______________________________________________________________________________ 68 3.4. Summary Assessment For Fiscal Risks ______________________________________________________________ 79
INTERNATIONAL MONETARY FUND 5
Glossary
CG Central Government
CGSL Central Government Spending Limits COFOG Classification of Functions of Government EDP Excessive Deficit Procedures
EPC Economic Policy Council
ESA European System of National and Regional Accounts
EU European Union
FAD IMF Fiscal Affairs Department
GFSM Government Finance Statistics Manual
GG General Government
INTOSAI International Organization of Supreme Audit Institutions ISSAI International Standards of Supreme Audit Institutions
MoF Ministry of Finance
MTO Medium-term Objective
NAO National Audit Office
NETRA Finnish State Internet Reporting System
OECD Organization for Economic Cooperation and Development PPP Public-Private-Partnership
SGP Stability and Growth Pact
SDDS Special Data Dissemination Standards
STA IMF Statistics Department
Legend for Tables
Practice under Fiscal Transparency Code
Importance to Fiscal Management
LEVEL OF PRACTICE
Not Met Basic Good Advanced
LEVEL OF
IMPORTANCE
LEVEL OF PRACTICE
6 INTERNATIONAL MONETARY FUND
Preface
In response to a request by the Finnish authorities, a Fiscal Affairs Department (FAD) and Statistics Department (STA) mission comprising Torben Hansen (Head), Tim Irwin and Johann Seiwald (all FAD), and Majdeline El Rayess (STA), visited Helsinki during October 28 – November 10, 2014, to carry out a Fiscal Transparency Evaluation.
The mission met with Antti Rinne (Minister of Finance), Martti Hetemäki (Permanent Secretary), Jukka Pekkarinen (Director General), Hannu Mäkinen (Director General), Markus Sovala (Director General), and other staff of the Ministry of Finance. The mission also met with Kimmo Sasi (Chair of the Parliament Finance Committee), Tuomas Pöysti (Auditor General) and staff of the National Audit Office, Roope Uusitalo (Chairman of the Economic Policy Council), and Eero Heliövaara (Director General of the Ownership Steering Committee of the Prime Minister’s Office). In addition, the mission held meetings with executives and other representatives of the State Treasury, Statistics Finland, the Bank of Finland, the Financial Supervisory Authority, the Association of Finnish Local and Regional Authorities, Municipality Finance, the Municipal Guarantee Board, the Finnish Pension Alliance TELA, the Ministry of Environment, the Ministry of Agriculture and Forestry, and the Ministry of Transport and Communication.
The mission wishes to extend its appreciation to the Finnish authorities for their excellent cooperation and frank discussions during the mission. In particular, the mission wants to thank Sami Yläoutinen and Meri Obstbaum for organizing the mission schedule and for their close cooperation throughout the mission.
INTERNATIONAL MONETARY FUND 7
EXECUTIVE SUMMARY
Finland meets most of the principles of the Fiscal Transparency Code at good or advanced level. Some areas, notably related to the analysis and management of fiscal risks, are still rated as basic or below, but with a few exceptions the importance of these areas for fiscal management in Finland is relatively low. Table 0.1 below is a summary assessment of performance against the principles of the Fiscal Transparency Code ranked according to their relative importance for fiscal management in Finland. Overall, the Finnish authorities produce an impressive amount of data and information related to all three pillars of the Code.
Fiscal reporting in Finland is transparent and meets good or advanced practice in all areas (Section I). Key findings in this area include:
Fiscal reports consolidate the general government sector in line with ESA 2010 reporting standards, and cover roughly 80 percent of total public expenditures and revenue. They are prepared frequently, and in a timely manner, and include all reconciliations required under the Code;
Financial statements are published for all central government entities, but these are not consolidated into a single financial statement for central government;
General government balance sheets consolidate financial assets and liabilities, but exclude nonfinancial assets of some 77 percent of GDP, and pension liabilities related to government employees of some 100 percent of GDP. Although financial data on public corporations are published, there is no single report that presents a comprehensive view of the finances of the consolidated public sector as a whole;
Tax expenditures of 12 percent of GDP are high by international comparison, but disclosed on a regular basis; and
Fiscal statistics are compiled and disseminated in accordance with EU regulations and Special Data Dissemination Standards (SDDS), and financial statements of central government are audited without major qualifications by an independent supreme audit institution in line with International Organization of Supreme Audit Institutions (INTOSAI) standards.
Finland’s fiscal forecasting and budgeting practices meet advanced standards in most areas (Section II). Notably:
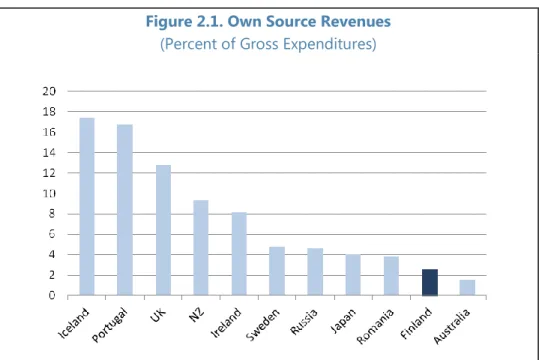
Central government budgets are relatively comprehensive, covering almost 90 percent of central government expenditures, and credible, with outturns only differing from budgeted totals by 2.5 percent of GDP on average. The budget includes authorizations for multi-annual commitments, and all material changes to the budget are approved by the legislature in supplementary budgets;
8 INTERNATIONAL MONETARY FUND
Finland has a well established and binding medium-term budget framework with multi-year spending limits covering about 80 percent of budgetary central government expenditures. However, tax expenditures, and expenditures by extrabudgetary funds are not included in these spending limits, thus creating a potential risk of circumvention;
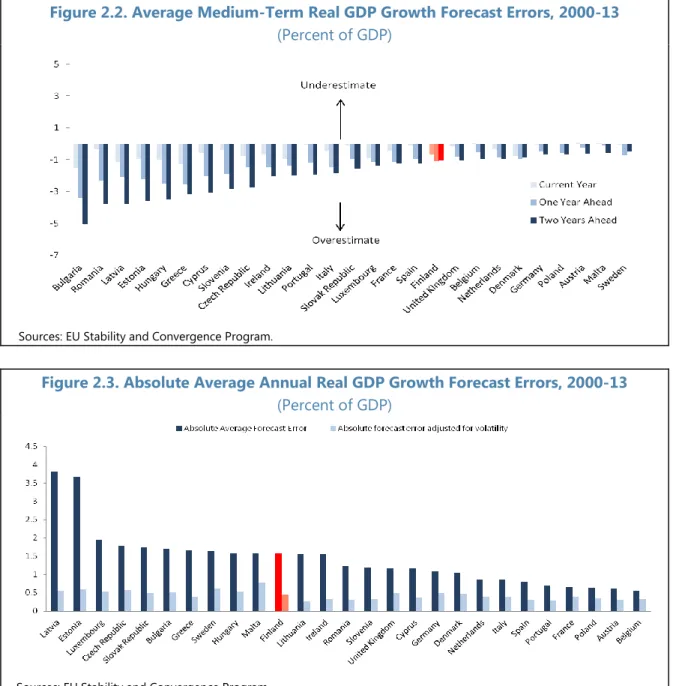
Macroeconomic forecasts are relatively accurate and unbiased while fiscal forecasts of revenue and expenditures, with forecast errors of 2.8 percent of GDP on average, are relatively inaccurate compared to other European countries. Changes to previous forecasts are transparently reconciled in fiscal reports;
Compliance with the rather large number of fiscal objectives and rules is assessed on a regular basis by the National Audit Office, but the government itself does not regularly report on all its objectives, and little explanation of the linkages between them is provided;
Public investment projects are subject to cost benefit analysis, but not all are made public before project selection, and they do not follow uniform guidelines; and
Budget documentation and annual reports of the government include comprehensive information on performance, targets, outputs, and outcomes, but these could be streamlined to focus on those indicators most relevant to strategic policy making. The government’s fiscal risk analysis and management meet good or advanced practice in only half the areas considered by the Code (Section III). Key findings in this area are:
The government reports the sensitivity of fiscal forecasts of deficit and debt to growth in GDP, but not to a wider range of macroeconomic variables, and it does not provide much information, such as fan charts, that indicate the extent of the uncertainty surrounding the forecasts;
Although information is available on various sources of specific fiscal risks, the government does not yet produce a single report that collects and summarizes this information. This makes it difficult to assess the relative importance of different risks and their likely
correlations. A combination of both significant assets and liabilities, which are managed on a portfolio-by-portfolio basis, makes the government’s net worth quite susceptible to fluctuations in market prices;
The Financial Supervisory Authority, and the European Central Bank together publish comprehensive reports on financial sector risks;
The stock of general government guarantees is among the largest in Western Europe, amounting to 24 percent of GDP, but all guarantees are authorized by the legislature and disclosed on a regular basis;
The budget and spending limits provides for various contingencies, the use of which is reported in budgets and supplementary budgets; and
Municipalities pose an important source of fiscal risk, with liabilities for the sector as a whole exceeding 13 percent of GDP, and a few municipalities having debt-to-revenue ratios of more than 100 percent. The law does not prevent individual municipalities from taking on
INTERNATIONAL MONETARY FUND 9 excessive debt and thereby creating spillover risks for the central government or other municipalities.
Table 0.2 presents a preliminary and partial estimate of Finland’s public sector for 2013 which shows that:
Public sector revenue and expenditures are 70.0 and 71.3 percent of GDP, respectively, and the fiscal balance (net lending/borrowing) is -1.3 percent of GDP (as opposed to -2.4 percent of GDP for general government);
Public assets constitute 241 percent of GDP, of which 88 percent of GDP are nonfinancial assets and 152 percent of GDP are financial assets;
Public sector liabilities are 212 percent of GDP, of which 99 percent of GDP is related to accrued pension liabilities for public sector employees;1 and
Net financial worth is -60 percent of GDP, but net worth, including nonfinancial assets, is a positive 29 percent of GDP.
This report makes eight recommendations aimed at enhancing the information-base for fiscal decision making and ensuring Finland remains at the forefront of international fiscal
transparency standards and practices. They are to:
Expand the institutional coverage of the consolidated central government financial
statements to include extrabudgetary funds and state-owned enterprises classified as central government entities;
Gradually develop fiscal statistics for the consolidated public sector including nonfinancial and financial assets and liabilities, composing pension liabilities;
Better align national fiscal objectives with European Union fiscal rules; strengthen the design and reporting of fiscal objectives by reporting annually on compliance with all fiscal policy objectives; and strengthen the medium-term budget framework by expanding reports on compliance with the spending limits to include reporting on tax expenditures and spending outside the spending limits;
Improve investment planning by consistently applying a set of general guidelines for cost-benefit analysis for all major investment projects, and publishing the results;
Streamline the number of performance objectives for each ministry and establish an annual quality review process led by the Ministry of Finance or the Prime Minister’s Office;
Include more analysis of risk in fiscal forecasts and projections by, in particular, reporting the sensitivity of fiscal forecasts to a wider range of variables and scenarios;
1 Accrued public sector pension liabilities for all pension schemes, including schemes for private sector employees, are estimated to be 295 percent of GDP. As the actual benefits are subject to legislation, the actual liabilities are somewhat uncertain.
10 INTERNATIONAL MONETARY FUND
Prepare a regular report on fiscal risks that incorporates macroeconomic risks as well as a range of other risks, including loan guarantees, callable capital, and indemnities; the government’s portfolio of financial assets and liabilities; the financial sector; and municipalities; and
Introduce measures to reduce the risks that municipalities create for the central government and/or other municipalities, by introducing in municipal accounts supplementary
information on Maastricht deficit and debt; strengthening fiscal coordination between central and local government; and strengthening controls over local governments’ borrowing.
INTERNATIONAL MONETARY FUND 11
Table 0.1. Finland: Summary Assessment against the Fiscal Transparency Code
LEVEL OF IMPORTANCE
LEVEL OF PRACTICE 1. Fiscal Reporting 2. Fiscal Forecasting and
Budgeting
3. Fiscal Risk Analysis And Management
HIGH IMPORTANCE
1.1 Coverage of Institutions 1.3 Medium-Term Budget
Framework 1.1 Macroeconomic Risks 1.2 Coverage of Stocks 3.1 Fiscal Policy Objectives 1.3 Long-Term Fiscal
Sustainability 1.3. Coverage of Flows 2.5 Financial-Sector Exposure
3.1 Sub-national Governments
MEDIUM IMPORTANCE
1.4. Coverage of Tax
Expenditures 1.2 Macroeconomic Forecasts 1.2 Specific Fiscal Risks 3.2 Internal Consistency 1.4 Investment Projects 2.2 Asset and Liability
Management 3.3 Historical Revisions 3.2 Performance Information 2.3 Guarantees
4.2 External Audit 4.2 Supplementary Budgets 3.2 Public Corporations 4.3 Comparability of Fiscal
Data 4.3 Forecast Reconciliation
LOW IMPORTANCE
2.1 Frequency of In-Year
Reporting 1.1 Budget Unity 2.1 Budgetary Contingencies 2.2 Timeliness of Annual
Financial Statements 2.1 Fiscal Legislation
2.4 Public-Private Partnerships 3.1 Classification 2.2 Timeliness of Budget
Documents 2.6 Natural Resources 4.1 Statistical Integrity 3.3 Public Participation 2.7 Environmental Risks
4.1 Independent Evaluation
LEGEND
LEVEL OF PRACTICE
Table 0.2: Finland: Public Sector Financial Overview, 2013
(Percent of GDP)
General Government Public Corporations
Central Gov't Social Security Funds Local Gov't Consoli-dation Total Non-financial Financial Central Bank Transactions Revenue 25.3 21.7 23.3 -14.5 55.7 14.9 0.4 0.3 -1.3 70.0 Expenditures 28.8 19.8 24.1 -14.5 58.1 14.1 0.1 0.2 -1.3 71.3 Balance -3.5 1.9 -0.8 0.0 -2.4 0.7 0.3 0.1 -1.3 Stocks Assets 56.2 82.5 61.7 -4.2 196.5 18.4 15.6 24.8 -13.6 241.2 Nonfinancial 25.8 0.9 49.5 0.0 76.6 12.3 0.0 0.1 0.0 88.5 Financial 30.4 81.6 12.1 -4.2 119.9 6.2 15.6 24.7 -13.6 152.7 Liabilities 54.0 101.6 13.4 -4.2 164.8 22.3 15.3 23.8 -13.6 212.5 Already recognized 54.0 2.2 13.4 -4.2 65.3 22.3 15.3 23.8 -13.6 113.1 Public Pensions 99.4 99.4 99.4
Net Financial Worth -23.6 -20.1 -1.2 0.0 -44.8 -16.1 0.4 1.0 -0.1 -59.9
Net Worth 2.1 -19.1 48.3 0.0 31.8 -3.9 0.4 1.0 -0.1 28.6
Memo items (percent of GDP):
Deficit of general government according to the EDP notifications -2.4 General government debt (Maastricht defintion) 56 Net financial worth of general government excluding pension liabilities 55 Private Pension Liabilities 196 Net Worth Including All Pensions -68 Sources: Statistics Finland, MoF, various financial statements and publications, and Staff estimates.
Consoli-dation
Public Sector
1/ The consolidation at the level of the public sector is an approximation based on available information and staff estimates. For transactions, the consolidation removes taxes, dividends, and interest. For stocks, the consolidation relates to equity, loans, and deposits.
2/ Estimates of pension liabilities are from the report on statutory pensions in Finland published by the Finnish Centre for Pensions.
3/ Data for nonfinancial public corporations are based on a sample of large corporations controlled by central government responsible for 85 percent of total assets. Data from financial statements have been adjusted to align with government finance statistics concepts. Also included are the liabilities of the public corporations controlled by the local government.
12 INT ERNA TIO NA L M O NET A RY F U ND FINL A ND
INTERNATIONAL MONETARY FUND 13
I. FISCAL REPORTING
1. This chapter assesses the quality of fiscal reporting in Finland against the principles set out in the Fiscal Transparency Code. It assesses the following dimensions:
Coverage of institutions, stocks, and flows;
Frequency and timeliness;
Quality of fiscal reporting; and
Integrity of fiscal reports.
2. Fiscal reports should provide a comprehensive, relevant, timely, and reliable overview of the government’s financial position and performance. To do so, fiscal reports, which include in-year budget execution reports, fiscal statistics, and annual financial statements, should:
Cover all institutional units engaged in fiscal activity for the whole public sector;
Record all assets and liabilities and all revenue, expenditure, financing, and other economic flows;
Be published in a frequent and timely manner;
Be classified according to international standards;
Reconcile the different balances calculated and have comparable data across reports; and
Be prepared by an independent agency (in the case of statistics) or scrutinized by an independent national audit institution (in the case of accounts).
3. Fiscal reporting in Finland is transparent and has many advanced features, but is somewhat fragmented. While an impressive amount of fiscal reports are produced and published in Finland (Table 1.1), and balance sheet data are available for various subsectors of the public sector, there is no report providing a comprehensive, consolidated view of the public sector. Fiscal reports consolidate general government in line with international standards, including EU
requirements. They are prepared frequently and in a timely manner and include all reconciliations required under the Code. Fiscal statistics are compiled and disseminated in accordance with the
European System of National and Regional Accounts 2010 (ESA 2010) and the Government Finance Statistics Manual 2001 (GFSM 2001) and its update, the GFSM 2014. Financial statements are audited by an independent supreme audit institution.
FINL
A
14 INTERNATIONAL MONETARY FUND
Table 1.1. Finland: List of Reports
GG = General Government; CG = Central Government; LG = Local Government; Rev = Revenue; Exp = Expenditures; Fin = Financing; Liab = Liabilities
Sectors Flows Stocks Basis Class Freq Date
The monthly bulletin for CG finances
and debt State Treasury CG Rev, Exp, Fin
Assets,
Debt Cash National Monthly 20 days
GG quarterly data Statistics Finland GG and
sub-sectors
Rev, Exp, Fin, and financial accounts
Part
Accrual ESA 2010 Quarterly 90 days
Central government guarantees Statistics Finland CG Contingent
liabilities Quarterly 60 days
Monthly data on public finances MoF CG, SS Rev, Exp, Fin Cash National Monthly 30 days
Fiscal Reports
EDP Notifications Statistics Finland GG Rev, Exp, and
reconciliation between the deficit and debt
Debt Part
Accrual ESA 2010 6 months
April and October Financial Statements
CG Annual Report Prime Minister's
Office CG
Rev, Exp, Fin, and effectiveness and performance data
National Yearly 4 months Financial statements of municipalities
and joint municipals boards Municipalities LG
Rev, EX, Fin, and
Budget proposal National Yearly 6 months Budget Reports
State budget proposal MoF CG Rev, Exp, Fin Cash National Yearly September
State supplementary budget
proposals MoF CG Rev, Exp, Fin Cash National Yearly
Several per year Budget proposals of municipalities
and joint municipal boards Municipalities LG Rev, Exp, Fin National Yearly
By the end of the year Forecasts
Economic Survey, Economic Bulletin MoF GG and
sub-sectors Rev, Exp, Fin
Part
Accrual ESA 2010 Yearly
Four per year
Stability Programme MoF GG and
sub-sectors Rev, Exp, Fin
Part
Accrual ESA 2010 Yearly April
Draft Budgetary Plan MoF October
Additional Reports
Statutory pensions in Finland Finnish Centre for Pensions
Pension Funds
Rev, Exp, Assets, and
Liab Accrual
Every two years Annual Report of the State's
Ownership Steering
Prime Minister's Office
Public Corporations
Rev, Exp, Assets, Liab,
and performance data Accrual Yearly YEAR-END REPORTS
INSTITUTIONS COVERAGE ACCOUNTING PUBLICATION
REPORT
INTERNATIONAL MONETARY FUND 15
A. Coverage of Fiscal Reports
1.1.1 Coverage of institutions (Good)
4. Fiscal reports in Finland consolidate all general government entities and report on each subsector. Statistics Finland is responsible for determining the institutional composition of the general government sector and its subsectors, as well as the wider public sector, and publishes quarterly and annual reports that consolidate revenue, expenditures, financing, financial assets, and financial liabilities for each subsector of general government. Data on financial and nonfinancial public corporations outside the general government sector are also published in various reports2 but are not consolidated into one comprehensive report covering the public sector.
5. Financial statements are produced for all central government entities, but these are not consolidated into a single financial statement for central government. Financial statements for budgetary central government, and for each of the extrabudgetary funds and state-owned enterprises that are classified as central government entities, are published in the Government’s Annual Report, but they are not consolidated. Non-consolidated financial statements are also published for all municipalities and joint municipal boards.
6. In 2013, the public sector in Finland comprised a total of 2,330 entities. Central government comprised 46 entities, including the Parliament, The Prime Minister’s Office, 12 line ministries (and their agencies), 10 extrabudgetary funds,3 14 universities, and 8 public corporations. Social security funds comprised 211 entities, of which 30 entities provide pension related benefits, and the rest provide non-pension social security benefits, such as sickness, unemployment, and disability benefits.4 The local government sector comprised 615 entities, including 320 municipalities and 150 municipal boards. There were 1,454 public corporations, of which almost 1,400 in areas such as real estate, energy supply, water supply, sewerage, and public transport were controlled by municipalities. Of 57 corporations controlled by central government, 53 were nonfinancial,5 and 4 were financial,6 including the Central Bank.
7. The recent reclassification of some public sector entities led to an increase in the 2013 general government deficit. With the adoption of ESA 2010 in 2013, 150 public corporations were reclassified into the local government subsector, and five public corporations and their affiliates into
2 Ownership Steering Department of the Prime Minister’s Office: “Annual Report of the State’s Ownership Steering,” and the annual reports of these corporations.
3 See discussion of extrabudgetary funds in Section II.
4 The decision to classify these as social security funds was taken in 1993 and has been reconfirmed by Eurostat in 1997.
5 The major nonfinancial corporations in terms of assets were Fortum, Finnair, Neste Oil, VR Group, and Itella. 6 The financial corporations included Finnvera, Finnish Industry Investment, and Municipality Finance PLC.
16 INTERNATIONAL MONETARY FUND
the central government subsector.7 In combination with changes in the treatment of some flows, such as interest flows related to swap and forward rate agreements, this led to an increase in the general government fiscal deficit in 2013 from 2.1 percent of GDP (based on ESA 1995) to 2.4 percent of GDP (based on ESA 2010).
8. Expanding the institutional coverage of fiscal reports to include public corporations, including the Central Bank, would have improved the overall fiscal balance in 2013 by 1.1 percent of GDP. The general government deficit in 2013 of 2.4 percent of GDP comprised deficits of central and local government of 3.5 and 0.8 percent of GDP, respectively, which were partly offset by a surplus of social security funds of 1.9 percent of GDP (Table 1.2). Public
corporations would however have added 15.6 percent of GDP to revenue, and 14.4 percent of GDP to expenditures, thus reducing net borrowing/lending to a negative of 1.3 percent of GDP. This is due to the positive performance of nonfinancial and financial public corporations.
Table 1.2. Finland: Public Sector Institutional Compositions and Finances, 2013
(Percent of GDP)
Sources: Statistics Finland, MoF, various financial statements and publications, and staff estimates.
*Inter-transfers, include grants, property income, taxes, and other transfers received from and paid to other public sector units.
7 (i) HAUS Finnish Institute for Public Management (Haus Kehittämiskeskus Oy); (ii) Aalto Universities Properties Ltd (Aalto-yliopistokiinteistöt Oy); (iii) Senate properties (Senaatti-kiinteistöt),(iv) Helsinki University Properties Ltd
(Helsingin Yliopistokiinteistöt Oy); and (v) University Properties of Finland Ltd (Suomen Yliopisotokiinteistöt Oy).
Number of
Entities Revenue Expenditure Net balance
Central Government (a) = (b) 46 25.3 28.8 -3.5
Budgetary and Extrabudgetary entities (b) 46 25.3 28.8 -3.5
Social Security Funds (c) 211 21.7 19.8 1.9
Local Government (d) 615 23.3 24.1 -0.8
Inter - General Government Transfers (e) -14.5 -14.5 0.0
General Government (f) = (a)+(c)+(d)+(e) 872 55.7 58.1 -2.4
Nonfinancial corporations (g) 1,454 14.9 14.1 0.7
Controlled by general government 53 14.9 14.1 0.7
Controlled by local government 1,401
Financial corporations (h)= (i)+(j) 4 0.7 0.3 0.4
Central Bank (i) 1 0.3 0.2 0.1
Others (j) 3 0.4 0.1 0.3
Inter - Public Sector Transfers (k) -1.3 -1.3 0.0
INTERNATIONAL MONETARY FUND 17
9. By European standards the public sector in Finland is relatively large, and 20 percent of expenditures are not accounted for in consolidated fiscal reports. In 2013, general
government expenditures accounted for 58.1 percent of GDP, of which social security funds accounted for 19.8 percent of GDP. Public sector expenditures, including the non-reported expenditures by public corporations of 14.4 percent of GDP, accounted for 71.3 percent of GDP. Figure 1.1 summarizes the distribution of public resources across the different subsectors of the public sector.
Figure 1.1. Finland: Public Sector Expenditures and Coverage in Fiscal Reports
Sources: Statistics Finland, various publications and reports, and staff estimates.
1.1.2 Coverage of Stocks (Advanced)
10. Data on assets and liabilities are published in various fiscal reports, but not consolidated into a single balance sheet to present a comprehensive view of the general government or the wider public sector net worth. Consolidated balance sheets for the general government, published by Statistics Finland, include financial assets and those liabilities that are recognized under ESA 2010, but exclude nonfinancial assets and pension liabilities. The State Treasury also publishes—in the Monthly Bulletin of Central Government Finances—a full balance sheet for budgetary central government, including nonfinancial assets, financial assets, and liabilities. While disclosed in various reports, the assets and liabilities of the wider public sector are outside the consolidated fiscal reports by virtue of their focus on the general government sector.
11. Nonfinancial assets of general government are significant but only published on the Statistics Finland Website. Nonfinancial assetsof central and local government amounted to
18 INTERNATIONAL MONETARY FUND
77 percent of GDP at the end of 2013, around two-thirds of which were nonfinancial assets of local government, mainly buildings and structures (30 percent of GDP), and land (15 percent of GDP). While these nonfinancial assets are reported on a regular basis, they are not included in the consolidated balance sheet for the general government sector.
12. Pension liabilities of 99 percent of GDP for government employees are not included in any fiscal report. As indicated above, both private and public pension funds are classified as social security funds and are thus part of general government, but the pension obligations related tothese funds are not reported as liabilities. The Finnish Centre for Pensions publishes every other year an estimate of these liabilities.8 At the end of 2013, the liabilities for both private and public funds were 296 percent of GDP, of which 99 percent of GDP were for government employees. This is relatively high compared to other countries (Figure 1.2). The assets of the funds were 81 percent of GDP and the funding ratio (assets/liabilities) therefore 27 percent of GDP. The assets were mainly composed of shares and other equity (49 percent of GDP), and debt securities (20 percent of GDP).
Figure 1.2. Public Sector Employees Gross Pension Liabilities in Selected Countries
(Percent of GDP)
Sources: Finnish Center for Pensions (Finland), various national financial statements. Note: *Does not include local government pension liabilities.
Latest data available: 2013 for Australia, New Zealand, US, UK, and Portugal. 2011 for France and Ireland.
13. If reported in fullFinland’s public sector asset holdings in 2013 would be 241 percent of GDP, and its liabilities would be 213 percent of GDP (Figure 1.3). Within this:
8 Report on “Statutory pensions in Finland – long-term projections 2013” presents the long –term projections of the development of statutory pension expenditures and the average benefit level.
0 20 40 60 80 100 120 140 160
INTERNATIONAL MONETARY FUND 19
general government holds total financial and nonfinancial assets of 197 percent of GDP, and total liabilities of 165 percent of GDP, including 99 percent of GDP of unreported public pension funds liabilities;
nonfinancial public corporations hold unreported total assets and liabilities of around 18 and 22 percent of GDP; and
financial public corporations (including the Central Bank) hold total unreported assets and liabilities of around 40 and 39 percent of GDP.
Figure 1.3. Finland: Public Sector Balance Sheet and Coverage in Fiscal Reports
(Percent of GDP)
Sources: Statistics Finland, various publications and reports, and staff estimates.
14. Finland’s net worth is relatively high compared to a sample of other countries. Public sector gross liabilities, including pension liabilities for government employees, are relatively large compared to a sample of other countries (Figure 1.4), but Finland’s net worth of 29 percent of GDP is also relatively high (Figure 1.5), due to the large stock of nonfinancial and financial assets. Adding pension liabilities for private sector employees would of course change this picture (see Box 1.1 for a discussion of the treatment of pension liabilities in government accounts).
-250 -200 -150 -100 -50 0 50 100 150 200 250
Public Sector Central Bank Financial Corps Nonf inancial Corps General Government
Reported Unreported
20 INTERNATIONAL MONETARY FUND
Figure 1.4. Public Sector Gross Liabilities in Selected Countries
(Percent of GDP)
Sources: Staff estimates for Finland, Portugal, Ireland, Russia, Philippines, and Romania; National Financial Statements for others.
Figure 1.5. Public Sector Net Worth in Selected Countries
(Percent of GDP)
Sources: National financial Statements for Australia, NZ, UK, US, Canada and France. Staff estimates for others. Latest available data: 2013 for Finland, Australia, Philippines, Mozambique, Kenya, NZ, US and Canada; 2012 for Portugal, Russia, and Romania; 2011 for UK and Ireland; 2010 for Iceland and 2013 for France. All countries are based on common approach except France and Russia, where civil service pension liabilities are not included.
0 100 200 300 400 General Government Public Enterprises -150 -100 -50 0 50 100
INTERNATIONAL MONETARY FUND 21
Box 1.1. Accounting for Pension Assets and Liabilities
The treatment of pensions in the government’s accounts raises difficult issues in Finland, as in many countries. At present, the financial assets of Finland’s private pension system are included on the statistical balance sheet of general government, while the system’s liabilities are not. Although this asymmetric treatment follows the European statistical rules, it creates two problems: the government’s fiscal position appears better than it really is, and comparisons are clouded between Finland and other countries where neither pension assets nor liabilities are on balance sheet.
Finland’s pension system is established by statutes that determine the benefits that retirees receive and the contributions that employees must make. The system runs partly on a pay-as-you-go basis, with some of the money used to pay current retirees coming from the contributions made by current employees; but the system is also partly funded, with some of current employees’ contributions going to various pension funds. There are separate systems for government employees, and there are two government pension funds, one for employees of central government and one for employees of local government. The rules regarding the benefits of government employees are similar, however, to those regarding employees of the private sector. In some European countries, the pension system is unfunded, so the question of how to record the assets does not arise. In other countries, the pension system is partly funded, but pension assets are deemed to belong, for statistical purposes, to the financial-corporations sector, not general government. The special characteristics of the Finnish system mean that Finnish pension funds are treated in European fiscal statistics as social-security institutions, and their assets are therefore shown on general government’s balance sheet. The obligation to pay pensions is not treated as a liability in European fiscal statistics, however. As a result, the Finnish pension system improves the asset side of general government’s balance sheet, but has no effect on the liability side.
In other countries, differences in pension systems and/or differences in accounting rules lead to somewhat different outcomes. In some countries the pension rights of government employees are treated as
contractual obligations that the government must recognize as liabilities on its balance sheet. Thus, the financial statements of the governments of Australia, Canada, New Zealand, the United Kingdom, and the United States include liabilities in relation to the pensions of government employees. In these countries, the governments also provides a different kind of pension to private-sector employees or to all citizens of a certain age, but these pensions are not treated as creating liabilities for the government. Part of the reason is that the government does not have a contractual obligation to make these payments, and it could reduce pension payments by changing the law—though from a practical point of view the government’s room for maneuver may be very limited. Where these pensions are funded by ordinary taxes, there is also a concern that record a liability for the pensions would not make sense unless an asset was also recorded in relation to the taxes.
Although there is no form of pension accounting that allows completely fair international comparisons, the current asymmetric treatment of pensions in Finland’s statistical balance sheet is unsatisfactory. Although ESA 2010 does not recognize pension liabilities as part of the liabilities of the general government,1 other international standards such as IPSASB and GFSM 2014 generally recognize these liabilities for pensions related to government employees. Table 0.2 therefore includes on the balance sheet of the public sector not only the pension fund’s assets, but also its liabilities related to government employees.
____________
1/ The Council Directive 2011/85/EU does, however, require public availability of data on contingent liabilities that may have a potential impact on the general government deficit and debt, including pension liabilities.
22 INTERNATIONAL MONETARY FUND 1.1.3 Coverage of flows (Good)
15. Fiscal flows are generally recorded on an accrual basis. The financial statements of the budgetary central government are prepared on an accrual basis (though taxes are recorded on a cash basis), as are the financial statements of the remaining subsectors of general government. They also include cash-flow statements. Fiscal Statistics are based on ESA 2010 and includeaccrual based reporting of revenues, expenditures, and financing.9
16. Pension expenditures are however recorded on a cash basis. Since pension liabilities are not recorded on the general government balance sheets, expenditures related to the payment of pensions are captured when the cash flow is observed. For 2013, the pension accrued was 8.3 percent of GDP, and the pension paid was 11.6 percent of GDP. On an accrual recording basis the accrued pension of 8.3 percent of GDP would have been recorded as expenditures, and the payment of the pensions of 11.6 percent of GDP would have been recorded as a reduction of liabilities.
17. The difference between the fiscal balance in the government accounts and net borrowing/lending is quite low and fully explained. Statistics Finland reconciles the national balance in government accounts and net lending/borrowing according to ESA 2010 in the regular excessive deficit procedure (EDP) notifications to Eurostat (Table 1.3). For 2013, the reconciliation resulted in an adjustment of 0.4 percent of GDP, including tax adjustments (0.1 percent of GDP), nonfinancial transactions not included in the working balance (-1.6 percent of GDP), net change in technical provisions (1.9 percent of GDP), and holding/gain losses (-1.1 percent of GDP).
18. Other economic flows resulting from holding gains or changes in the volume of assets and liabilities are significant but not included in fiscal reports. These other economic flows can be derived residually from the financial and nonfinancial accounts of the general government but are not explicitly shown. The change of net financial worth in 2013 resulting from the other economic flows was 6.5 percent of GDP.
9For details, see “Inventories of the methods, procedure and sources used for the compilation of deficit and debt data and the underlying government accounts,” available at
INTERNATIONAL MONETARY FUND 23
Table 1.3. Reconciliation National Balance and Net Borrowing/Lending According to ESA 2010
(Percent of GDP)
Sources: Statistics Finland, EDP Notifications.
1.1.4 Coverage of tax expenditures (Good)
19. Finland regularly discloses the estimated revenues loss from tax expenditures. The government has published an annual report on tax expenditures since 1989. In its current form, the report presents data on overall tax expenditures as well as on the composition of tax expenditure by tax type and by sector. There is no legal limit on or budgetary objectives for the size of tax
expenditures.
20. According to these calculations, tax expenditures in Finland are high compared to other countries. Tax expendituresare currently calculated based on a comprehensive survey, conducted in 2010, which defines tax expenditures as any exception to the general norm of taxation. A total of 185 tax expenditures have been identified, amounting to around 12 percent of GDP in total. This is high compared to other countries for which data are available (Figure 1.6), but might partly be explained by the broad definition of tax expenditures applied in Finland. For example, the fact that owner-occupiers do not pay tax on imputed rent is counted as tax expenditure in Finland.
2010 2011 2012 2013
Working Balance in the government accounts (National Definition) (a) -4.0 -2.4 -2.9 -2.8
Total Adjustments, of which (b) 1.4 1.3 0.8 0.4
Financial transactions included in the working balance -0.2 0.0 0.7 0.2
Tax adjustments 0.1 0.2 0.0 0.1
Investments of muncipalities not included in the working balance -1.4 -1.5 -1.6 -1.6
Holding gains/losses -0.7 1.4 -0.5 -1.1
Net change in technical reserves 1.9 -0.2 1.6 1.9
Deferrable budgetary appropriations 0.9 0.4 -0.2 0.5
Net borrowing (-)/lending(+) (c) = (a)- (b) -2.6 -1.0 -2.1 -2.4
Change in net worth due to Other Economic Flows (d) -9.4 4.2 6.5
24 INTERNATIONAL MONETARY FUND
Figure 1.6. Tax Expenditures Selected Countries
(Percent of GDP)
Sources: “Tax Expenditures in OECD Countries,” OECD (2010); “Ireland’s Tax Expenditure System,” Collins and Walsh (2010); and Prime’s Minister’s Office Annual Report’, Finland (2013).
21. Tax expenditures cover an array of tax types and benefit a wide range of economic sectors. Almost 60 percent of all tax expenditures, corresponding roughly to 7 percent of GDP, relate to personal income taxation, the largest of which are the tax exemption of imputed net rent (1.4 percent of GDP), work income tax credit in municipal taxation (1.0 percent of GDP), and tax allowance for pension contributions (0.9 percent of GDP). Other large tax expenditures include tax exemption for traded securities (1.0 percent of GDP), and reduced value added tax rate for food and fodder 0.6 percent of GDP). By sector, business and industry, social affairs, and housing and
environment are the three sectors that benefit the most from tax expenditures (Figure 1.7).
Figure 1.7. Finland: Tax Expenditures by Sector
(Percent of GDP)
Sources: Prime Minister’s Office, Annual Report of the Government.
0 4 8 12 0 4 8 12 2010 2011 2012 2013 General Administration Education,Science, and Culture
Forest and Agriculture Health
Traffic
Not Elsewhere Classified Social Security
Housing and Environment Business and Industry
INTERNATIONAL MONETARY FUND 25
B. Frequency and Timeliness of Fiscal Reporting
1.2.1 Frequency of in-year reporting (Advanced)
22. In-year fiscal reports are published by Statistics Finland on a frequent and regular basis. Statistics Finland produces quarterly fiscal statistics for general government and its subsectors which cover revenues, expenditures, assets, and liabilities and are published within 90 days of the end of the quarter on Statistics Finland Website. Also in the context of the EU Directive 2011/85/EU (part of the “six pack” EU requirements) related to the budgetary frameworks of the member states, the Ministry of Finance publishes within 30 days of the end of the month monthly data on revenue, expenditures, and fiscal balances of central government, employment pension schemes, and other social security funds.Statistics Finland also publishes quarterly general government transactions and central government debt on the National Summary Data Page of Finland in the context of the Special Data Dissemination Standards (SDDS).
23. The State Treasury also reports on a regular basis on in-year budget execution of budgetary central government. The monthly “Bulletin of Central Government Finances”is published 20 days after the end of the period and provides a breakdown of revenue, expenditure, financing, assets and liabilities for budgetary central government. In addition to the monthly reports, the Treasury has set up NETRA—the Finnish State Internet Reporting System—which makes public on a single website an array of data on the finances, performance, and staff of the ministries and agencies of central government.
1.2.2 Timeliness of Annual Financial Statements (Advanced)
24. Annual financial statements are published and audited within the timeline recommended by the International Standards of Supreme Audit Institutions (ISSAI). The financial statements of the central government are published in April each year as part of the Government’s Annual Report and audited within five months of the end of the fiscal year, in time to inform the preparation of next year’s budget. For municipalities and joint municipal boards, audited financial statements are published within six months of the end of the fiscal year.
C. Quality of Fiscal Reports
1.3.1 Classification (Good)
25. Statistical reports in Finland follow international classification standards. For revenue and expenditures, data are published by economic classification in line with ESA 2010 and by functional classification according to the Classification of Functions of Government (COFOG). For assets and liabilities, data are published according to classification by instruments as defined in
26 INTERNATIONAL MONETARY FUND
26. The budget classifies spending by administrative classification and a mix of functional and economic classification, but not by program. The budget classification is set by the State Budget Decree10 and uses a national classification. The budget classifies revenues according to their type (taxes, social contributions, grants, and other revenue, and with a further breakdown of these). For expenditures a three-tier classification is used based on administrative, functional, and economic classification.
1.3.2. Internal Consistency (Advanced)
27. Fiscal statistics include all three reconciliations required under the Fiscal Transparency Code:
The reconciliation between the fiscal balance and financing is compiled from the quarterly financial and nonfinancial accounts and is published by Statistics Finland on the National Summary Data Page of Finland in the context of the Special Data Dissemination Standards (SDDS). The reconciliation is related to the quarterly general government net
lending/borrowing and its financing. Due to different data sources, there was a discrepancy between net borrowing/lending and the financing (net financial transactions) of 0.1 percent of GDP in 2013. The reconciliation between the financing and the change in the stock of debt is published in “Reporting of Government Deficits and Debt Levels” in the context of the EDP notifications.11 The change is calculated according to the following formula:
Change in the Stock of Debt = Net Borrowing/Lending (opposite sign) + Net Acquisition of Financial Assets + Adjustments12+ Statistical Discrepancy
In addition to the reconciliation between the financing and the change in the stock of debt, a stock-flow reconciliation of the financial balance sheet as defined in the Government Finance Statistics Manual is also published (Figure 1.8).
The debt issues and debt holdings of the central government are published monthly by the State Treasury. The data are published for long-term debt and short-term debt.
10 State Budget Decree number 1243/1992 and its amendments up to 677/2007 11 It refers to the Maastricht debt.
12 Adjustments include, among others, the other liabilities (derivatives and accounts payable), the revaluation related to the exchange rate, and the difference between interest accrued and interest paid.
INTERNATIONAL MONETARY FUND 27
Figure 1.8. Stock – Flow Reconciliation of the Financial Balance Sheet, 2013
(Percent of GDP)
Financial Assets Liabilities
Source: Statistics Finland.
* Other Economic Flows including holding gains/losses related to revaluation of financial instruments on the market and the revaluation related to the exchange rate.
1.3.3. Historical Revisions (Good)
28. Historical revisions are made according to the revision policy of Eurostat. Revisions are made twice per year for the annual data and every quarter for previous quarters. For the April EDP notification round, Finland provides preliminary figures for N-1 and provisional numbers for N-2. For the October EDP notification round, the data provided are provisional for N-1 and final for N-2. Revisions to historical statistics are reported with an explanation but there are no bridge tables between the old and the new time series.
29. In recent years, historical data revisions have been relatively low compared to other EU countries. For 2010-12, debt revisions for Finland were well below the EU 28 average for all three years (Figure 1.9). Deficit revisions were also below the EU average, except for 2010. No major policy revisions occurred during that period which would have affected significantly the size of the historical revisions.
30. The implementation of ESA 2010 has however resulted in larger revisions to both deficits (net lending/borrowing) and debt.The data revisions resulted in an increase of the 2013 deficit of 0.3 percent of GDP and a decrease of the 2013 debt of 1.0 percent of GDP (Figure 1.10). This was due mainly to the reclassification of some government-owned companies (see above) and the exclusion of interest flows relating to swap and forward rate agreements.
28 INTERNATIONAL MONETARY FUND
Figure 1.9. Size of Historical Data Revisions in Comparison with the EU 28
(Percent of GDP)
Source: Statistics Finland.
Figure 1.10. Size of Historical Data Revisions Due to the Implementation of ESA 2010
(Percent of GDP)
Government Deficit (Net lending/borrowing) Government Debt
Source: Eurostat. -0.4 -0.3 -0.2 -0.1 0.0 0.1 0.2 Finland EU 28 Higher Deficit 2010 2011 2012 2013 -2.0 -1.5 -1.0 -0.5 0.0 Finland EU 28 Lower Debt 2010 2011 2012 2013 0.00 0.05 0.10 0.15 0.20 0.25 2010 2011 2012 Deficit Debt Deficit EU 28 Debt EU 28
INTERNATIONAL MONETARY FUND 29
D. Integrity of Fiscal Reports
1.4.1 Statistical Integrity (Advanced)
31. Fiscal statistics are compiled and disseminated by Statistics Finland according to the EU regulations and requirements related to the compilation of fiscal statistics, and also in accordance with SDDS. In addition to compiling government finance statistics (GFS) data according to international standards, Statistics Finland compile debt published on the IMF-World Bank online centralized public sector debt database following the Public Sector Debt Statistics Guide for
Compilers and Users. The advanced release calendar published on the SDDS webpage indicates the dissemination dates for the general government operations and the central government debt. 32. Statistics Finland’s responsibilities for collecting, compiling, and disseminating fiscal statistics are clearly defined by legislation. Statistics Finland is a professionally independent agency according to law, and its main responsibilities are regulated by the Statistical Act (280/2004) which gives Statistics Finland the status of the general authority within the National Statistics Service to produce for general use statistics describing social conditions and their development. The Act dictates that Statistics Finland should ensure statistical data are as reliable as possible and give a truthful picture and make use, if possible, of the uniformity of the concepts, definitions, and classifications, as well as their timeliness. It has the institutional responsibility of all actual and statistical data relating to EDP statistics, as well as communicating these data to Eurostat. Statistics Finland has the sole responsibility of deciding the selection of sources, methodology, and modes of dissemination based on statistical considerations. As a member of the EU, Statistics Finland has to comply with the EU regulations and must observe the EU regulation on community statistics. As supranational legislation, it takes over the national statistical legislation but in general there is no conflict between the EU statistical rule and the Finnish statistical legislation.
1.4.2. External Audit (Advanced)
33. The central government’s financial statements are audited and certified with no major qualifications by the National Audit Office of Finland (NAO). According to the NAO, which is an independent supreme audit institution operating in accordance with INTOSAI standards, the
financial statements of the central government are usually certified for truthfulness and
correspondence with applicable rules. There is a certification of true and fair view of the financial statements of central government accounting entities, but there is no explicit statement of the true and fair view on the basis of international standards for the central government as a whole. The reason for this is the lack of consolidated financial statements for the central government that includes extrabudgetary funds.
34. Local government financial statements are not audited by NAO but by auditors qualified under the Chartered Public Finance Auditors (CPFA) regulations. Under the Finnish Local Government Acts, auditors (CFPA persons or corporations) authorized by the Public
30 INTERNATIONAL MONETARY FUND
Administration and Finance Auditing Committee should be assigned to audit local government financial statements for each fiscal year.
1.4.3. Comparability of Fiscal Data (Advanced)
35. Fiscal data are presented on a comparable basis with an explanation of any deviations. The Economic Survey published by MoF presents fiscal forecast for general government and its subsectors that are comparable to and reconciled with the fiscal statistics.It provides a comparison between the on-budget balance and the central government’s net borrowing/lending as defined by the ESA framework (Table 1.4). It explains the differences in the calculation of the two balances for both historical data and forecasts. In addition, it includes a comparison between the financial accounts and the budget execution.
Table 1.4. Comparability of the On-budget Balance and the Central Government Net Borrowing/Lending
Source: Economic Survey, Autumn 2014, Table 23. 1) Incl. government debt servicing.
2) Incl. debt cancellations, profit on reinvested foreign direct investments, and super dividends.
E. Conclusions and Recommendations
36. Table 1.5 summarizes the assessment of Finland’s practice against the Code. Fiscal reports in Finland meet either good or advanced practices in all the four dimensions of the fiscal reporting, but still there is room for improvement in the following key areas:
37. Issue 1.1. Financial statements for central government:Financial statements are produced for all central government accounting entities but these are not consolidated into one single financial statement for central government.
38. Recommendation 1.1: Increase the institutional coverage of the consolidated financial statements produced by the central government, in the following stages:
Billions of Euros 2012 2013 2014 2015 2016
On-budget surplus (+)/deficit (-) 1) -7.8 -8.4 -7.4 -4.5 -4.1
Privatization proceeds (net proceeds from equity sales) -0.1 -0.1 -1.0 -1.2 -0.5
Financial investment, net 0.7 0.9 0.2 0.5 -0.2
Revenue surplus in off-budget units -0.5 -0.6 0.0 0.0 0.0
Cash/accrual basis adjustment 0.0 0.3 0.3 0.3 0.3
Other adjustment items 2) -0.4 0.2 0.4 -1.2 -1.2
INTERNATIONAL MONETARY FUND 31
consolidate the financial statements of the budgetary central government and the 10 extrabudgetary funds; and
consolidate with the financial statements of the state-owned enterprises which have been reclassified into central government.
39. Issue 1.2. Public sector fiscal reporting: While a range of fiscal reports are produced for the different subsectors of the public sector, these reports are not fully consolidated, and there is no report that provides a comprehensive view of the public sector.
40. Recommendation 1.2: Gradually develop a finance statistics for the consolidated public sector through the following steps:
add nonfinancial assets to the financial balance sheet that is already being produced for the general government sector, to produce a full balance sheet for the general government;
add the assets and liabilities of public corporations to that balance sheet to produce a consolidated balance sheet for the public sector (while continuing to show separate data for general government, and while distinguishing nonfinancial corporations, the central bank, and other financial corporations); and
produce a statement of operations showing the transactions of the public corporations which will then be consolidated with the statement of operations of the general government to produce the statement of operations of the public sector.