Pathway based microarray analysis based
on multi-membership gene regulation
Stelios Pavlidis
A thesis submitted for the degree of
Doctor of Philosophy
Brunel University
February 2011
Abstract
Recent developments in automation and novel experimental techniques have led to the accumulation of vast amounts of biological data and the emergence of numerous databases to store the wealth of information. Consequentially, bioinformatics have drawn considerable attention, accompanied by the development of a plethora of tools for the analysis of biological data.
DNA microarrays constitute a prominent example of a high-throughput experimental technique that has required substantial contribution of bioinformatics tools. Following its popularity there is an on-going effort to integrate gene expression with other types of data in a common analytical approach. Pathway based microarray analysis seeks to facilitate microarray data in conjunction with biochemical pathway data and look for a coordinated change in the expression of genes constituting a pathway.
However, it has been observed that genes in a pathway may show variable expression, with some appearing activated while others repressed. This thesis aims to add some contribution to pathway based microarray analysis and assist the interpretation of such observations, based on the fact that in all organisms a substantial number of genes take part in more than one biochemical pathway. It explores the hypothesis that the expression of such genes represents a net effect of their contribution to all their constituent pathways, applying statistical and data mining approaches. A heuristic search methodology is proposed to manipulate the pathway contribution of genes to follow underlying trends and interpret microarray results centred on pathway behaviour. The methodology is further refined to account for distinct genes encoding enzymes that catalyse the same reaction, and applied to modules, shorter chains of reactions forming sub-networks within pathways. Results based on various datasets are discussed, showing that the methodology is promising and may assist a biologist to decipher the biochemical state of an organism, in experiments where pathways exhibit variable expression.
Declaration
I hereby declare that the research presented in this thesis is my
own work except where otherwise stated, and has not been
submitted for any other degree.
Acknowledgements
Firstly I would like to thank my supervisors Annette Payne and Stephen Swift for their guidance, support, encouragement and patience throughout my PhD. Their contribution has been of great value for the completion of this work. I would also like to express my deep gratitude to my family for their extraordinary love and support all these years.
Importantly, I would like to thank my friends and most of all Evdoxia for their understanding and support.
Finally, I acknowledge the contribution of the Centre for Intelligent Data Analysis (CIDA) lab and its members and the financial support received from the studentship scheme of the School of Information Systems, Computing and Mathematics, Brunel University, UK.
Supporting Publications
The following publications have resulted from the research presented in this thesis:
Published:
1. Pavlidis, S., Payne, A. & Swift, S. (2011). Multi-membership gene regulation in pathway based microarray analysis. BMC Algorithms for molecular biology. 6:22.
2. Pavlidis, S., Swift, S. & Payne, A. (2011). A comparative analysis of single- and multi-membership gene expression, based on association rule mining and differential expression frequencies. In Proceedings of the annual workshop on Intelligent Data Analysis in bioMedicine And Pharmacology(IDAMAP).
3. Pavlidis, S., Swift, S. & Payne, A. (2010). Pathway based microarray analysis, facilitating enzyme compounds and cascade events. In Proceedings of the annual workshop on Intelligent Data Analysis in bioMedicine And Pharmacology(IDAMAP).
4. Pavlidis, S., Payne, A. & Swift, S. (2008). An Improved Methodology for Pathway Based Microarray Analysis Based on Identification of Individual Pathways Responsible for Gene Regulation. In Proceedings of the annual workshop on Intelligent Data Analysis in bioMedicine And Pharmacology (IDAMAP).
Under review:
5. An extended version of item 3 has been invited for publication in the Methods of Information in Medicine journal and is under review at the time of completion of this thesis.
Item 1 is based on the work presented in Chapters 4 and 5. Item 2 presents findings described in chapter 3 of the thesis. Item 3 results from the research presented in Chapter 6 while item 4 from preliminary work for this thesis and the research described in Chapter 4.
vi
Contents
1 Introduction
22
1.1 Overview . . . 22 1.2 Thesis Outline . . . 23 1.3 Thesis Contributions . . . 262 Background
27
2.1 Introduction . . . 272.2 Basic biological concepts . . . 27
2.2.1 DNA, proteins and their role . . . 27
2.2.2 Biochemical pathways . . . 31
2.2.3 Metabolic pathways . . . 32
2.2.4 Signalling pathways . . . 34
2.2.5 Importance of biochemical pathways . . . 34
2.2.6 MicroRNAs . . . 35 2.3 Bioinformatics . . . 36 2.3.1 DNA sequencing . . . 38 2.4 Systems Biology . . . 39 2.4.1 Overview . . . 40 2.5 Microarrays technology . . . 42 2.5.1 Underlying concept . . . 42
2.5.2 Raw data pre-processing . . . 43
CONTENTS
vii 2.5.4 Applications . . . 47 2.6 Heuristics . . . 49 2.6.1 Overview . . . 50 2.6.2 Basic Concepts . . . 512.6.3 Stochastic local search algorithms . . . 52
2.7 Biological Databases . . . 57
2.7.1 Metabolic and signalling pathways databases . . . 58
2.7.2 Microarray data databases . . . 60
2.8 Pathway based microarray analysis . . . 62
2.8.1 Available software . . . 63
2.9 Conclusions . . . 68
3 Central Hypothesis
69
3.1 Introduction . . . 653.1.1 Rationale and motivation . . . 69
3.1.2 Common issues related to variable expression of genes in a pathway . . . 71 3.2 Single- and Multi-membership genes . . . 72
3.3 Hypothesis . . . 81
3.4 Expression frequencies . . . 82
3.5 Contradicting expression values . . . 91
3.6 Statistical analysis . . . 92
3.7 Association rule mining . . . 96
3.7.1 Association rule mining in gene expression data . . . 96
3.7.2 Definitions . . . 97
3.7.3 Application . . . 100
3.8 Conclusions . . . 104
4 Pathway based microarray analysis methodology, facilitating
hill climbing search
107
4.1 Introduction . . . 107CONTENTS
viii 4.3 Rationale . . . 110 4.4 Methods . . . 112 4.4.1 Hill climbing . . . 112 4.4.2 Algorithm . . . 113 4.4.3 Comparison of allocations . . . 117 4.5 Results . . . 118 4.5.1 Data processing . . . 119 4.5.2 Convergence . . . 123 4.5.3 Consistency of results . . . 124 4.5.4 Comparison of allocations . . . 125 4.6 Conclusions . . . 1295 Pathway analysis using simulated annealing and a genetic
algorithm
130
5.1 Introduction . . . 130 5.2 Methods . . . 131 5.2.1 Simulated annealing . . . 132 5.2.2 Genetic algorithm . . . 1335.2.3 Hamming distance and probabilities . . . 135
5.2.4 Fuzzy Adjusted Rand Index . . . 139
5.3 Results . . . 140
5.3.1 Methods‘ performance . . . 140
5.4 Conclusions . . . 151
6 Pathway based microarray analysis centred on enzyme
compounds
152
6.1 Introduction . . . 152 6.2 Rationale . . . 153 6.3 Methods . . . 158 6.3.1 Algorithm . . . 1596.4 Results and discussion . . . 162
CONTENTS
ix
6.4.2 Consistency of allocations . . . 172
6.5 Conclusions . . . 173
7 Conclusions and future work
175
7.1 Scope of work . . . 1757.2 Contribution . . . 177
7.2.1 Multi-membership genes . . . 178
7.2.2 Hill climbing based gene to pathway allocation . . . 180
7.2.3 Heuristic search approaches comparison . . . 181
7.2.4 Pathway analysis centred on enzyme compounds . . . 182
7.3 Future work . . . 183
x
List of Figures
2.1 The central dogma of biology. Information stored in DNA can be copied onto another DNA molecule, or transferred to RNA which in turn can serve for protein synthesis . . . 29 2.2 Translation. Each codon in the RNA molecule, resulting from
the transcription of particular gene, specifies the amino acid that comes next in the respective protein. The codons are read one by one in the cells ribosomes and the transcription mechanism eventually produces a whole polypeptide chain . . . 30 2.3 Diagrammatic representation of Glycolysis . . . 32 2.4 The KEGG metabolic network. Part of KEGG representation of
the entire metabolic network and interconnections between individual pathways. This is a so called reference pathway map, a generalised view that can be individualised to distinct organisms which naturally share some similarities while at the same time differ in various aspects of their metabolism. Each circle represents a particular chemical compound such as glucose for example, while the lines represent the steps required to turn one compound into another, the so called substrate into a product. These steps are catalysed by one or more enzymes and take place in various cellular compartments. From http://www.genome.jp/kegg-bin/show_pathway?map01100 . . . 33 2.5 Hybridisation of nucleotide sequences. The target DNA
sequence aligns with its complementary probe due to formation of hydrogen bonds (dashed lines) between the complementary base pairs, A-T and G-C . . . 43
LIST OF FIGURES
xi
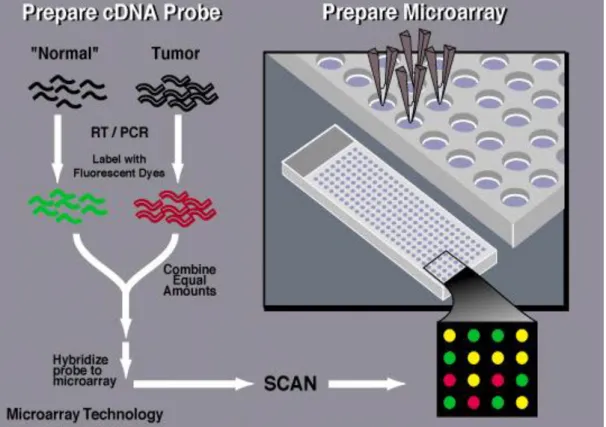
2.6 Microarray image from (Schulze & Downward 2001). Spots appearing red correspond to genes more actively transcribed under the condition labelled with red dye, while the opposite is true for green spots. Yellow spots correspond to genes of similar expression under both conditions . . . 44 2.7 Overview of the major experimental steps of DNA Microarrays.
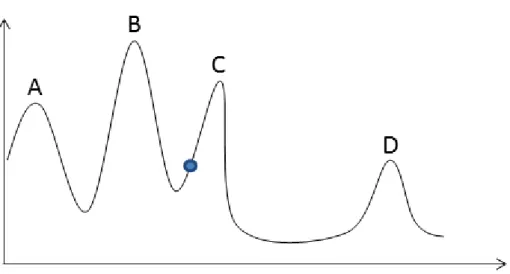
From http://www.genome.gov/10000533,31/01/2011 . . . 45 2.8 An example of 4 cities TSP problem . . . 52 2.9 One-dimensional state space landscape. Points A, C, and D are
only local maxima while C is the global maximum . . . 54
2.10 One point crossover. The figure exemplifies the exchange of parts between two parent chromosomes, at the position of the dashed line, to produce two daughter chromosomes, each one consisting of a part of each parent chromosome. This is a one point crossover, the simplest type. In this example the exchange takes place in the middle, but generally crossover can occur at any available position . . .
56
2.11 The genetic operator of mutation, giving birth to a new, daughter chromosome, from an existing parent chromosome . .
56
2.12 KEGG homepage (KEGG 2011) . . . 59 2.13 GEO homepage (GEO 2011) . . . 61 2.14 A snapshot of Eu.Gene Analyser. A software tool developed for
scoring gene sets, such as pathways and other functional groups. Each set is scored according to the proportion of differentially expressed genes it contains, in relation to other sets and the global expression of genes in the microarray dataset . . . 65 2.15 GSEA software tool. Snapshot of GSEA software tool for the
identification of gene sets, significantly enriched in differentially expressed genes . . . 67
LIST OF FIGURES
xii
3.1 Hypothetical biochemical pathway. Enzyme A catalyses the conversion of compound 1 into compound 2, which is then transformed into compound 3 with the contribution of the enzymic activity of B and so on . . . 70 3.2 Number of E.coli genes of various membership degrees in
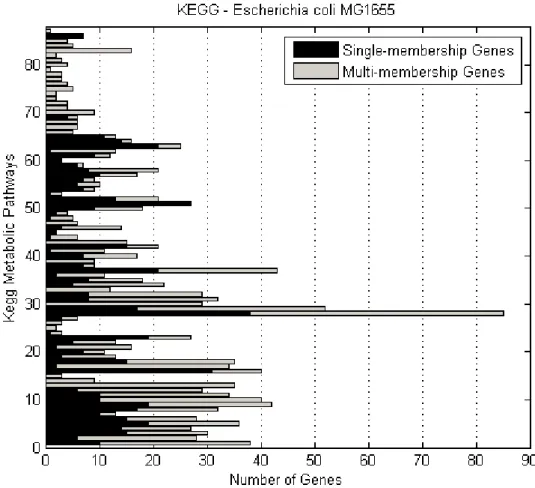
KEGG metabolic pathways . . . 73 3.3 Number of E.coli single- and multi-membership genes per
KEGG metabolic pathway . . . 73 3.4 Number of E.coli genes of various membership degrees in all
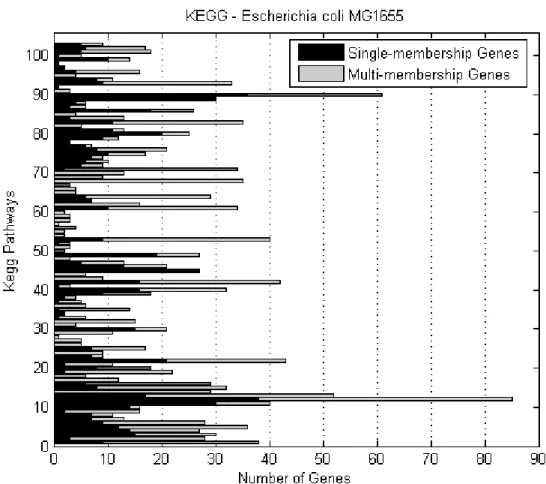
KEGG pathways . . . 74 3.5 Number of E.coli single- and multi-membership genes per
KEGG biochemical pathway . . . 75 3.6 Number of S.cerevisiae genes of various membership degrees in
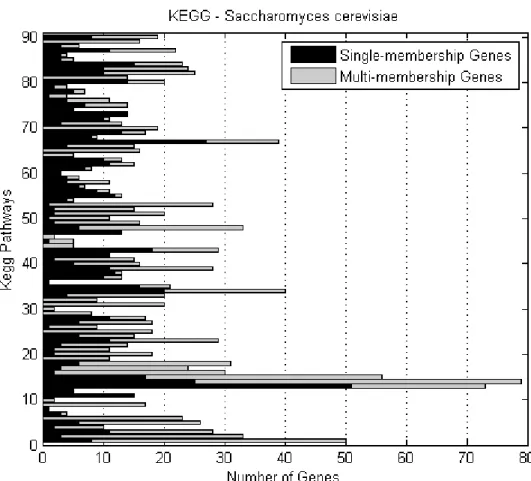
KEGG metabolic pathways . . . 76 3.7 Number of S.cerevisiae single- and multi-membership genes per
KEGG metabolic pathway . . . 76 3.8 Number of S.cerevisiae genes of various membership degrees in
all KEGG pathways . . . 77 3.9 Number of S.cerevisiae single- and multi-membership genes per
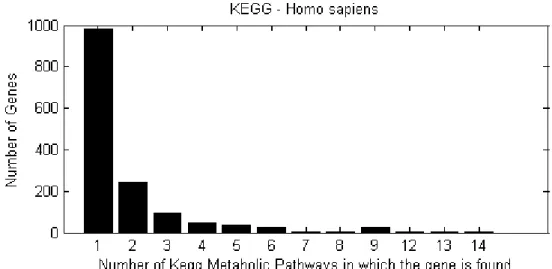
KEGG biochemical pathway . . . 77 3.10 Number of H.sapiens genes of various membership degrees in
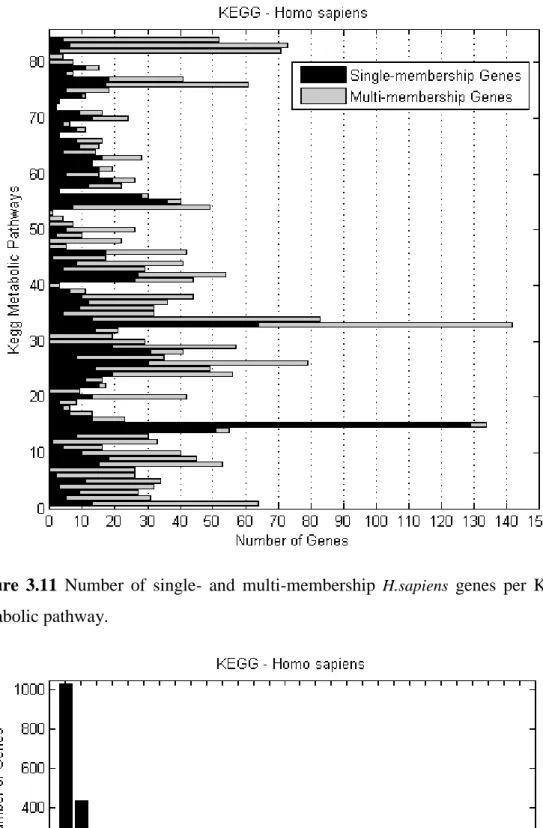
KEGG metabolic pathways . . . 78 3.11 Number of single- and multi-membership H.sapiens genes per
KEGG metabolic pathway . . . 79 3.12 Number of H.sapiens genes of various membership degrees in
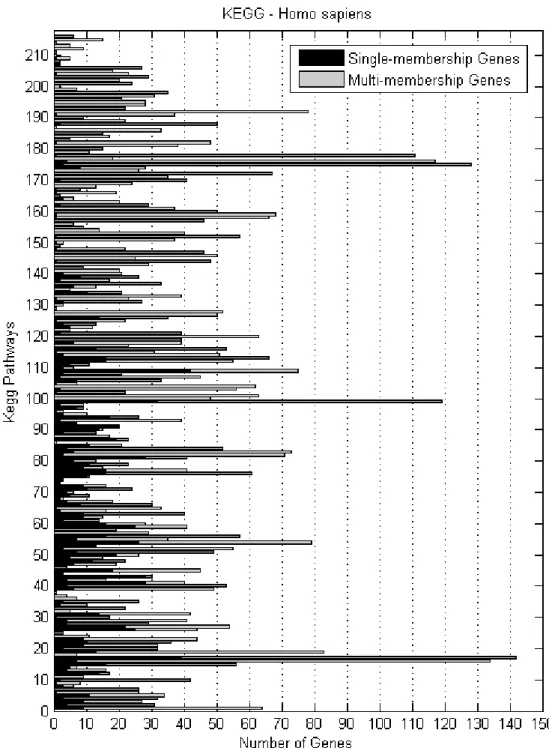
all KEGG pathways . . . 79 3.13 Number of single- and multi-membership H.sapiens genes per
KEGG biochemical pathway . . . 80 3.14 Average percentage of differential expression, for different
membership degree thresholds. For each threshold the plot shows the average percentage of expression for genes of membership equal to the specific threshold or higher . . . 84
LIST OF FIGURES
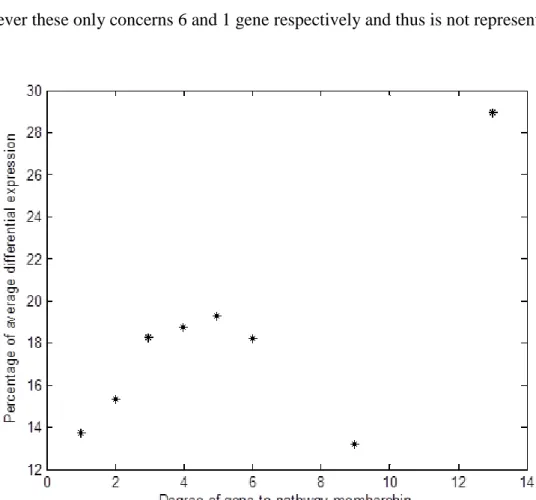
xiii
3.15 Percentage of average differential expression for genes of distinct membership degree bands . . . 85 3.16 Percentage of regulated single- and multi-membership genes.
Number of expressed single- and multi-membership genes, as proportion of the total number of single- and multi-membership genes respectively . . . 86 3.17 Average expression of Saccharomyces cerevisiae KEGG genes
per pathway. Pathways are ranked from the one with highest proportion of expressed genes (top) to the one with lowest (bottom) . . . 89 3.18 Instances of over 30% expressed Saccharomyces cerevisiae
genes per pathway. Pathways are displayed in a sorted arrangement, from the one with most cases of 30% or more of its genes expressed (top) to the one with least such cases . . . 90 3.19 Contradicting Saccharomyces cerevisiae gene expressions per
pathway. These are the instances where a gene in a pathway contradicts the behaviour of the rest of the genes forming the pathway in question . . . 92 3.20 Correlation between expression values. The values correspond
to Escherichia coli gene couples in the KEGG Arginine and Proline metabolism pathway in a subset of 140 experiments (GPL3503 from GEO) . . . 95 3.21 Number of association rules produced by single- and
multi-membership Escherichia coli genes in the Phenylalanine metabolism pathway (GPL3503) . . . 101 3.22 Mean Escherichia coli genes association rule confidence for
rules of confidence above different thresholds (GPL3503) . . . . 102 3.23 Number of association rules where one gene implies the
behavior of the rest in the Glutathione metabolism pathway . . . 103 3.24 Mean confidence of rules produced by single- and
multi-membership genes in the Glutathione metabolism pathway, for increasing minimum threshold . . . 104
LIST OF FIGURES
xiv
4.1 Proportion of genes of contradicting behaviour per pathway, in the subset of instances, where at least 30% of all genes in a path exhibit differential expression . . . 109 4.2 Pathway gene expression based on full allocation of genes to
pathways.The figure shows the expression of all genes for a set of chosen pathways . . . 120 4.3 Pathway gene expression upon processing of the dataset. The
figure reveals the allocation of genes for the same pathways, upon processing with our method . . . 120 4.4 Algorithm Convergence. Each line shows the mean fitness for
20 runs of the algorithm on data from GSM513 . . . 124 4.5 Mean NBH values per experiment (for all pathways containing
genes of fluctuating expression), for standard allocation and the one produced by our methodology. As overall number of genes, we consider the intersection of genes between KEGG and each microarray. As affected we consider the number of genes contained in this intersection that show expression levels above or below the chosen thresholds . . . 127 4.6 Mean NBH values per experiment (for all pathways containing
genes of fluctuating expression), for standard allocation and the one produced by our methodology. The overall number of genes is equal to the sum of the sizes of all Escherichia coli
biochemical pathways. The number of affected genes is equal to the sum of affected genes per pathway . . . 128
5.1 Mean fitness reached by each method, per experiment for GPL17. The figure reveals the mean fitness reached by method per experiment, for 46 experiments corresponding to platform GPL17 from GEO, in twenty separate runs of each method . . . 141
LIST OF FIGURES
xv
5.2 Convergence. The solid, dashed and dotted lines correspond to the mean hill climbing, simulated annealing and genetic algorithm fitness, upon 20 runs. Experiments roughly cover the range of fitness values reached in all experiments. GSM539 and GSM516 where the experiments with the least and most possible allocation positions, respectively, while GSM518 and GSM526 are equally distanced from the two extremes. The reached fitness follows suit . . . 142 5.3 Mean convergence per experiment and method. The hill
climbing method (solid line) is the fastest, closely followed by the simulated annealing (dashed line) approach, while the genetic algorithm (dotted line) proves significantly slower . . . . 143 5.4 Mean convergence per experiment, according to search space
size. Experiments are represented in an ordered fashion, from the one with least expressed multi-membership genes, and smallest search space to the one with most expressed multi-membership genes and largest search space . . . 144 5.5 Mean fitness per experiment and method, according to search
space. The hill climbing fitness values are represented with a solid line, the simulated annealing dashed and the genetic algorithm dotted line. As the size of the search space grows, following the number of possible genes to pathways allocations, all methods are able to reach higher fitness values and are virtually indistinguishable . . . 145 5.6 Mean hamming distance between allocations per experiment,
according to search space. Experiments are ordered according to the number of possible genes to pathways allocations . . . 146 5.7 Mean FARI between allocations per experiment, according to
number of possible genes to pathways allocations. For the FARI values between allocations produced by subsequent runs of each method there is no correlation whatsoever with the size of the search space (number of possible multi-membership genes‘
LIST OF FIGURES
xvi
allocations) . . . 147 5.8 Mean Hamming distance probability according to search space
size. The probability of observing a given hamming distance or smaller, per experiment is ploted against the possible number of gene to pathway allocations. The mean is based on comparisson of the results produced by 20 separate runs of each method . . . 149 5.9 Mean Hamming distance between allocations for each pair of
methods according to search space size. The probability of observing a given hamming distance or smaller, per experiment for each pair of search algorithms is ploted against the possible number of gene to pathway allocations, i.e. size of search space. The mean is based on comparisson of the results produced by 20 separate runs of each method . . . 150
6.1 The KEGG Glycolysis and Gluconeogenesis modules and their interconnectivity (http://www.genome.jp/kegg-bin/show_pathway?sce00010). Rectangles represent positions where enzymes with the corresponding commission numbers are needed for catalysis. White rectangles represent enzymes unique to gluconeogenesis, light grey rectangles enzymes unique to glycolysis and dark grey rectangles enzymes involved in both modules . . . . . . . 154 6.2 Glycolysis and Gluconeogenesis enzymes behaviour.The figure
exhibits the activation and deactivation of various enzymic positions in the modules (EC positions) throughout 7 time points, upon processing with the proposed method . . . 164
6.3 Response to excess glucose. Cells submitted to 0.2 g/l glucose pulse gradually exhibit increased expression of glycolytic enzymes, while gluconeogenesis subsides . . . 166 6.4 Response to excess glucose. Cells submitted to 2 g/l glucose
LIST OF FIGURES
xvii
enzymes, while gluconeogenesis subsides . . . 167 6.5 Glycolysis/Gluconeogenesis pathway coverage. Coverage
represents the proportion of expressed EC position, for consecutive time point experiments discussed in (Gasch et al. 2000) . . . 169 6.6 Convergence of 20 separate runs, on Diauxic Shift data, time
point t7 . . . 170
6.7 Convergence of20 separate runs, on data from GSM94996 . . . 171
6.8 Convergence of20 separate runs, on data fromGSM95012 . . . 171
xviii
List of Tables
2.1 The Genetic Code.The code is degenerate as a number of codons specify the same amino acid. In total 64 combinations of 3 bases specify all amino acids including the start and stop signals, for the process of transcription . . . 28 2.2 2011 NAR Database Summary Paper Category List . . . 58
3.1 Average expression of hypothetical genes A and B, In 6 experiments. Ones represent up-regulation, minus ones down-regulation and zeros stable expression of the respective gene. Based on the table we can estimate the average expression of the group consisting of genes A and B . . . 83 3.2 Average proportion of expressed single- and multi-membership
genes per Saccharomyces cerevisiae KEGG pathway . . . 87 3.3 Expression similarity matrix . . . 98 3.4 Hypothetical example of expressional behaviour of 3 genes in 4
experiments. Ones represent up-regulation, minus ones down-regulation and zeros lack of differential expression . . . 99
4.1 Log2 ratios of tryptophan metabolism genes, for experiment
LIST OF TABLES
xix
4.2 Hamming distance between two gene allocations of gene YBR263W.The two allocations of gene YBR263W a member of 4 pathways differ at two positions, 3 and 4, for one carbon pool and methane metabolism respectively. Thus, the hamming distance between them is 2, or 2/4=0.5 (50%) as proportion of the length of the string . . . 118 4.3 Saccharomyces cerevisiae KEGG Biochemical Pathways
containing gene ALD6 . . . 122 4.4 Comparison of results produced by 20 separate runs of the hill
climbing algorithm for each separate starting point . . . 125
5.1 Hamming Distances between two allocations of a gene member of two pathways. The table reveals all possible combinations of two allocations for a multi-membership gene, participating in two distinct biochemical pathways, with the corresponding hamming distance between the binary strings representing these allocations. A string of zeros is considered invalid allocation, as we assume that a differentially expressed gene is contributing to the activity of at least one of its member pathways . . . 136 5.2 Probability of obtaining any hamming distance between two
allocations of a gene member of two pathways. Given the number of possible combinations (Table 5.1) of allocations for a gene member of two pathways, and the hamming distance between them, this table shows the probability of obtaining each possible hamming distance, purely by chance . . . 137 5.3 Number of combinations of pairs of allocations of hamming
distance between 0 and r. Using the equations on the table we can estimate the number of all possible combinations of allocations, represented as binary strings, of hamming distance from 1 to r . . . 137
LIST OF TABLES
xx
5.4 Combined Hamming distance and probability for a pair of genes, members of two pathways. The table exemplifies how to estimate the combined hamming distance for two multi-membership genes, members of two distinct biochemical pathways each, along with the respective combined probability. Here again, we assume that any configuration, where each gene is allocated to at least one pathway is valid and that each one is equally likely to occur by chance . . . 138 5.5 Compact Hamming distance and probability for two genes,
members of two pathways each. Table 5.5 is produced by merging Table 5.4, to only show each possible hamming distance and the corresponding probability of observing it by chance, for a set of two expressed multi-membership genes. Each gene is a member of two distinct biochemical pathways . . . 139 5.6 Mean of the minimum, maximum and mean fitness reached by
each method. The table summarises the fitness reached by the each method for GPL17 . . . 141 5.7 FARI statistics between allocations produced separate runs of
each search method. The table summarises the minimum, maximum and mean Fuzzy Adjusted Rand Indexes between allocations produced by twenty separate runs of the hill climbing, simulated annealing and genetic algorithm search approaches . . 148 5.8 Probability of observed hamming distance. The table summarises
the minimum, maximum and mean probability between allocations produced by twenty separate runs of the algorithms on GPL17 data . . . 148
LIST OF TABLES
xxi
5.9 FARI statistics between allocations produced by the three search methods. The values are based on 20 separate runs of each script. However, this time we examine the similarity between results produced by each pair of methodologies, namely hill climbing and simulated annealing, hill climbing and the genetic algorithm, and simulated annealing and the genetic algorithm . . . 149
6.1 Genes, encoding enzymes, corresponding to each commission number on Figure 6.1 . . . 155
22
Chapter 1: Introduction
1.1 Overview
In the last couple of decades the face of biological research has undergone substantial transformation from both a qualitative and a quantitative perspective. The cumulative progress in a wide range of scientific fields including computer science, mathematics, physics and chemistry along with a rapid increase in automation have made it possible to develop novel, high throughput experimental techniques for the study of biological phenomena. It is now possible to gain insights into aspects of living structures and functions which have never before been accessible to us. At the same time we are now able to produce huge amounts of very diverse biological datasets. Bioinformatics sprung into existence and gained wide spread popularity in the 90s due to the need to find efficient ways to store, manipulate and analyse the newly acquired data.
DNA Microarrays have played a major role in the area of bioinformatics research. This experimental technique allows us to observe the expressional behaviour of entire genomes in a single experiment, by measuring the relative abundance of RNA molecules corresponding to individual genes, between conditions of interest. For over a decade there have been numerous publications dealing with one or other aspect of microarray data analysis and following the trend for data integration, there have been substantial efforts to incorporate different types of biological knowledge in the analytical process.
Pathway based microarray analysis is an attempt to exploit gene expression data to gain insight into the state of a cell or an organism from a biochemical point of view. Wet lab biological research has led to the identification of biochemical chains of
1: Introduction
23
reactions that take place in different organisms, to allow them to facilitate nutrients available in their environment and support their survival and development. This network of reactions is quite complicated and far from complete. Thus it has been organised into smaller units, the so called pathways, each one responsible for a defined gradual process of transformations of certain molecules into different chemical compounds required by the organism. Pathway based microarray analysis examines the expression of pre-defined sets of genes, which encode the proteins participating in each such chain of reactions, in order to identify the impact of different conditions on biochemical activity. That is, it tries to answer the question, which pathways need be activated and which de-activated in response to various stimuli, developmental stages and so on.
The central theme of this work is the analysis of biochemical pathway behaviour based on the expressional behaviour of genes forming them, facilitating microarray data. It aims to identify the true pathways to which gene members of more than one pathway contribute and subsequently identify the state of activity of pathways, centred on the behaviour of their constituent genes. This introductory chapter presents an overview of the motivation, content and contribution of the thesis.
1.2 Thesis outline
Chapter 2 provides an overview of the background behind the work in this thesis. It introduces the research area in some detail along with the relevant technological advances that have led to its emergence. It presents some basic biological concepts that are necessary for understanding the motivation behind this work and the analytical approaches applied. This includes a discussion of the basic features of biological systems and their main components, that is, genes and proteins along with their functional associations. A discussion of biochemical pathways, of different types and their role, as well as their importance in biological research from a theoretical and practical point of view, constitutes a major part.
Additionally, the field of bioinformatics and computational biology is explored, including a brief history and presentation of the main experimental technologies laying the foundations for its emergence and recent popularity. Given that heuristics
1: Introduction
24
are facilitated in the methodologies presented in this thesis, a section giving an overview of the area and some important relevant computational techniques is included.
There is an extensive part on the rationale, experimental procedure, data processing, applications and importance of DNA Microarrays technology. Biological databases are also discussed and the different types introduced with special emphasis on biochemical pathway and microarray data databases, which are relative to this research.
Naturally, this is followed by a discussion of pathway based microarray analysis the relevant experimental methodologies and computational tools it encompasses. Following the presentation of available software tools and how they approach the task in hand in terms of visualisation and analytical efforts the challenges faced by this approach are identified. The chapter concludes with a brief discussion of the importance of refining the methodology and the contribution that this work aims to achieve.
Chapter 3 deals with the main hypothesis on which the thesis is largely reliant and seeks to provide supportive evidence. It identifies the fact that a substantial number of genes in all organisms constitute members of a number of distinct pathways. There is an extensive comparative analysis of the behaviour of such genes as opposed to the expression of genes that participate in one unique pathway. A number of different approaches are implemented, including some statistical, as well as data mining analysis of microarray datasets, such as correlation analysis and association rule mining. Naturally, the methodologies and their implementation are presented where necessary.
Thus, this is an exploratory and descriptive chapter facilitating computational analysis to explore gene expression behaviour based on large microarray datasets. It concludes that there is some evidence that gene members of many pathways do exhibit different behaviour than genes that constitute members of one and only biochemical pathway.
1: Introduction
25
Following these observations, chapter 4 proposes an analytical methodology that seeks to identify the state of activity of distinct pathways, centred on the behaviour of genes forming them. There is some further discussion of the motivation behind the specific computational approach, which facilitates a hill climbing algorithm to allocate genes to pathways. The allocation seeks to discover the true pathways whose regulation by the biological system requires genes to exhibit the expression observed in a microarray experiment. The algorithm is explained and the results of its application to some Escherichia coli and Saccharomyces cerevisiae are presented. Given the nature of hill climbing and mainly its tendency to get stack in local optima, chapter 5 examines alternative heuristic search approaches. In particular it presents the implementation of a simulated annealing and a genetic algorithm approach, to search for the best gene to pathway allocation, as discussed above. Besides examining the fitness reached by each method, since it has no biological meaning, additional metrics of similarity are facilitated. Namely, a similarity measure based on the hamming distance metric and a method to extract the probability of observing two allocations of a given similarity or larger are presented. Additionally, there is an implementation of the fuzzy adjusted rand index measure. Together these measures allow the comparative analysis of results from different perspectives, which is discussed along with produced allocations.
In chapter 6 a slightly different methodology is discussed and implemented. The motivation behind it is mainly biologically driven. Since, proteins are the functional molecules responsible for enzymic reactions, rather than genes, the search approach in this chapter is altered in way that it becomes centred on enzymic positions in the chain of biochemical reactions. A main point here is that different genes often encode enzymes catalysing the same step in a pathway, while at the same time a particular gene may participate not only in different pathways but also in different steps of the same pathway. Hence, we examine the state of each such enzyme/step based on all the genes involved. Consequentially, we then examine the state of positions rather than just looking into lists of genes.
Chapter 7 summarises the research performed in this thesis and the obtained results, along with some critical discussion of its outcomes. It identifies shortcomings and
1: Introduction
26
possible improvements. The chapter concludes with some discussion of potential future work directions.
1.3 Thesis contributions
The key contributions of this thesis are below:
1. It identified substantial variability in the expression of genes forming biochemical pathways, in a small but considerable proportion (~15%) of examined microarray datasets (Chapter 3)
2. It identified differences in the expressional behaviour of multi- and single-membership genes, suggesting that the expression of the former group represents a net effect of their contribution to all their constituent pathways (Chapter 3)
3. It proposed a novel methodology to identify the state of activity of pathways, based on the expression of multi-membership genes, implementing a heuristic search approach (Chapter 4)
4. It showed that a hill climbing, a simulated annealing and a genetic algorithm search approach exhibit similar performance for the examined datasets. This is an interesting observation given the differences of their nature (Chapter 5) 5. It proposed and implemented a measure to estimate the similarity between
genes to pathways allocations, based on discretised gene expression data and an approach to estimate the probability of observing a certain level of similarity or greater, purely by chance (Chapter 5)
6. It proposed a methodology to identify the activation state of pathways and modules centred on the activity of enzymes responsible for distinct steps in the process. The expression of all genes corresponding to each step is used as evidence for this activity (Chapter 6)
27
Chapter 2: Background
2.1 Introduction
The research presented in this thesis is in the field of systems biology and more precisely bioinformatics, facilitating heuristic search approaches for data analysis. These are relevantly novel areas of research that have drawn considerable interest, mostly in the last two decades, partly due to the large volume of accumulated biological knowledge and partly due to the availability of sophisticated technology and computer processing power that we now have at our disposal, in the effort to elucidate life processes and solve important biological issues.
This chapter provides an introduction to some basic biological concepts that are necessary for understanding the motivation behind this work. Additionally it deals with the main aspects of computational analysis of biological data and experimental techniques that have emerged in recent years and are relevant to this research.
2.2 Basic biological concepts
The following is a brief introduction to some basic biological concepts and mechanisms that govern living organisms. These form the conceptual basis of this work and are necessary for the reader to understand the biological issues this thesis deals with.
2.2.1 DNA, proteins and their role
All living organisms are formed by one or more cells, often described as the basic functional unit of life. Each cell carries genetic material, the DNA that can be seen as
2: Background
28
the hard drive, the storage facility that carries the information needed in order for a cell to maintain life processes and survive. DNA stores every single instruction that allows the cell and consequentially the organism to grow and multiply.
DNA molecules constitute large polymers build-up of nucleotides, which in turn consist of sugar residues with covalently attached nitrogenous base and a phosphate group. Nucleotides are linked together by phosphodiester bonds in a linear fashion and it is the particular sequence of bases in the linear DNA molecule that contains the information for life maintenance. More precisely there are four types of bases, the purines adenine (A) and guanine (G), and the pyrimidines cytosine (C) and thymine (T), that constitute the genetic ‗alphabet‘ and the particular order in which they are placed encodes the genetic information of an organism (Strachan & Read 2004).
Table 2.1 The Genetic Code. The code is degenerate as a number of codons specify the same amino acid. In total 64 combinations of 3 bases specify all amino acids including the start and stop signals, for the process of transcription.
START AUG STOP UAA, UGA, UAG
Alanine GCU, GCC, GCA, GCG Leucine UUA, UUG, CUU, CUC, CUA, CUG
Arginine CGU, CGC, CGA, CGG, AGA, AGG Lysine AAA, AAG
Asparagine AAU, AAC Methionine AUG
Aspartic acid
GAU, GAC Phenylalanine UUU, UUC
Cysteine UGU, UGC Proline CCU, CCC, CCA, CCG
Glutamine CAA, CAG Serine UCU, UCC, UCA, UCG, AGU, AGC
Glutamic acid
GAA, GAG Threonine ACU, ACC, ACA, ACG
Glycine GGU, GGC, GGA, GGG Tryptophan UGG
Histidine CAU, CAC Tyrosine UAU, UAC
2: Background
29
Similarly to DNA, proteins are large polymers build-up of a linear sequence of repeating units, the so called amino acids. All proteins in all species are constructed from the same set of only 20 amino acids. However, these building blocks exhibit remarkable diversity in terms of their chemical properties, such as hydrophobicity, polarity and acidity/basicity, and the particular order in which they are placed is the main factor conferring a protein its structural and by extension functional properties (Stryer & Tymoczko 2006). It is this order of amino acids that is in fact stored in the order of nitrogenous bases of genes scattered within DNA molecules. In brief, a sequence of three bases, termed codon, encodes a particular amino acid, and thus provides the cell with the knowledge required to produce the proteins it needs by orderly arranging amino acid monomers. Table 2.1 presents the standard genetic code shared by most organisms.
This brings us to what is known as the central dogma of biology, describing the flow of genetic information, as portrayed on Figure 2.1. According to the classical view of the central dogma of biology genetic information hardwired in DNA molecules is transcribed into transposable RNA molecules, which in turn serve as templates translated by ribosomes in the cytoplasm to produce polypeptide chains that fold into active protein molecules (Figure 2.2). It should be noted that in RNA thymine is replaced by uracil (U), hence the absence of T from the codons on table 2.1.
Figure 2.1 The central dogma of biology. Information stored in DNA can be copied onto another DNA molecule, or transferred to RNA which in turn can serve for protein synthesis.
2: Background
30
Additionally, genetic information can be passed on to a new DNA molecule through the process of replication so that it can be passed on to a new cell. However, once genetic information has been turned into a protein it cannot be transferred back to DNA or another protein.
As will become apparent later on the process of DNA transcription into RNA molecules, which carry the message stored in a gene, so that it can be facilitated mainly for protein synthesis, is of great importance for microarray technology. In fact it is this sequence of events that constitutes gene expression. It is important to mention that while generally speaking microarray analysis is often termed gene expression analysis, to be precise we should note that it is the whole process starting from a gene and finishing with a functional protein that gene expression describes. This not only includes transcription but also the further processing of RNA and it‘s translation into a protein, as well as a number of post-translational modifications of the resulting molecule which are necessary for the production of a functional protein (Seo & Lee 2004).
Figure 2.2 Translation. Each codon in the RNA molecule, resulting from the transcription of particular gene, specifies the amino acid that comes next in the respective protein. The codons are read one by one in the cells ribosomes and the transcription mechanism eventually produces a whole polypeptide chain.
Virtually every life process depends on proteins, which are the most abundant and functionally diverse molecules in any living organism. The vast majority of gene
2: Background
31
expression is dedicated to protein synthesis, which are the major functional end-point of DNA. Proteins can be composed of one or more polypeptides and account for the majority of the dry weight of a cell. Their name was derived from the Greek word
proteios, meaning ‗of the first rank‘ due to the wide range of important roles they
have, including structural support, signalling, cell communication, transport and importantly catalysis which is essential for this work (Strachan & Read 2004).
2.2.2 Biochemical Pathways
All organisms are capable of carrying forward chemical transformations, facilitating nutrients available in their environment to make chemical building blocks, extracting and mediating the transformation of energy from one form to another, processes that are essential for their growth and the maintenance of life. Metabolism essentially refers to a linked series of chemical reactions that begins with a particular molecule and converts it into some other molecule or molecules in a strictly controlled fashion (Stryer & Tymoczko 2006).
Protein enzymes acting as catalysts are capable of specifically binding an extremely wide range of molecules, determining which one of a number of potential chemical reactions takes place. Proteins achieve this by accelerating the speed of reactions by factors of a million or more. A variety of such reactions are organised into multi step, synchronised sequences of events referred to as pathways (Harvey & Ferrier 2010).
Each pathway can be seen as a particular sequence of events, during which certain molecules are gradually modified to produce other molecules in order to accommodate the needs of the respective organism. At each step, the product of a reaction serves as the substrate for the next step of the process, until a final desired molecule product of a pathway is synthesised. This in turn may either be facilitated immediately or stored for future use. In other words, the product of a pathway may serve as a substrate for the initiation of another pathway. Naturally, the sum of such events constitutes a complicated network and can be seen as a flow of enzymatic activity, which has been categorised into separate units, the aforementioned pathways, to accommodate our intuitive needs in an effort to comprehend the biochemistry of living cells.
2: Background
32
2.2.3 Metabolic Pathways
Metabolic pathways are responsible for two major cellular processes, the extraction of energy from the environment, and the synthesis of monomers, the building blocks of macromolecules and their subsequent utilisation for the synthesis of macromolecules themselves (Stryer & Tymoczko 2006). These processes constitute a highly integrated network of biochemical reactions taking place in a cell, the metabolic network.
Glycolysis is arguably the most studied and well characterised metabolic pathway, often used as an example in a variety of text books and on-line resources dealing with basic biochemistry. This is partly due to its universality across all living organisms, with enzymes involved in the catalysis of distinct reactions in the pathway being very similar in different species. It is one of the most ancient metabolic pathways and the first studied (Romano & Conway 1996). In brief, it is the process during which cells convert glucose, a very important carbohydrate, into pyruvate, producing energy. Figure 2.3 provides an overview of the main steps of glycolysis.
Figure 2.3 Diagrammatic representation of Glycolysis.
Each individual reaction requires catalysis by enzymes all of which constitute members of the glycolysis metabolic pathway. As discussed earlier, glycolysis also
2: Background
33
constitutes part of a wider network, with which it shares a number of interconnections. Figure 2.4 exemplifies that, using part of the Kyoto encyclopaedia of genes and genomes database (KEGG 2011) representation of the entirety of the biochemical network and interconnections between separate pathways (Kanehisa et al. 2008).
Figure 2.4 The KEGG metabolic network. Part of the KEGG representation of the entire metabolic network and interconnections between individual pathways. This is a so called reference pathway map, a generalised view that can be individualised to distinct organisms which naturally share some similarities while at the same time differ in various aspects of their metabolism. Each circle represents a particular chemical compound such as glucose for example, while the lines represent the steps required to turn one compound into another, the so called substrate into a product. These steps are catalysed by one or more enzymes and take place in various cellular compartments. From (http://www.genome.jp/kegg-bin/show_pathway?map01100)
2: Background
34
2.2.4 Signalling pathways
Another important category of pathways is the so called signalling pathways, which allow external signals to be passed through various cellular components, leading to a specific cellular response and allowing cell communication. The entire process consists of three stages, reception of the signal coming from outside the cell, transduction of the message, mostly through a sequence of changes in a number of different protein molecules forming the signalling pathway, and in conclusion an adequate cellular response (Campbell & Reece 2007).
Protein kinases, the enzymes that catalyse phosphorylation of other proteins as well as phosphatases responsible for the reverse reaction, hold a major role in signal transduction, as they are the main compounds of signalling pathways. Each molecule acts on another molecule in the pathway, in a sequenced manner. Each cell may contain hundreds of distinct protein kinases, each one acting on different proteins, regulating major cellular processes like reproduction, programmed cellular death, also known as apoptosis and so on.
2.2.5 Importance of biochemical pathways
The study and understanding of pathways constitutes a topic of intensive research as they are of upmost importance for proper cellular function. Metabolic regulation is quite complex due to the integrated nature of the metabolic network and aberrations of the genes involved may have serious impact on cellular state, which we aim to elucidate.
Abnormalities in the structure and activity of protein kinases have been implicated in the development of large variety of cancers (Campbell & Reece 2007). It has been established that kinases are involved in most ‗cancer pathways‘, with the cell cycle attracting special attention due to the strong relationship between cell proliferation and tumour development (Nair 2005; Carter et al. 2006).There is plethora of evidence that cell cycle kinases aberrations may lead to uncontrolled proliferation and cell division, some of the main characteristics of cancer development (Malumbres & Barbacid 2007). For example the epidermal growth factor receptor (EGFR) signalling system, which plays a fundamental role in the morphogenesis of a
2: Background
35
diverse spectrum of organisms, has been implicated in a variety of human cancers. Just to mention a few, EGFR is overexpressed in 50% of epithelial cell malignancies, while HER-2 another receptor of the same family is highly over-expressed in 20-30% of breast cancers (Nair 2005).
Naturally, signalling pathways and their members are of special interest to therapeutics as plausible targets for cancer treatment drugs development. There is already substantial ‗proof of principle‘ for the clinical use of kinase inhibitors in cancer treatment. To mention one success story, the development of the tyrosine kinase inhibitor imanitib, known as Gleevec®, has proved highly successful in the treatment of patients with chronic myeloid leukaemia and the majority of newly diagnosed patients have been shown to achieve complete remission (O‘Brien, Guilhot & Larson 2003).
Moreover, the study of kinases has great potential in prognosis as it has been shown that gene expression data can be used for prognostic purposes. More precisely, a signature from specific genes, including several kinases, was found correlated to several cancer types, with overexpression of the particular set of genes proving predictive of poor clinical outcome (Carter et al. 2006). This constitutes a good example of the importance of microarrays in applied medical research.
2.2.6 MicroRNAs
MicroRNAs (miRNAs) are a family of short RNAs, approximately 21–25-nucleotide long which are not translated (He & Hannon 2004). However, they have been found to negatively regulate gene expression at the post-transcriptional level. Although microarray technology, which is central in this work, does not allow the study of microRNAs, this section provides a very brief overview of their role, given the recent discovery of their implication in regulating gene expression and pathway activity. The founding member of the miRNA family, termed lin-4, was identified in the worm species C. Elegans. Studies demonstrated that the sequence of this 22 nucleotide long RNA is partially complementary to the RNA of lin-14, encoding a protein important for the regulation of the transition of the worm from one developmental stage to another. Through direct hybridisation between lin-4 and
lin-2: Background
36
14, lin-4 is involved in the control of LIN-14 expression. That is, it is able to block
the process of protein translation and hence synthesis.
Almost at the same time with the discovery of the above phenomenon another kind of regulatory process was identified by other small RNAs termed siRNAs (for silence RNAs). In this case base pairing between a siRNA and an RNA transcript is followed by cleavage and degradation of the latter. It should however be noted, that questions have arisen regarding the distinction between the two types of small RNAs, as at least some examples have been identified where the two exchange mode of activity.
Recent studies have shown that miRNAs take part in important biological processes such us development, differentiation, apoptosis and proliferation. A number of groups have shown that changes in the expression levels of these molecules are associated with cancer development. It has been proposed that they can function as tumour suppressors or oncogenes (Callin & Croce 2006). Given these findings and the fact that the human genome may encode over 1000 microRNAs, which may target about 60% of genes, it is not surprising that their study has become quite popular and may contribute to our understanding of gene and protein regulation.
2.3 Bioinformatics
The term Bioinformatics, first proposed by Paulien Hogeweg (Hogeweg 1978), gained wide spread popularity in the 90s, initially used to describe the use of computers for the analysis of gene sequences (Claverie 2000). Today it is broadly accepted as defining an interdisciplinary scientific field that blends biology, computer science and mathematics.
There is a certain degree of confusion as to the distinction between bioinformatics and computational biology and the terms are often used interchangeably. According to the National Centre for Biotechnology Information (NCBI, 2011) computational biology is the actual process of analysing and interpreting biological data, while bioinformatics is the field of science in which biology, computer science, and information technology merge to form a single discipline. From another point of view bioinformatics is a sub-field within computational biology that is concerned
2: Background
37
with the development and application of algorithms and statistical analysis to interpret biological data. It can be seen as the process of creating the tools rather than the process of interpreting the results, admittedly a vague distinction.
According to the National Institute of Health of the U.S.A. (NIH) Biomedical Information Science and Technology Initiative Consortium (BISTI 2011) the following definitions apply:
Bioinformatics: Research, development, or application of computational tools and approaches for expanding the use of biological, medical, behavioural or health data, including those to acquire, store, organise, archive, analyse, or visualize such data.
Computational Biology: The development and application of data-analytical and theoretical methods, mathematical modelling and computational simulation techniques to the study of biological, behavioural, and social systems.
Nevertheless, the emergence of bioinformatics can be attributed to the advancement of genetics and genomics in the 80‘s, notably to the development of DNA sequencing, discussed in the following section (Moore 2007). The large amounts of sequence data produced became unmanageable without the use of computer power and storage. Indicatively, the human genome alone consists of over 3 billion DNA base pairs. Thus, one of the fundamental aspects of bioinformatics refers to the organisation of the newly acquired knowledge in databases, allowing us to store and manage the large volume of data (Moore 2007).
Naturally, the following step was to find useful and efficient ways to analyse and interpret this knowledge. Thus, today the scope of bioinformatics has expanded to encompass a variety of computationally intensive techniques such as data mining and machine learning methods applied to extract information from molecular biology experiments along with the process of interpreting the data (Moore 2007) . Popular approaches include gene mining, sequence analysis (Vinga & Almeida 2002), gene
2: Background
38
clustering (Hand & Heard 2005), protein structure (Zhang 2008) and interaction modelling (Skrabanek et al. 2008), just to mention a few.
For example, BLAST (for Basic Local Alignment Search Tool) and FASTA (for FAST-All, referring to the fact it works on any alphabet) algorithms identify regions of local similarity between nucleotide or protein sequences, measuring the statistical significance of the match, thus, allowing us to infer functional relationships between them (Altschul et al. 1990; Pearson 1990). Since their development more than a decade ago, a number of improvements and other algorithmic approaches have been developed. (Vinga & Almeida 2002) provide a useful review of alignment-free sequence comparison methods which attempt to overcome the limitations of the previous approaches, mainly due to the fact that they were largely based on text alignment methodologies that do not account for certain biological realities.
Importantly, microarray technology, essential in this work, is not only one of the major contributors to the accumulation of huge amounts of biological data, but also constitutes one of the major areas of bioinformatics research for more than a decade (Stoughton 2005). It has made it possible to study and compare entire genomes in a very short time span and its focus has already shifted from database management and search to gene discovery and characterisation, modelling gene networks, diagnostics and so on, as discussed in more detail in section 2.5.
2.3.1 DNA Sequencing
Bioinformatics in general and microarray technology itself would be unfeasible without the discovery of sequencing techniques which are in a way the cornerstone in the foundation of gene expression analysis. In fact genome sequencing is also the foundation of what is often referred to as ‗omics‘ sciences, including not only transcriptomics (e.g. microarrays) but also genomics and proteomics, the study of DNA and protein structure and function respectively. Given that microarray technology is in the centre of this work, it is useful to provide a brief discussion of DNA sequencing.
In simple terms DNA sequencing refers to the process of reading the genetic code of an organism. While, until quite recently this used to be a laborious task, requiring
2: Background
39
years to establish the nucleotide sequence of a single gene, today the entire genome of many organisms is readily accessible in minutes, through search of public genome databases.
This became possible not so much due to ground breaking advances in molecular techniques, as due to the collaboration between scientists around the globe and the establishment of large sequencing centres that industrialised the Sanger sequencing method (Maxam & Gilbert 1977). In brief, DNA is synthesised on a single stranded template with random incorporation of modified bases that act as chain terminators. In this way we acquire a range of DNA fragments of varying size corresponding to each position of termination allowing us to read out chunks of nucleotide sequences.
This collaborative effort made the genomes of more than thousand organisms available to the world scientific community (1,550 according to KEGG, 18/02/11). As a result the concept of Systems biology has emerged, since we can now study biological processes in complete cellular systems.
2.4 Systems biology
Traditional biology has focused on the study of individual components of living organisms, such as cells, organelles, genes and proteins in an effort to establish their properties and specific functions. This static approach to biology has apparent limitations as it only provides us with sparse pieces of the puzzle, only examining few aspects of life processes at a time. Nevertheless, the continuous accumulation of more and more pieces of the puzzle in conjunction with technological advances has gradually brought us into a new era of biological research and the foundation of systems biology. This novel scientific field is an interdisciplinary approach to biological systems, integrating traditional biological research with computer science, mathematics, physics and engineering in a holistic analytical approach that seeks to elucidate the dynamics of biological systems. It is a field still in its infancy which is reflected on the fact that it has yet to attain a concise definition. Nevertheless, the popularity of the term has grown rapidly in recent literature, with systems biology institutes emerging around the globe (Ideker 2004; Hodgkinson & Webb 2007).
2: Background
40
2.4.1 Overview
Systems biology is a holistic approach to the properties of living organisms. As opposed to the reductionist point of view that a system can be understood by reducing it to its individual parts, thus a biological system can be understood in terms of looking into the chemical and physical properties of the molecules of which it consists, the holistic view can be summarised by Aristotle‘s point that ‗The whole is more than the sum of its parts‘.
Systems biology‘s roots can be traced in the work of the mathematician Robert Weiner‘s and his book ‘Cybernetics, or Control and Communication in the Animal and the Machine‘, who first introduced the theory of feedback systems, that is systems capable of self-regulation applicable to both living organisms and machines (Weiner 1948). Naturally, at the time we neither possessed the knowledge nor the processing power of computers to be able to apply this to practical research.
Today there has been considerable progress and our focus has drastically shifted towards understanding a system's structure and dynamics. Genes, proteins and their interconnections are merely a static roadmap, whereas we are truly interested in the traffic patterns and their properties (Kitano 2002b). Naturally, understanding the components of the system remains important. In fact, decryption of the genome, facilitated by advances in molecular technologies, along with the development of high throughput measurements, such as microarray technology, have been the driving force behind the emergence of systems biology.
To gain system-level understanding of a biological system we need to decipher four key properties. Firstly the system‘s structures, that is genes and the nature of their interactions through biochemical networks. Second, we need to understand the behaviour of the system over time under various conditions. Third, decipher the control mechanisms employed by the cell to optimise its functions and avoid malfunctions and finally, elucidate the basic design principles that govern the properties of the biological system (Kitano 2002b). In this effort, gene expression analysis to identify co-expression of genes, and importantly identification of unknown genes that appear to interact with genes of known function, through clustering and correlation analysis plays a major role (Eisen et al. 1998).
2: Background
41
While biology has always borrowed some scarce contribution from other sciences, notably mathematics, today this is more so than ever. Especially, in the last couple of decades the balance has shifted dramatically and biology has seized to be a single discipline, which is generally the case for most scientific disciplines. Today it is inconceivable to study biology in isolation, even at school level, let alone carry out advanced biological research without the use of computers. "Real" biology is increasingly carried out in front of a computer, be it so to simply retrieve a nucleotide sequence or produce a complex model of a gene network (Roos 2001). Physics, chemistry and engineering also have a wide range of contributions, for example in DNA sequencing, PCR technology, protein mass spectrometry, microarray analysis and so on. Mathematics, simple or advanced is indispensible part of research at every level.
The systems biology approach, has obvious practical advantages, notably in therapeutics as deeper understanding of biological functions allows us to develop new treatments. The combination of computational, experimental and observational enquiry is of great interest in drug discovery and individualisation of medical treatment regimes. While there is still a long way to go it is widely accepted that the future of medicine lies in the application of systems biology to medical practice (Kitano 2002a).
In a review of systems biology in drug discovery the authors identify three main principal approaches to the task in hand, namely the integration of distinct ‗omics‘ data sets, the modelling of system physiology from cell and organ response level information in the literature, and the use of complex human cell systems in an effort to understand and predict the biological activities of drugs and gene targets (Butcher, Berg & Kunkel 2004). These are complementary approaches that need to be integrated if we are to gain deeper understanding of human disease. Nevertheless, they have already contributed to the process of drug discovery, by accelerating hypothesis-driven biology, providing useful models for target validation and increasing our ability to interpret organism responses to drugs. Perhaps, due to its infancy as a field systems biology has not yet produced a major ‗success story‘.