Structural behaviour of hardwood veneer-based circular hollow sections of different compactness
Gilbert, Benoit P.; Underhill, Ian D.; Fernando, Dilum; Bailleres, Henri; Miller, Dane Published in:
Construction and Building Materials DOI:
10.1016/j.conbuildmat.2018.03.105 Published: 10/05/2018
Document Version: Peer reviewed version
Link to publication in Bond University research repository.
Recommended citation(APA):
Gilbert, B. P., Underhill, I. D., Fernando, D., Bailleres, H., & Miller, D. (2018). Structural behaviour of hardwood veneer-based circular hollow sections of different compactness. Construction and Building Materials, 170, 557-569. https://doi.org/10.1016/j.conbuildmat.2018.03.105
General rights
Copyright and moral rights for the publications made accessible in the public portal are retained by the authors and/or other copyright owners and it is a condition of accessing publications that users recognise and abide by the legal requirements associated with these rights. For more information, or if you believe that this document breaches copyright, please contact the Bond University research repository coordinator.
Benoit P. Gilbert , Ian D. Underhill , Dilum Fernando , Henri Bailleres , Dane Miller 3
(1) School of Engineering and Built Environment, Griffith University, Australia
4
(2) School of Civil Engineering, The University of Queensland, Australia
5
(3) Salisbury Research Facility, Department of Agriculture and Fisheries, Queensland Government, Australia
6
(4) Faculty of Society & Design, Bond University, Australia
7
Corresponding author: [email protected]
8 9
Abstract: This paper presents the capacity and structural behaviour of hardwood veneer-based cir-10
cular hollow sections (CHS) tested in bending, shear and compression. The sections were manufac-11
tured from early to mid-rotation (juvenile) Gympie messmate (Eucalyptus cloeziana) plantation 12
thinned logs. In total twenty-one 167 mm Outside Diameter (OD) × 1.2 m long CHS were manufac-13
tured in seven sets of three nominally identical sections. Two different wall thicknesses were inves-14
tigated to produce nine compact and twelve more slender cross-sections. The sections were also man-15
ufactured in three different structural grades. A sudden failure mode was observed in the compression 16
zone of the slender sections tested in bending. In compression, the compact sections showed a ductile 17
behaviour, while the slender sections showed a more brittle behaviour, with the sections bursting into 18
longitudinal strips. While a relationship was observed between the bending and compressive capaci-19
ties, and the structural grade, no such relationship was noticed for the shear capacity. Comparison to 20
steel and concrete sections of similar outside diameter proved that the timber sections are the most 21
efficient in terms of bending and compressive capacity to linear weight ratio. The timber sections fall 22
behind their steel and concrete counterparts in terms of shear efficiency, however they still have 23
enough shear capacity for representative structural applications. 24
1. INTRODUCTION
26
To develop a market for low-value, small diameter, early to mid-rotation (juvenile) hardwood 27
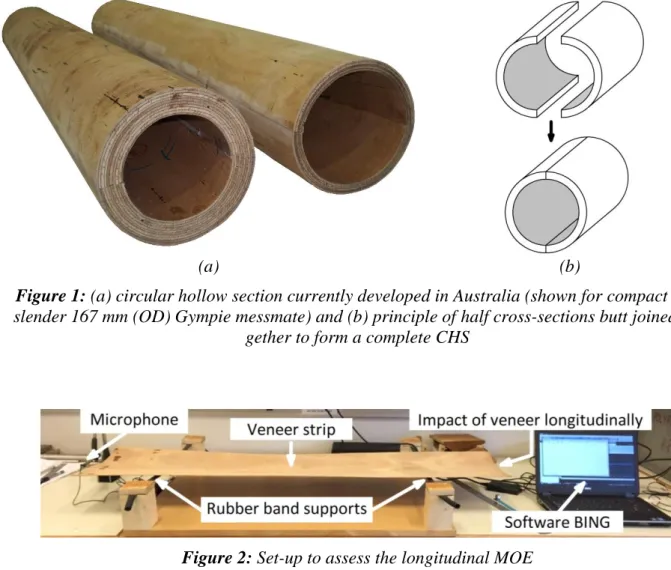
plantation logs, veneer-based hollow sections are currently being developed in Australia [1-3], see 28
Figure 1. These sections have the potential to be used in structural applications [1, 3] and are seen, 29
for instance, as a potential solution for utility poles [1] and the main frame of buildings. They have 30
the advantage of having an efficient cross-sectional shape, are sustainable [4-6], and able to be man-31
ufactured in usable lengths [2] and cross-sectional sizes that are no longer available in sawn timber. 32
In the literature, various hollow timber structural solutions have been investigated. They include 33
(i) spirally winded veneer-based Circular Hollow Section (CHS) [7-9], (ii) fibre-reinforced moulded 34
wooden tubes [10-14], (iii) octagonal tubes from composite wood flakes panels [15], (iv) nonagon 35
tubes from knot free pine wood strips [16], (v) “wood rings” reinforced with glass epoxy [17] and 36
(vi) LVL type CHS for temporary geotechnical soil nailing systems [18]. Commercially, veneer-37
based hollow timber solutions are also available, either limited to small diameter cross-sections (up 38
100 mm) [19] or short lengths (up to 1,000 mm) [20]. 39
To confidently use the new sections in structural applications, research is still needed to fully un-40
derstand their structural behaviour, failure modes and reliability. In particular, bending tests per-41
formed on 145 mm Outside Diameter (OD) × 15 mm (wall thickness) Laminated Veneer Lumber 42
(LVL) type CHS showed that the sections can experience a sudden failure in the compression zone, 43
with the sections opening up [1]. While this failure mode has been observed in hollow trees [21], it 44
is not typical of solid timber beams which usually reach a maximum bending moment due to tensile 45
rupture [22]. The sudden compressive failure mode is likely attributed to the semi-compactness of 46
the cross-section in [1] which led to local buckling and cross-section ovalisation (Brazier effect [23]). 47
The relationship between the cross-sectional slenderness and structural behaviour requires further 48
attention. 49
Consequently, the structural behaviour and failure modes of veneer-based timber CHS of various 50
cross-sectional slenderness are experimentally investigated in bending, shear and compression in this 51
paper. In total twelve 167 mm (OD) × 12.5 mm (wall thickness), referred to as “slender”, and nine 52
167 mm (OD) × 25 mm (wall thickness), referred to as “compact”, 1.2 m long CHS were manufac-53
tured from early to mid-rotation (juvenile) Gympie messmate (Eucalyptus cloeziana) plantation 54
thinned logs. The veneer grain was orientated in the same direction and along the member longitudi-55
nal axis for all sections except for one type of the slender sections. For this section, cross-banded 56
veneers were used in this case to potentially increase the section local buckling capacity. To study 57
the effect of the timber elastic stiffness on the new products’ structural behaviour, the CHS were 58
manufactured in three different structural grades. The grades were solely based on the veneers’ Mod-59
ulus of Elasticity (MOE). 60
The paper initially introduces the investigated cross-sections and the associated manufacturing 61
process. Secondly, the test set-ups for all investigated loading cases are presented. Thirdly, the struc-62
tural behaviour, capacities and failure modes of the slender and compact sections are analysed and 63
discussed. Finally, the performance of the studied sections is compared to similar steel and concrete 64 counterparts. 65 66 2. INVESTIGATED CROSS-SECTIONS 67 2.1 General 68
In total, twenty-one nominal 167 mm (OD) × 1.2 m long veneer-based CHS were manufactured 69
from two half cross-sections following the process described later in Section 2.2. Randomly selected 70
nominal 1.2 m (Long) × 1.2 m (Wide) × 2.5 mm (Thick) Gympie messmate rotary peeled veneer 71
sheets were delivered and then cut parallel to the grain direction (i.e. perpendicular to the length of 72
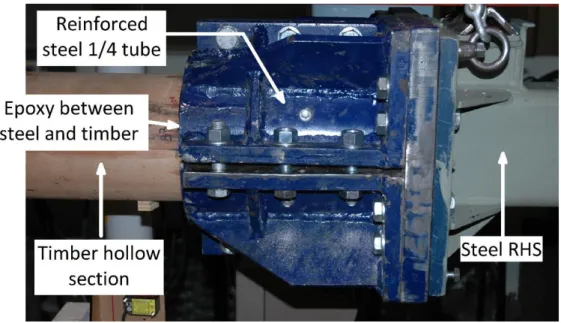
the veneer ribbon) into four 300 mm wide strips. The longitudinal dynamic MOE of each veneer sheet 73
was then measured using a non-destructive resonance method [24]. To do so, the second cut strip per 74
veneer sheet was simply supported on rubber bands and impacted with a hammer in its longitudinal 75
direction. The sample natural frequency was recorded using a microphone and analysed using the 76
software BING® (Beam Identification by Non-destructive Grading) [25]. Figure 2 shows a photo of
77
the set-up. Before assessing the dynamic MOE, the veneers were conditioned in a temperature con-78
trolled room set at 22oC. 79
Based on their measured MOE, the delivered veneer sheets were divided into three stacks of equal 80
number of veneers. This classified the veneers into three grades referred to as “Grade 1” for the lower 81
MOE (13 GPa < MOE ≤ 19 GPa), “Grade 2” for the intermediate MOE (19 GPa < MOE ≤ 21 GPa) 82
and “Grade 3” for the higher MOE (21 GPa < MOE ≤ 25 GPa). 83
The twenty-one CHS were manufactured in seven sets of three nominal identical samples. Per set, 84
the half cross-sections of the three nominally identical CHS were manufactured from the same veneer 85
sheets which were glued in the exact same order. Precisely, for each veneer sheet, three 300 mm wide 86
strips out of four were used in the CHS manufacturing process. The remaining strip was used to 87
determine the material properties of the half cross-sections as detailed in Sections 2.2 and 3.2. The 88
seven sets consisted of: 89
• Three sets of nominal 167 mm (OD) × 12.5 mm (5-ply) slender CHS manufactured from Grade 1 90
(Set “S_G1”), Grade 2 (Set “S_G2”) and Grade 3 (Set “S_G3”) veneers. In these sets, the veneers’ 91
grain is orientated in the same direction and along the longitudinal axis of the section. 92
• One set of nominal 167 mm (OD) × 13 mm slender CHS. To potentially increase the section local 93
buckling capacity, a cross-banded configuration was used. Four 2.5 mm thick Gympie messmate 94
hardwood Grade 2 veneers were orientated along the longitudinal axis of the section and three 1 95
mm thick cross-banded softwood Hoop pine (Araucaria cunninghamii) veneers were inserted be-96
tween the hardwood veneers to form a 7-ply configuration. This set is referred to as “S_G2_Cross”. 97
• Three sets of nominal 167 mm (OD) × 25 mm (10-ply) compact CHS manufactured from Grade 1 98
(Set “C_G1”), Grade 2 (Set “C_G2”) and Grade 3 (Set “C_G3”) veneers. In these sets, the veneers’ 99
grain is orientated in the same direction and along the longitudinal axis of the section. 100
An examples of a compact and slender CHS is shown in Figure 1 (a). 101
Note that while the wall the slender sections is quite thin, fire protection may be achieved by gluing 102
sacrificial low MOE veneers to the outside of the sections, therefore protecting the load carrying part 103
of the CHS. 104
2.2 Manufacturing process
105
The manufacturing process detailed in [18, 26] and used to manufacture the samples tested in [1, 106
2] has been improved in this study. A similar process to the one described in [18, 27] has been fol-107
lowed. After assessing the dynamic MOE of the veneers, the veneers were moved out of the temper-108
ature controlled room and stored in an indoor environment (structure laboratory) until gluing. To form 109
the half cross-sections, resorcinol formaldehyde structural adhesive was applied to the veneer strips 110
at ambient temperature and humidity. The veneer stacks were then inserted into a 167 mm Internal 111
Diameter (ID) CHS PVC pipe and cold-pressed for 24 hours by a fire hose inserted into the PVC pipe 112
and pressurised at 1.2 MPa with water. Figure 3 illustrates the manufacturing process. 113
As rotary peeled veneers have the natural tendency to curl about their loose side (i.e. the one in 114
contact with the blade of the peeling lathe), the loose side of a veneer was always glued herein to the 115
tight side of the next veneer. The tight and loose veneer sides therefore formed the outside and inner 116
faces of the manufactured hollow cross-sections, respectively. The two half cross-sections forming a 117
complete CHS were then butt jointed together using structural epoxy resin (Figure 1 (b)) due to its 118
good gap properties which can compensate for non-strict parallelism of the two half cross-sections. 119
For alignment, the glue-line incorporated biscuit joints every 400 mm. 120
Additionally, to determine the mechanical properties of the material of the timber sections, two 121
500 mm × 300 mm flat panels were also manufactured for each half-section. The panels were manu-122
factured from the same veneer sheets used to produce the half cross-sections and were glued in the 123
exact same layering order. 124 125 3. TESTING METHODOLOGY 126 3.1 General 127
Per manufactured set, one section was tested in bending, one in shear and one in compression. The 128
following sub-sections introduce the material testing methodology and the test set-ups of the CHS for 129
each one of the investigated loading cases. 130
Before testing, all samples were conditioned in the same temperature controlled room as the ve-131
neers when the dynamic MOE was assessed, for a minimum period of one month. The temperature 132
in the room was set at 22oC. For all scenarios, excluding the CHS tested in compression, pieces were 133
cut and weighed immediately after testing from selected test samples to determine the timber moisture 134
content at the time of testing. The oven-dry methodology in the Australian and New Zealand standard 135
AS/NZS 1080.1 [28] was followed. 136
3.2 Material properties
137
3.2.1 Tension tests
138
From the first flat panel of each half cross-section, a maximum of five nominal 10 mm wide × 100 139
mm long (gauge length) coupon (dog bone) samples were CNC cut. The samples were similar to the 140
ones recommended by the ASTM D3500–14 [29] and were used to estimate the tensile strength of 141
each half cross-section. The ends of the samples were clamped in the jaws of a 500 kN capacity MTS 142
universal testing machine and tested in tension at a constant strain rate to reach failure in 3-6 mins. 143
The tensile strength σtens of each coupon was calculated as, 144
t t tens t W Fmax = (1) 145
where Fmax is the maximum recorded force, Wt and tt are the measured width and thickness of the 146
coupons, respectively. 147
3.2.2 Compression tests
148
The second flat panel of each half cross-section was used to determine the compressive strength 149
of the material. To avoid buckling of the samples corresponding to the slender CHS, the 12.5 mm 150
thick panels were cut in two and glued together using resorcinol formaldehyde structural adhesive to 151
form nominal 25 mm thick panels. The panels corresponding to the compact CHS were left un-152
touched. Up to four 80 mm (Wide) × 150 mm (Long) rectangular samples were cut per panel for 153
material testing. 154
The samples were tested in compression in a 500 kN capacity MTS universal testing machine at a 155
constant strain rate to reach the peak stress in 3-5 mins. Specifically, the samples were positioned 156
between a fixed bottom platen and an upper platen mounted on a spherical seat, which could rotate, 157
so as to provide full contact between the platens and the specimens. Note that before testing, the ends 158
of the samples were cut with a high quality fine cut circular saw blade to ensure a uniform contact 159
pressure between the platens and the samples. 160
Similar to Eq. (1), the compressive strength σcomp of each sample was calculated as, 161 c c comp t W Fmax = (2) 162
where Fmax is the maximum recorded force, Wc and tc are the measured width and thickness of the 163
samples, respectively. 164
3.3 Bending tests
166
3.3.1 Test set-up
167
To measure the bending strength and stiffness of the timber CHS, the sections were tested in a 168
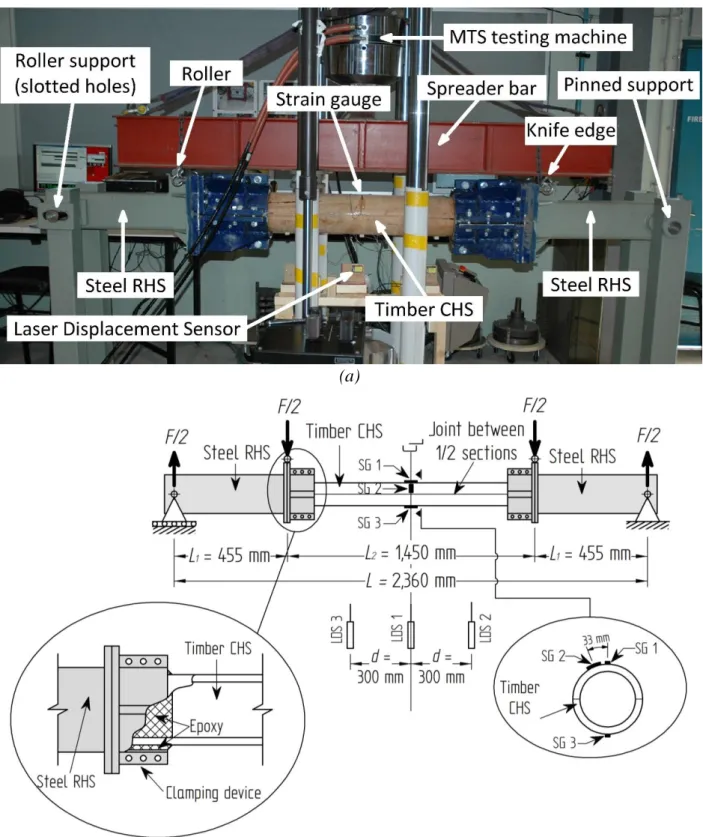
similar manner to the one reported in [2]. A pair of four reinforced quarter steel tubes, 240 mm long, 169
were designed and manufactured to rigidly clamp each end of the CHS, as shown in Figure 4. Each 170
steel clamp was bolted to a steel Rectangular Hollow Section (RHS) to form a 2,360 mm long beam. 171
To avoid local crushing of the timber CHS and fully transfer the moment from the steel RHS to the 172
timber with minimum stress concentration, two part epoxy resin was poured at the steel-timber con-173
nection (i) in the inside of the timber CHS filled with plywood and (ii) on the outside of the timber 174
CHS to match the inside diameter of the four quarter steel tubes. On top of the friction forces applied 175
by the clamps to the timber, screws connecting the steel to the timber were also added to further 176
prevent sliding of the timber sections in the clamps. The overall test set-up is shown in Figure 5. 177
The sections were then tested in a 500 kN capacity MTS universal testing machine, with the load 178
being applied to the steel RHS, as shown in Figure 5. The tests were run in displacement control and 179
reached failure in 3-4 minutes for the slender sections and 5-6 minutes for the compact sections. For 180
all tests, the butt joints between two half-sections lied in the horizontal plane. 181
Three Laser Displacement Sensors (LDS) recorded the vertical displacement at the bottom fibre 182
of the timber sections for simplicity in the test set-up. Additionally, two 30 mm strain gauges (SG) 183
recorded the mid-span longitudinal strain at the top (compression) and bottom (tension) fibres of the 184
timber CHS. A third 30 mm strain gauge recorded the mid-span tangential stress to better apprehend 185
the cross-sectional deformation. Locations and numbering of all LDS and strain gauges are given in 186
Figure 5 (b). The 300 mm distance between LDS was chosen so the edge LDS are away for the 187
clamping ends while placing the LDS the further away from each other. 188
3.3.2 Evaluations
189
The applied moment M to the hollow timber sections is calculated as, 190
(
)
2 1 L F F M = + w (3) 191where F is the total applied load, Fw = 2.37 kN is the gravity load applied by the steel rig (including 192
the steel CHS and measured at the points of application of the load) and L1 = 455 mm is given in 193
Figure 5 (b). The bending capacity Mb is defined as the maximum applied moment M and the bending
194
strength fb is obtained from the well-known equation, 195 Z M f b b = (4) 196
where Z is the section modulus calculated from the measured cross-sectional dimensions, assuming 197
a perfect composite action between the two half cross-sections. 198
The relative displacement δ of the timber sections is calculated from the displacements δ1, δ2 and 199
δ3 recorded by the LDS number 1, 2 and 3, respectively, as, 200 2 3 2 1 = − + (5) 201
The static MOE Es parallel to the grain of the timber sections is calculated from the bending stiff-202
ness EsIs defined as, 203 2 2 d k I E t s s = (6) 204
where Is is the second moment of area of the CHS (calculated from measured dimensions), d is given 205
in Figure 5 (b) and kt is the stiffness of the linear part of the experimental moment-displacement curve 206
(M-δ), calculated by performing a linear regression between 5 kN.m and 20 kN.m for the compact 207
sections and 2.5 kN.m and 15 kN.m for the slender ones. Note that Eq. (6) assumes that the relative 208
displacement δ is measured at the neutral axis. Yet, using the relative displacement measured in this 209
study at the bottom fibre of the section provides accurate results, with a maximum error in determin-210
ing EsIs of less than 0.5%. 211
3.4 Shear tests
212
3.4.1 Test set-up
213
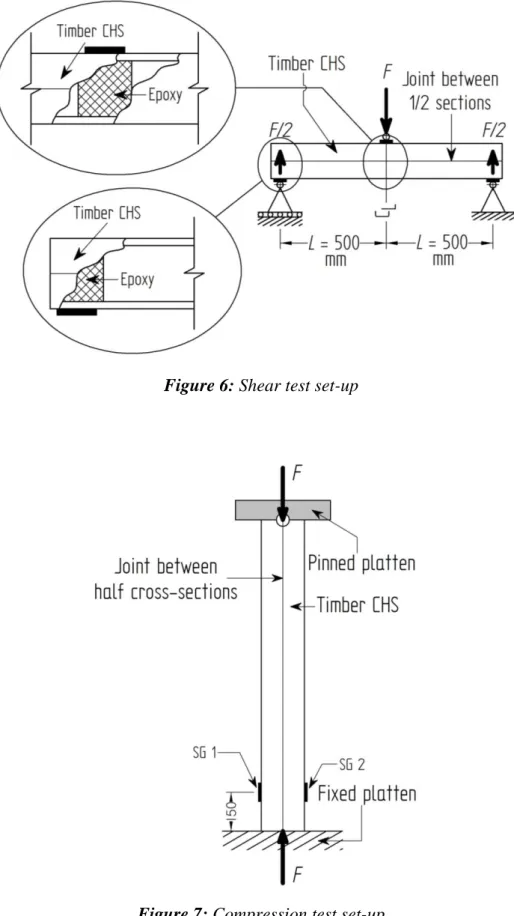
To estimate the shear strength of the timber CHS, the sections were tested in three point bending, 214
similarly to the tests performed in [1]. The sections were simply supported with a distance L = 500 215
mm between two consecutive loads, as shown in the schematic test set-up in Figure 6. To avoid local 216
crushing of the sections, two part epoxy resin (combined with plywood) was poured inside the CHS 217
at the load application point and supports. The butt joints between two half cross-sections lied in the 218
horizontal plane. For each set, the half cross-section which was in compression in the bending test 219
(Section 3.3) was also in compression in the shear test. The tests were performed in a 500 kN capacity 220
MTS universal testing machine in displacement control and reached failure in 6-8 minutes for all 221
sections but for S_G3 which was tested at a higher strain rate and reached failure in 2 minutes. 222
3.4.2 Evaluations
223
The shear strength fs of the hollow timber sections is calculated using the shear area of a CHS as 224 [30], 225 + + + = 2 2 2 2 max 2 3 i i o o i o s R R R R R R A F f (7) 226
where Fmax is the total maximum applied load, A is the measured CHS cross-sectional area, and Ro 227
and Ri are the measured CHS external and internal radii, respectively. The shear capacity Vs is calcu-228 lated as Fmax/2. 229 3.5 Compressive tests 230 3.5.1 Test set-up 231
To measure the compressive strength and stiffness of the timber CHS, the sections were tested in 232
compression in a 10 MN capacity MTS universal testing machine. The sections were positioned be-233
tween a fixed bottom platen and an upper platen mounted on a spherical seat, which could rotate. The 234
samples were mechanically sanded flat in a milling machine before testing to ensure a uniform contact 235
pressure between the platens and the CHS. The tests were performed in displacement control and 236
reached failure in 3-4 minutes for the slender sections and 5-6 minutes for the compact sections. The 237
test set-up is shown in Figure 7. 238
Two diametrically opposed 30 mm strain gauges, glued parallel to the column axis, each located 239
in the middle of a half cross-section and 150 mm from the bottom end of the sections, recorded the 240
longitudinal deformation. Strain gauges numbering is given in Figure 7. 241
3.5.2 Evaluations
242
The compressive stress σ of the hollow timber sections is calculated as, 243 A F = (8) 244
where F is the applied load and A is the measured CHS cross-sectional area. The compressive capacity 245
Rc and strength fc are defined as the maximum applied force and compressive stress, respectively. 246
The static MOE Es is calculated by performing a linear regression on the linear part of the stress-247
strain curve (σ-ε) between 5 MPa and 40 MPa. The strain ε is calculated as the average of strains ε1 248
and ε2 from strain gauges 1 and 2, respectively. 249
250
4. RESULTS AND DISCUSSION
251
4.1 Material properties
252
Table 1 gives the tensile and compressive strengths of the material of each half cross-section of 253
each investigated set. As the veneer MOE increases with the grade, so typically does the measured 254
material strength [31]. For the LVL samples, the compressive strength ranges from 58.6 MPa (S_G1) 255
to 77.9 MPa (C_G3 and S_G3), and the tensile one from 96.3 MPa (C_G1) to 135.8 (C_G3). Due to 256
the nature of the brittle tensile failure mode compared to the ductile compressive failure mode of 257
timber samples, the Coefficients of Variation (CoV) of the tensile test results are typically higher than 258
the ones of the compressive test results. The average oven dry moisture content at the time of testing 259
of the tension and compression samples is reported in Table 2. 260
4.2 Bending tests
261
4.2.1 Capacities and failure modes
262
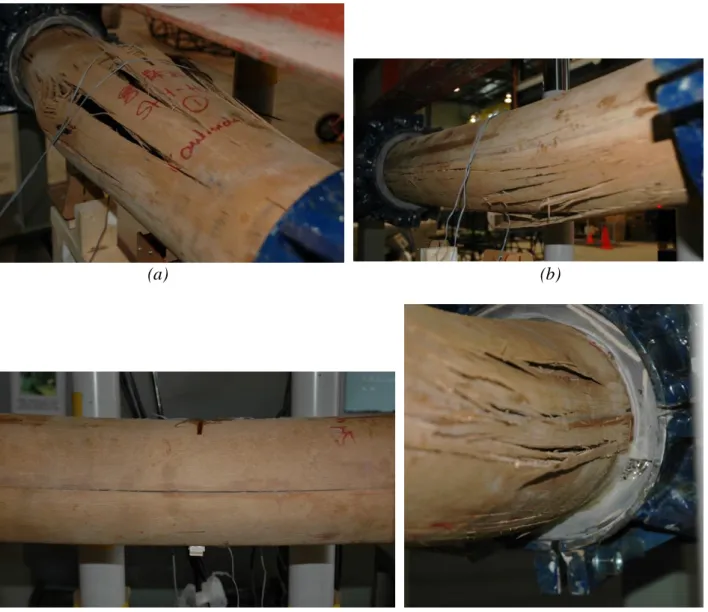
The bending capacities Mb and strengths fb for all CHS tested in bending are reported in Table 3, 263
along with the measured static MOE Es (Eq. (6)) and observed failure modes. Two of the slender 264
sections (S_G1 and S_G3) failed in buckling of the compression fibre, with the section opening up, 265
as shown in Figure 8 (a). Slender S_G2 and compact C_G1 sections failed in tensile rupture, as shown 266
in Figure 8 (b). The cross-banded CHS (C_G2_Cross) prematurely failed in the butt joint between 267
the two half cross-sections, as shown in Figure 8 (c). This weak zone was only observed for all testing 268
configurations in C_G2_Cross, as later reported in Sections 3.4 and 0. In all other sections and sec-269
tions tested in [1, 2], failure never developed in the butt joint. For compact sections C_G2 and C_G3, 270
the steel clamps did not provide sufficient restraints and the sections ultimately slid at the steel-timber 271
connections, leading to shear failure, as shown in Figure 8 (d). However, the maximum bending 272
stresses reached for these two sections are higher than the bending strengths fb of all other tested 273
sections. It is therefore very likely that the maximum recorded moments are within a few percent of 274
the bending capacities Mb of the sections. Noting that these maximum recorded moments represent 275
lower bound values of Mb, their values are conservatively taken for Mb herein for both C_G2 and 276
C_G3 sections. For all sections, the bending strength typically increases with the veneer MOE (or 277
grade). 278
The compact sections reached on average a bending strength fb 18% higher than the one of the 279
slender sections of the same grade. This result is attributed to different material strengths between 280
sections (Table 1) and possibly to the section compactness. Indeed, when buckling develops in the 281
compression zone of the slender sections, it would result in a loss in stiffness of the section wall, 282
consequently inducing a shift of the neutral axis and a higher stress in the tension zone. The sections 283
would eventually fail in the compression zone (S_G1 and SG_G3) or tension zone (S_G2), whichever 284
zone is the weakest. Such phenomenon would not occur for compact sections for which the compres-285
sive zone only experiences plasticity without buckling, as typically observed in timber beams [22]. A 286
similar tensile failure mode to the one experienced in timber beams would be therefore expected. 287
More investigations are needed to (i) fully comprehend the mechanisms involved in the observed 288
failure modes of the slender sections, (ii) validate the hypothesis in the above paragraph and (iii) 289
quantify the influence of the cross-sectional geometry, timber compressive and tensile strengths on 290
the full section capacity. Numerical models, similar to the one developed in [1], can be used to predict 291
the capacity of compact sections. 292
Note that the cross-banded section (S_G2_Cross) has a bending strength fb and static MOE Es 9% 293
and 55%, respectively, lower than the ones of the slender section of the same grade (S_G2). Cross-294
banded veneer-based CHS would gain further structural optimisation, such as number and thickness 295
of the cross bands. 296
4.2.2 Behaviour
297
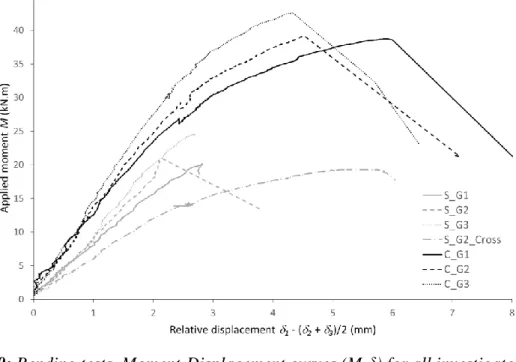
Figure 9 plots the Moment-Displacement curves (M-δ) of all investigated sections. While a large 298
non-linear behaviour is observed for the compact sections, it is limited for the slender sections, except 299
for the cross-banded one. As outlined in Figure 9, when failure occurred the moment suddenly 300
dropped for all sections. This observed drop for the two slender sections failing in buckling of the 301
compression zone (S_G1 and S_G3) is due to the sections opening up. 302
Figure 10 (a) shows the readings of the two strain gauges glued in the section longitudinal axis 303
(SG 1 and SG 3). Timber elements loaded in tension typically exhibit a linear behaviour until fracture 304
suddenly occurs at the maximum tensile strength, and the strain recorded on the tension zone (SG 3) 305
is consequently almost linear. Plasticity occurred on the compression side (SG 1) at an applied mo-306
ment of about 20-25 kN.m and 12-15 kN.m for the compact and slender sections, respectively. This 307
corresponds to bending stresses of about 60 MPa to 75 MPa, i.e. of the same order of magnitude of 308
the material compressive strengths reported in Table 1. Due to the buckling of the compression zone 309
for S_G1 and S_G3, reading of Strain gauge 2 reached a plateau for these sections at about 12,000 to 310
16,000 με. 311
The transverse strain recorded by SG 2 is plotted in Figure 10 (b). The figure mainly indicates that 312
the transverse strain significantly increased when plasticity damage occurred in the compression zone. 313
The strain reversal experienced for S_G1 and S_G3 is likely attributed to the buckling and ovalisation 314
of the cross-sections. 315
The average oven dry moisture content at the time of testing of the sections tested in bending is 316
reported in Table 2. 317
4.3 Shear tests
318
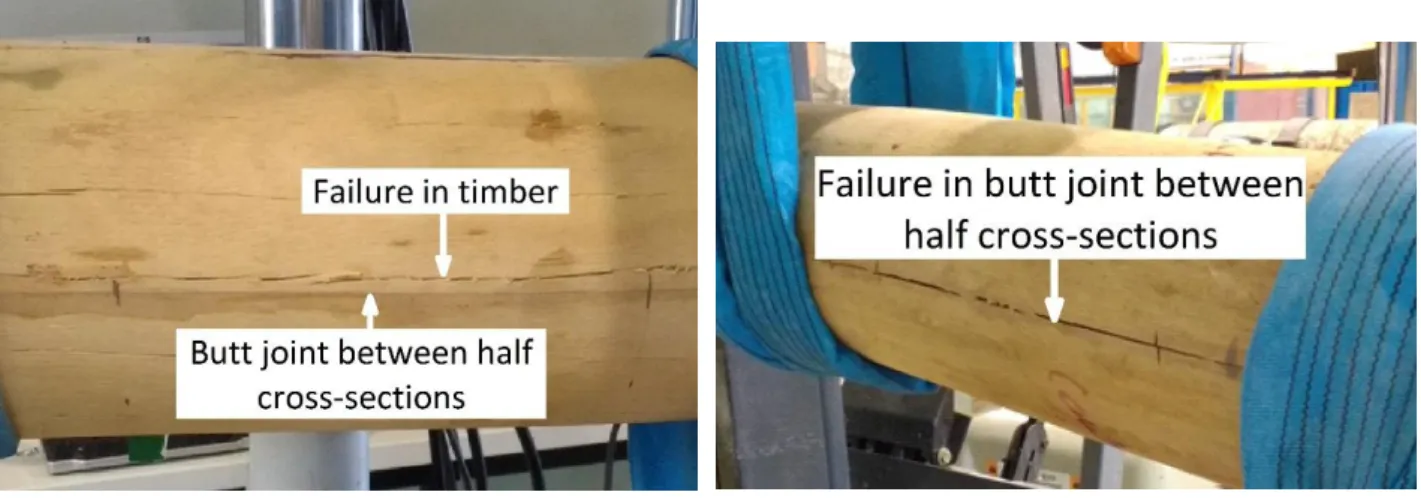
Table 4 gives the experimental shear capacities Vs and strengths fs for all investigated sections. All 319
sections failed in the timber except S_G2_Cross which failed in the butt joint between the two half 320
cross-sections. The two observed failure modes are shown in Figure 11. All sections reached a similar 321
shear strength of 10 MPa, +/- 7%, indicating that contrary to the bending tests, the grade does not 322
influence the shear capacity. Note that despite S_G2_Cross failing in the butt joint, it still reached a 323
strength of 10.4 MPa. Further optimisation of the cross bands layering may improve the shear capacity 324
of the CHS. 325
In terms of shear capacities, the slender sections sustained shear forces up to 32 kN and the com-326
pact ones up to 60.8 kN. 327
The average oven dry moisture content at the time of testing of the sections tested in shear is 328
reported in Table 2. 329
4.4 Compressive tests
330
The compressive stress-strain curves (σ-ε) of all sections are plotted in Figure 12. Two different 331
types of curves are observed resulting in two different failure modes. The compact sections showed 332
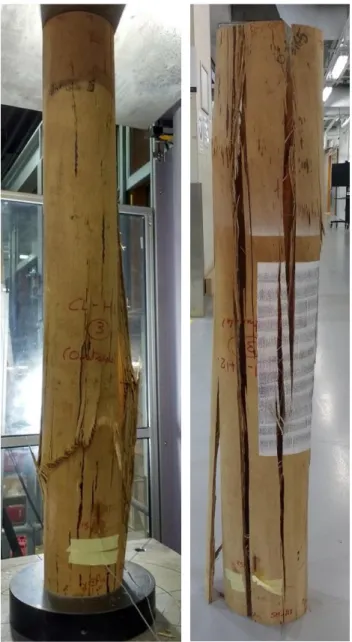
a large non-linear plastic behaviour, with the load reaching a plateau before gradually decreasing. A 333
portion of the section wall ultimately locally buckled in a compression type failure mode, as shown 334
in Figure 13 (a). This led to a sudden drop of the load with the section remaining in one single piece. 335
For the slender sections, a plastic behaviour usually started to develop but premature failure (i.e. 336
before the load reached a plateau as for the compact sections) suddenly occurred with the sections 337
bursting into (i) two half cross-sections, with the failure occurring in the butt joint, for S_G2_Cross 338
and (ii) six to seven strips for all remaining slender sections. The latter failure mode is shown in 339
Figure 13 (b) and was also observed in [13, 32] for formed wood profiles. The slender sections could 340
therefore not reach their potential full capacity and exhibited a failure mode which should be avoided 341
in structures. 342
The compressive capacities Rc and strength fc for all tested sections are reported in Table 5. The 343
ratios of fc to the average material compressive strength σcomp of the two half cross-sections (reported 344
in Table 1) are also given in the table. Similar to the bending tests, the compressive strength increases 345
with the veneer MOE (grade). Interestingly, both slender and compact sections reached a capacity 346
higher, up to 20%, than the one of the average measured compressive strength of the material. This 347
observation is in contradiction with the length effect [33, 34] encountered in timber structures for 348
which the larger the tested volume, the lesser the capacity. The circular shape of the section may 349
delay the compression failure of the cell walls when compared to the results reported in Section 4.1 350
and performed on flat panels. Further investigations are needed to validate and understand the ob-351
served phenomena. 352
The compressive capacity is high for both section types and reached about 400-500 kN for the 353
slender sections to about 800-1,000 kN for the compact ones. For the compact sections, the capacity 354
is in the range of the design load which may be encountered in the columns of mid-rise timber build-355
ings. 356
Also given in Table 5 are the static MOE Es of the sections measured from the linear part of the 357
stress-strain curves (σ-ε) and the ratios of Es measured from the bending tests to the one measured 358
from the compressive tests. The values of Es measured from the two types of tests are consistent with 359
an average difference between the two values of 4%. 360
4.5 Comparisons
361
The structural efficiency of the compact sections is compared herein to the one of steel and rein-362
forced concrete circular sections of similar (i) diameter and (ii) compressive short-term capacity to 363
the middle grade section C_G2 reported in Table 5. In a first instance only the short-term capacities 364
of the timber section is compared to the ultimate capacities of the steel and concrete counterparts, 365
which are calculated based on relevant Australian standards and without the use of the capacity factor 366
(resistance factor). Effect on long-term loading on the structural efficiency is discussed in a second 367
instance. 368
4.5.1 Comparison to steel CHS
369
A 168.3 (OD) × 4.8 (wall thickness) CHS, commercialised by the Australian manufacturer 370
Onesteel [35], is selected for the structural steel section. Its yield stress is 350 MPa. Based on the 371
Australian and New-Zeeland standard AS4100 [36], the steel section has ultimate bending, shear and 372
compressive section capacities of Mb = 44.8 kN.m, Vs = 311.2 kN and Rc = 864.5 kN, respectively. 373
Its compressive capacity is within 4% of the one of C_G2. 374
Table 6 compares the ultimate capacities, ultimate capacity to linear weight ratios, bending and 375
axial stiffness of the steel and timber sections. Densities of 805 kg/m3 for early to mid-rotation Gym-376
pie messmate veneers [37] and 7,850 kg/m3 for steel are used in Table 6. MOE of 200 GPa is also
377
used for the steel in the Table. 378
Results show that the timber CHS has a short-term bending capacity Mb comparable to and only 379
13% lower than the one of the steel CHS. Yet, the timber CHS is nearly twice more efficient in terms 380
of ultimate capacity to linear weight ratio. A similar conclusion applies to the compressive capacity 381
to linear weight ratio, with the timber section being more than twice more efficient than the steel 382
CHS. However, the steel CHS is stiffer than the timber profile, with the bending and axial stiffness 383
being 2.7 and 2.1 times higher, respectively. 384
Regarding the shear, the timber CHS performs poorly when compared to the steel profile. The 385
shear capacity Vs and shear to linear weight ratio of the steel CHS are 5.1 and 2.4 times higher, re-386
spectively, than the ones of the timber sections. However, for the sizes of timber beams typically 387
encountered in structural applications, i.e. with a span to depth ratio of 20 [38], the shear capacity of 388
the timber section would be high enough. A simply supported, 3.5 m long, 167×25 timber CHS loaded 389
with a UDL which fails at an ultimate bending moment of 39.1 kN.m (C_G2 in Table 3), would 390
experience a maximum shear force of 44.7 kN. This shear force is 26% lower than the shear capacity 391
recorded for C_G2 in Table 4. 392
For long-term loading, the Australian standard AS1720.1 [39] uses a duration of load factor of 393
0.57. Therefore, using the same 168.3 × 4.8 steel CHS and comparing it to the timber CHS, but under 394
long-term loading, the timber section becomes 1.08 and 1.28 times more efficient that the steel CHS 395
in term of bending capacity to linear weight ratio and compressive capacity to linear weight ratio, 396
respectively. In terms of shear capacity to linear weight ratio, the timber CHS now becomes 4.16 397
times less efficient than the steel CHS. 398
4.5.2 Comparison to reinforced concrete plain circular section
399
A 167 mm diameter plain reinforced concrete column, with a concrete compressive strength f’c = 400
40 MPa and a steel yield stress fy = 500 MPa, was designed to standard practices and the Australian 401
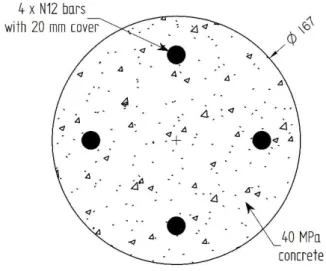
Standard AS3600 [40]. While it is understood that a 167 mm diameter concrete columns would usu-402
ally not be used in practice, it still forms a comparative solution to the performance of the timber 403
section. The concrete section is shown in Figure 14, has four N12 longitudinal reinforcing bars and 404
an R10 helix with a pitch of 150 mm. Based on the requirements in [40], a minimum concrete cover 405
of 20 mm is used with a minimum of 2% reinforcing steel by gross cross-sectional area. The AS3600 406
[40] gives ultimate bending, shear and compressive capacities of Mb = 11.9 kN.m, Vs = 92 kN and Rc 407
= 946.4 kN, respectively, for the concrete section. The compressive capacity of this column is there-408
fore within 6% of the one of C_G2. 409
Table 6 compares the ultimate capacities, ultimate capacity to linear weight ratios, bending and 410
axial stiffness of the concrete and timber sections. The density of concrete for the calculations pre-411
sented is 2,400 kg/m3 and the MOE is 32,8 GPa, in accordance to [40]. 412
The ultimate bending capacity of the concrete section is significantly lower (3.3 times lower) than 413
the short-term bending capacity of the timber section. This results in the timber section being 22 times 414
more efficient than the concrete one in terms of bending capacity to linear weight ratio. On the other 415
hand, the bending stiffness of the concrete section is twice higher than the proposed timber section 416
and nearly as stiff as the steel section. Note that the small diameter of the concrete column results in 417
the steel being placed close to the neutral axis and therefore an inefficiency in resisting bending mo-418
ments is introduced. It is anticipated that for columns of larger diameter, the efficiency of the concrete 419
column for these comparisons would improve. 420
In terms of shear, the shear capacity of the reinforced concrete section is 1.5 higher than the short-421
term shear capacity of the timber section, yet the concrete solution is 3.9 less efficient than the timber 422
one in terms of shear capacity to linear weight ratio. 423
The concrete section is also the least efficient option in terms of compressive capacity to linear 424
weight ratio. It is 5.6 times and 2.5 less efficient than its timber and steel counterparts, respectively. 425
Nevertheless, it outperformed both the steel (1.5 times higher) and timber (3 times higher) solutions 426
in terms of compressive stiffness. 427
Regarding long-term loading and considering a duration of load factor of 0.57 [39] on the results 428
in Table 6, the concrete section becomes 12.5, 2.2 and 3.2 times less efficient in terms of bending, 429
shear and compressive capacity to linear weight ratios, respectively, when compared to the long-term 430
loading capacities of the timber section. 431
432
5. CONCLUSION
433
This paper presented the bending, shear and compression capacities, and structural behaviour, of 434
hardwood veneer-based CHS manufactured from early to mid-rotation (juvenile) Gympie messmate 435
plantation thinned logs. Twelve 167 mm (OD) × 12.5 mm (wall thickness), referred to as “slender”, 436
and nine 167 mm (OD) × 25 mm (wall thickness), referred to as “compact”, 1.2 m long CHS were 437
produced in seven sets of three nominally identical sections. The sections were tested in bending, 438
shear and compression. A sudden failure mode was observed in the compression zone of the slender 439
sections tested in bending, while the compact sections failed in the tension zone. The section had 440
shear capacities of the same order of magnitude, within 7% of each other. In compression, the com-441
pact sections showed a ductile behaviour, while the slender sections catastrophically failed, with the 442
sections bursting into six to seven longitudinal strips. The section compressive strength was observed 443
to be consistently higher than the compressive strength of the material determined from tests per-444
formed of flat samples. Comparison to steel and concrete sections of similar outside diameter proved 445
that the timber sections were the most efficient in terms of bending and compressive capacity to linear 446
weight ratio. However, while the timber sections fell behind their steel and concrete counterparts in 447
terms of shear efficiency, they still showed enough shear capacity for structural applications. The 448
optimisation of the cross-banded layering may improve the shear capacity without significantly im-449
pacting the critical structural performances of the CHS. 450
451
6. ACKNOWLEDGMENTS
452
The authors would like to thank the Australian Research Council for its financial contribution 453
under project DE140100212. Mr Alexander Mainey glued the timber hollow sections. Mr Maxime 454
Fischer and Mr Julien Husson are also acknowledged for their valuable contribution in preparing the 455
hollow sections for testing and assisting during the tests. 456
457
REFERENCES
458 459
[1] B.P. Gilbert, I.D. Underhill, H. Bailleres, A. El Hanandeh, R.L. McGavin "Veneer Based 460
Composite hollow utility poles manufactured from hardwood plantation thinned trees", Construction
461
and Building Materials, 66, 458-466, 2014. 462
[2] B.P. Gilbert, I.D. Underhill, D. Fernando, H. Bailleres "Structural solutions to produce long timber 463
Veneer Based Composite hollow sections", Construction and Building Materials, 139, 81-92, 2017. 464
[3] I.D. Underhill, The development and assessment of engineered wood products manufactured from
465
low grade eucalyptus plantation thinnings, PhD Thesis, Griffith University, Gold Coast, Australia, 466
2017. 467
[4] H. Lu, A. El Hanandeh "Life cycle assessment of ACQ-treated Veneer Based Composite (VBC) 468
hollow utility poles from hardwood plantation mid-thinning", Sustainable Production and
469
Consumption, 36–50, 2016. 470
[5] H.R. Lu, A. El Hanandeh, B.P. Gilbert "A comparative life cycle study of alternative materials 471
for Australian multi-storey apartment building frame constructions: Environmental and economic 472
perspective", Journal of Cleaner Production, 166, 458-473, 2017. 473
[6] H.R. Lu, A. El Hanandeh "Environmental and economic assessment of utility poles using life 474
cycle approach", Clean Technologies and Environmental Policy, 19, 1047-1066, 2017. 475
[7] T. Hata, K. Umemura, H. Yamauchi, A. Nakayama, S. Kawai, H. Sasaki "Design and pilot 476
production of a spiral-winder for the manufacture of cylindrical laminated veneer lumber", Journal
477
of Wood Science, 47, 115-123, 2001. 478
[8] P. Berard, P. Yang, H. Yamauchi, K. Umemura, S. Kawai "Modeling of a cylindrical laminated 479
veneer lumber I: mechanical properties of hinoki (Chamaecyparis obtusa) and the reliability of a 480
nonlinear finite elements model of a four-point bending test", Journal of Wood Science, 1-7, 2011. 481
[9] P. Berard, P. Yang, H. Yamauchi, K. Umemura, S. Kawai "Modeling of a cylindrical laminated 482
veneer lumber II: a nonlinear finite element model to improve the quality of the butt joint", Journal
483
of Wood Science, 1-7, 2011. 484
[10] J. Wehsener, T. Werner, J. Hartig, P. Haller, "Advancements for the structural application of 485
fiber-reinforced moulded wooden tubes", Proceedings of the RILEM Conference “Materials and 486
Joints in Timber Structures - Recent Advancement of Technology” (Eds.: S. Aicher, H.-W. Reinhardt, 487
H. Garrecht), Stuttgart, Germany, 99-108, 2013. 488
[11] P. Haller, J. Hartig, J. Wehsener, "Application of moulded wooden tubes as structural elements", 489
Proceedings of the 2014 World Conference on Timber Engineering (Ed.: A. Salenikovich), Quebec 490
City, Canada, Paper ABS684, 2014. 491
[12] L. Wang, W. Liu, D. Hui "Compression strength of hollow sandwich columns with GFRP skins 492
and a paulownia wood core", Composites Part B: Engineering, 60, 495-506, 2014. 493
[13] J.U. Hartig, J. Wehsener, P. Haller "Experimental and theoretical investigations on moulded 494
wooden tubes made of beech (Fagus sylvatica L.)", Construction and Building Materials, 126, 527-495
536, 2016. 496
[14] A. Heiduschke, P. Haller "Fiber-Reinforced Plastic-Confined Wood Profiles Under Axial 497
Compression", Structural Engineering International, 20, 246-253, 2010. 498
[15] R.D. Adams, G.P. Krueger, A.E. Lund, D.D. Nicholas, "Development of utility poles from 499
composite wood material", Proceedings of the 7th IEEE/PES Transmission and Distribution
500
Conference and Exposition (Ed.: IEEE Service center), Atlanta, U.S.A., 37-40, 1979. 501
[16] C. Piao, Wood laminated composite poles, PhD Thesis, School of renewable natural ressources, 502
Louisiana State University, Louisiana, U.S.A., 2003. 503
[17] N.Ç. Yerlikaya, A. Aktaş "Compressive failure of spruce wood rings reinforced with glass epoxy 504
composite", Journal of Forestry Research, 26, 517-522, 2015. 505
[18] S. Hirschmüller, J. Pravida, R. Marte, M. Flach "Long-term material properties of circular hollow 506
laminated veneer lumber sections under water saturation and cement alkaline attack", Wood Material
507
Science & Engineering, 1-15, 2018. 508
[19] Lignotube, LignoTUBE – the new semi-finished product for lightweight construction, 509
http://lignotube.com/description/, 2017 510
[20] K+W Formholztechnik GmbH, Rings and Tubes,
511
http://www.formholz.de/produkte_und_loesungen/standardprodukte/ringe_und_roehren, 2017 512
[21] J. Bond, Foundations of tree risk analysis: Use of the t/R ratio to evaluate trunk failure potential, 513
in: Arborist news, December 2006, pp. 31-34. 514
[22] A.H. Buchanan "Bending Strength of Lumber", ASCE Journal of Structural Engineering, 116, 515
1213-1229, 1990. 516
[23] L.G. Brazier "On the Flexure of Thin Cylindrical Shells and Other "Thin" Sections", Proceedings
517
of The Royal Society, 116, 104-116, 1927. 518
[24] L. Brancheriau, H. Bailleres "Natural vibration analysis of clear wooden beams: a theoretical 519
review", Wood Science and Technology, 36, 347–365, 2002. 520
[25] CIRAD, BING® (Beam Identification by Nondestructive Grading) software, 521
https://www.picotech.com/library/application-note/non-destructive-testing-of-wood, 2012 522
[26] I.D. Underhill, B.P. Gilbert, H. Bailleres, R.L. McGavin, D. Patterson, "Structural Veneer Based 523
Composite products from hardwood thinning – Part I: Background and manufacturing", Proceedings
524
of the RILEM Conference “Materials and Joints in Timber Structures - Recent Advancement of
525
Technology” (Eds.: A. Aicher, H.-W. Reinhardt, H. Garrecht), Stuttgart, Germany, 577-588, 2013. 526
[27] S. Hirschmüller, J. Pravida, R. Marte, "Laminated veneer lumber poles for temporary soil 527
nailing- investigation of material properties", Proceedings of the 2016 World Conference on Timber
528
Engineering (Eds.: J. Eberhardsteiner, W. Winter, A. Fadai, M. Pöll), Vienna, Austria, Electronic 529
proceedings, 2016. 530
[28] AS/NZS 1080.1, Timber - Methods of test - Moisture content, Standards Australia, Sydney, 531
Australia, 2012. 532
[29] ASTM D3500-14, Standard Test Methods for Structural Panels in Tension, ASTM International, 533
Pennsylvania, USA, 2014. 534
[30] J. Wardenier, Hollow timber sections in structural applications, (Comité International pour le 535
Développement et l'Etude de la Construction Tubulaire), 2001. 536
[31] B.P. Gilbert, H. Bailleres, M.F. Fischer, H. Zhang, R.L. McGavin "Mechanical properties of 537
rotary veneers recovered from early to midrotation subtropical-hardwood plantation logs for veneer-538
based composite applications.", ASCE Journal of Materials in Civil Engineering, 29, 04017194, 539
2017. 540
[32] A. Heiduschke, J.M. Cabreo, C. Manthey, P. Haller, E. Gunther, "Mechanical behaviour and life 541
cycle asssessment of fibre-reinforced timber profiles", Proceedings of the Sustainability of
542
Constructions - Integrated approach to lifetime engineering (Ed.: COST Action C25), 338-346, 2008. 543
[33] J.D. Barrett, F. Lam, W. Lau "Size Effects in Visually Graded Softwood Structural Lumber", 544
ASCE Journal of Materials in Civil Engineering, 7, 19-30, 1995. 545
[34] B. Madsen "Length effects in 38 mm spruce–pine–fir dimension lumber", Canadian Journal of
546
Civil Engineering, 17, 226-237, 1990. 547
[35] Australian Tube Mills, Design Capacity Tables for Structural Steel Hollow Sections, Australian 548
Tube Mills Pty Ltd,, Sunnybank, Australia, 2013. 549
[36] AS 4100, Steel structures Standards Australia, Sydney, Australia, 1998. 550
[37] R.L. McGavin, H. Bailleres, J. Fehrmann, B. Ozarska "Stiffness and Density Analysis of Rotary 551
Veneer Recovered from Six Species of Australian Plantation Hardwoods", BioRessources, 10, 6395-552
6416, 2015. 553
[38] D.L. Schodek, Structures - 2rd Edition, (Prentice-Hall), 1992. 554
[39] AS 1720.1, Timber structures, Part 1: Design methods, Standards Australia, Sydney, Australia, 555
2010. 556
[40] AS 3600, Concrete structures, Standards Australia, Sydney, Australia, 2009. 557
558 559
560
(a) (b)
561
Figure 1: (a) circular hollow section currently developed in Australia (shown for compact and
562
slender 167 mm (OD) Gympie messmate) and (b) principle of half cross-sections butt joined
to-563
gether to form a complete CHS
564 565
566
Figure 2: Set-up to assess the longitudinal MOE
567 568
569
Figure 3: Manufacturing process of the half cross-sections
571
572
Figure 4: Clamps to connect timber CHS to test rig
573 574 575
576 577 (a) 578 579 (b) 580
Figure 5: Bending test set-up, (a) overall picture and (b) schematic
581 582
583
Figure 6: Shear test set-up
584 585
586
Figure 7: Compression test set-up
587 588
589 (a) (b) 590 591 592 (c) (d) 593
Figure 8: Bending tests failure modes (a) buckling of the compression zone (shown for S_G3), (b)
594
Tensile rupture (shown for C_G1), (c) initial failure in the butt joint for C_G2_Cross and (d)
prem-595
ature failure at the steel-timber connections (shown for C_G2)
596 597 598
599
Figure 9: Bending tests, Moment-Displacement curves (M-δ) for all investigated sections
600 601
602 603 (a) 604 605 (b) 606
Figure 10: Bending tests, Strain gauge readings for all investigated sections (a) longitudinal strain
607
gauges (SG 1 and SG 3) and (b) transverse strain gauge (SG 2)
608 609
610
(a) (b)
611
Figure 11: Shear tests failure modes (a) failure in the timber for all sections but C_G2_Cross
612
(shown for S_G3) and (b) failure in the butt joint for C_G2_Cross
613 614
615
Figure 12: Compression tests, Stress-Strain curves (σ-ε) of all investigated sections
616 617
618
(a) (b)
619
Figure 13: Compression tests failure modes, (a) local buckling of the wall for the compact sections
620
(shown for C_G1) and (b) sudden failure with the sections bursting into strips for the slender
sec-621
tions with no cross-banded veneers (shown for S_G2)
622 623
624
Figure 14: Concrete section used for comparison purposes
625 626
627 628
Table 1: Average compressive and tensile strengths of the material (numbers in brackets indicate 629
the number of tests on which the average and Coefficient of Variation (CoV) are calculated) 630
Half cross-section 1(1) Half cross-section 2(1)
Set σcomp (MPa) CoV (%) σtens (MPa) CoV (%) σcomp (MPa) CoV (%) σtens (MPa) CoV (%) S_G1 61.2 (3) 4.2 109.5 (5) 21.4 58.6 (3) <0.1 96.7 (3) 7.3 S_G2 65.5 (3) 5.3 101.0 (4) 31.1 69.2 (3) 3.5 119.1 (5) 11.4 S_G3 72.7 (3) 3.2 114.0 (5) 31.9 77.9 (3) 3.4 --(2) --(2) S_G2_Cross(3) 54.0 (3) 0.5 94.4 (5) 5.3 59.9 (2) 12.3 88.9 (5) 15.7 C_G1 67.0 (2) 1.9 99.3 (5) 6.9 64.4 (4) 3.4 96.3 (5) 7.7 C_G2 67.8 (2) 7.2 117.2 (5) 8.7 66.7 (4) 1.6 134.0 (5) 11.8 C_G3 77.9 (2) 3.6 133.0 (5) 8.8 71.3 (3) 2.4 135.8 (5) 11.5
(1): Half cross-section #1 in tension and half cross-section #2 in compression during the bending and shear tests
631
(2): Samples lost by the external company which CNC cut the samples
632
(3): Strengths calculated using the gross measured cross-sectional area which includes cross-banded veneers
633 634
Table 2: Average measured moisture content (MC) for material testing and full cross-sections 635
(numbers in brackets indicate the number of samples on which the average and Coefficient of Vari-636
ation (CoV) are calculated) 637
Sample type Test type MC (%) CoV (%)
Material testing Compression 13.7 (10) 3.4
Tension 11.3 (14) 5.7
Full cross-sections Bending 13.7 (4) 4.2
Shear 12.2 (4) 1.9
638
Table 3: Bending tests results 639 Set Capacity Mb (kN.m) Strength fb (MPa) MOE Es (MPa) Failure mode
S_G1 20.1 96.9 20154 Compression (buckling) failure
S_G2 21.0 96.3 23252 Tension failure
S_G3 24.6 116.7 27883 Compression (buckling) failure
S_G2_Cross(1) 19.3 88.5 14947 Failure in joint between 1/2 cross-sections
C_G1 38.7 116.1 18590 Tension failure
C_G2 39.1 119.0 21666 Failure at support with steel clamps
C_G3 42.6 128.6 23331 Failure at support with steel clamps
(1): Strength f
b calculated using the gross measured cross-section which includes cross-banded veneers 640
642
Table 4: Shear tests results 643
Set Capacity Vs (kN) Strength fs (MPa)
S_G1 30.5 10.3 S_G2 29.5 9.5 S_G3 30.9 9.9 S_G2_Cross(1) 32.0 10.4 C_G1 53.9 9.5 C_G2 60.8 10.7 C_G3 58.5 10.6 (1): Strength f
s calculated using the gross measured cross-section which includes cross-banded veneers 644
645
Table 5: Compression tests results 646 Set Capacity Rc (kN) Strength fc (MPa) MOE Es (MPa) Section strength fc / material strength σcomp
Es (bending) / Es (compression) S_G1 438.2 68.6 18824 1.15 1.07 S_G2 451.4 70.0 20592 1.04 1.13 S_G3 488.0 80.3 24709 1.07 1.13 S_G2_Cross(1) 372.3 58.4 16343 1.02 0.91 C_G1 784.0 72.0 17852 1.10 1.04 C_G2 897.8 80.4 20849 1.20 1.04 C_G3 992.4 89.3 24529 1.20 0.95 (1): Strength f
c calculated using the gross measured cross-section which includes cross-banded veneers 647
648
Table 6: Structural efficiency of circular timber, steel and reinforced concrete sections 649
Bending Shear Compression
Section Mb (kN.m) Mb / linear weight (kN.m/kg) Stiffness EI (kN.m2) Vs (kN) Vs / linear weight (kN/kg) Rc (kN) Rc / linear weight (kN/kg) Stiff-ness EA (kN) Timber (C_G2) 39.1 4.4 6.15×10² 60.8 6.8 897.8 100.0 2.37×10⁵ Steel (168×4.8) 44.8 2.3 1.65×10³ 311.2 16.1 864.5 44.6 4.94×10⁵ Concrete 11.9 0.2 1.22x10³ 92.0 1.8 946.4 18.0 7.18×10⁵ 650