An energy consumption evaluation for existing, commercial buildings
by
Lauren Leigh Brannom Damron
B.S., The University of Texas at Austin, 2014
A REPORT
submitted in partial fulfillment of the requirements for the degree
MASTER OF SCIENCE
Department of Architectural Engineering and Construction Science College of Engineering
KANSAS STATE UNIVERSITY Manhattan, Kansas
2017
Approved by: Major Professor Julia Keen
Copyright
Abstract
The intent of this report is to recommend a process for legislation that can be used to identify commercial buildings that have the greatest potential to reduce energy consumption. A point-based evaluation is completed of current energy processes for existing commercial
buildings. The recommended energy evaluation system is applied to an existing building, which allows for a detailed review of how the evaluation is completed for a building. The results are presented to display the value of assessing building energy performance. Additionally, the results reinforce the potential to transform the industry and energy use by buildings.
Table of Contents
List of Figures ... v
List of Tables ... vii
Acknowledgements ... viii
Chapter 1 - Background of Study ... 1
The Importance of Existing Buildings in the Energy Landscape ... 1
Evaluating Energy Consumption ... 6
Building Energy Consumption Legislation ... 9
Chapter 2 - Statement of the Problem ... 13
Chapter 3 - Comparison of Existing, Commercial Building Benchmarking Systems ... 18
Benchmarking Systems ... 18
ENERGY STAR ... 19
LEED ... 21
Building Energy Quotient ... 24
Green Globes ... 26
Energy Asset Score ... 28
Comparison of Benchmarking Systems ... 30
Chapter 4 - Application of Building Benchmarking Process... 32
Case Study Building ... 32
ENERGY STAR’s Portfolio Manager ... 35
Building Energy Quotient ... 38
Chapter 5 - Results and Analysis of the Rating Methods ... 42
Chapter 6 - Recommendation and Conclusion ... 45
References ... 47
Appendix A - Energy Benchmarking in Legislation ... 49
Appendix B - Leadership Studies Building LEED Scorecard ... 53
Appendix C - Portfolio Manager Navigational Images ... 54
Appendix D - Leadership Studies Building Workbook ... 69
Appendix E - bEQ Certification Results ... 77
List of Figures
Figure 1.1 United States' Energy Consumption Use Distribution by Type. ... 2
Figure 1.2 Projected Electricity Generation Additions by Generation Source. ... 3
Figure 1.3 Growth of the Built Environment. ... 5
Figure 1.4 State-level Energy Code Adoption. ... 10
Figure 3.1 Cumulative Energy Star Certifications. ... 20
Figure 3.2 LEED O+M Fee Breakdown. ... 23
Figure 3.3 Point Scale for Energy Asset Score. ... 29
Figure 4.1 Leadership Studies Building's Electricity Consumption from 2012 to 2017. ... 34
Figure 4.2 Leadership Studies Building's Average Energy Consumption. ... 35
Figure B.1 Leadership Studies LEED Scorecard ... 53
Figure C.1 Portfolio Manager Homepage. ... 54
Figure C.2 Required Data for College/University Building Type. ... 55
Figure C.3 Data Collection Worksheet, Page 1. ... 56
Figure C.4 Data Collection Worksheet, Page 2. ... 57
Figure C.5 Data Collection Worksheet, Page 3. ... 58
Figure C.6 Data Collection Worksheet, Page 4. ... 59
Figure C.7 Data Collection Worksheet, Page 5. ... 60
Figure C.8 Portfolio Manager's Properties Webpage. ... 61
Figure C.9 Property Addition Webpage. ... 62
Figure C.10 Property Summary Webpage. ... 63
Figure C.11 Property Details Webpage. ... 64
Figure C.12 Property Energy Webpage. ... 65
Figure C.13 Property's Metered Data Entry Webpage... 66
Figure C.14 Property Goals Webpage. ... 67
Figure C.15 Property Design Webpage. ... 68
Figure D.1 bEQ Workbook Form 1. ... 69
Figure D.2 bEQ Workbook Multiple Use Sheet. ... 70
Figure D.4 bEQ Workbook Electricity Metered Data Sheet. ... 72
Figure D.5 bEQ Workbook Natural Gas Metered Data Sheet. ... 73
Figure D.6 bEQ Workbook Form 3, Page 1. ... 74
Figure D.7 bEQ Workbook Form 3, Page 2. ... 75
Figure D.8 bEQ Workbook Form 3, Page 3. ... 76
Figure E.1 bEQ Sample Certificate. ... 77
Figure E.2 bEQ Sample Dashboard. ... 78
Figure E.3 bEQ Sample Plaque. ... 79
Figure F.1 ASHRAE Copyright Permission ... 80
Figure F.2 USGBC Copyright Permission 1... 81
List of Tables
Table 3.1 Evaluation of Portfolio Manager ... 21
Table 3.2 Evaluation of LEED O+M: Existing Building. ... 24
Table 3.3 Evaluation of bEQ In Operation. ... 26
Table 3.4. Evaluation of Green Globes: Existing Building. ... 27
Table 3.5 Evaluation of Energy Asset Score. ... 30
Table 3.6 Comparison of Evaluated Systems. ... 31
Table 5.1 Portfolio Manager's Resulting EUIs. ... 43
Acknowledgements
I would like to begin by thanking Julia Keen, my graduate advisor, for her dedication to mentoring my graduate career and master’s report. I would not have had the same graduate experience without her assistance, and I would not want it to be any different. Additionally, I would like to thank the Kansas State University’s Facilities Department employees, Ed Heptig and Gary Weishaar, for their patience and assistance with energy and building information, as well as providing access to the Leadership Studies Building. Furthermore, Leadership Studies department Director, Mary Hale Tolar, and her assistant, Monica Strathman, are the heroines who assisted by supplying detailed information about the Leadership Studies Building. Also, the Engineering Extension office and the Institute for Environmental Research, specifically David Carter and Garrett Mann, require thanks for procuring the equipment necessary to assess the indoor environmental quality. Last, but not least, I need to thank Lilas Pratt of ASHRAE for educating me on bEQ. All the above people contributed to this report, and it would not have been possible without them.
In addition to the technical assistance, I would like to acknowledge my family for all their support and encouragement in completing my master’s report. My husband’s commitment to being the primary dog caretaker, handyman, and maid have been invaluable to me throughout this journey; I would not be at this stage in my career without him. Also, my parents have been amazing cheerleaders; they have reminded me time and again that I am capable of attaining my goals.
Chapter 1 - Background of Study
Primarily, this report’s purpose is to determine the best process to assess energy consumption by buildings; its secondary purpose is to supply legislative jurisdictions with a process that can be implemented with the intent to reduce the building sector’s energy
consumption in the United States. The scope is limited to United States’ rating and certification systems (later referred to as energy evaluation systems) for existing commercial buildings that use energy consumption as a major portion of the evaluation.
Chapter 1 discusses the existing commercial building landscape in the United States, the current terminology associated with energy evaluation systems, and the existing legislation pertaining to building energy evaluation. Chapter 2 presents the importance of building energy evaluation systems as a tool to encourage increased energy efficiency. Current energy evaluation systems are examined to select the most appropriate candidate to comparing existing buildings in Chapter 3. The recommended energy evaluation system is then detailed and applied to a case study facility – outlined in Chapter 4. Chapter 5 summarizes the results of the case study, which is used as the basis for recommendation. The final chapter, Chapter 6, applies the over-arching concepts from Chapter 5 to the commercial building landscape and the legislation associated with energy consumption of existing buildings.
The Importance of Existing Buildings in the Energy Landscape
With the enforcement and continued development of energy codes, new buildings will continue to increase in energy efficiency, but the ever-increasing number of buildings will result in an increased total load on the existing energy grid (U.S. Energy Information Administration, 2015). Energy in the form of electricity is particularly important because it is the form thatrecent data available, but based on the past values, it is expected that electricity will continue increasing as a larger percentage of energy consumption. For the last 3 decades, electricity has become a larger portion of energy consumption overtime. As a result, electricity generation and distribution is of the utmost importance in the United States.
As the demand for electricity increases, buildings will experience power disruptions more frequently due to consumption exceeding electrical generation. If energy consumption is allowed to increase unchecked, power plants will need to increase energy generation rates by building new power plants or expanding the ones currently in use. Electricity is currently produced from many resources such as fossil fuels, water dams, nuclear reactors, wind farms, etc. The U.S. Department of Energy Information Administration (EIA) used energy data from 2012 to predict the necessary electricity generation additions, which is presented in Figure 1.2. The data
indicates not only the quantity of electricity needed, it indicates from what energy resources the The Energy Information Administration. (2017). [Cumulative percent bar chart of energy use
in the United States]. Retrieved from https://www.eia.gov/consumption/commercial/
electricity may be generated. The indication of resource consumption is important with regards to the impact on the environment. Although the environmental impact of energy consumption is not the motivator, a decrease in overall consumption will reduce the conversion rate of fossil fuels to energy. As a result, the goal for the United States should be to reduce energy
consumption as opposed to generating more power.
Existing commercial buildings are the target of this research. The analysis conducted in this paper is based on information provided by the United States’ government entity, the U.S. EIA, which monitors energy data of commercial buildings using the Commercial Buildings Energy Consumption Survey (CBECS). CBECS was first administered in 1979. Since then, it has gathered commercial building information such as “structure, ownership, types of energy used, HVAC and other energy related equipment, office equipment and computers, and lighting type” (U.S. Energy Information Administration, 2015). The survey is completed via a
The Energy Information Administration. (2017). [Cumulative bar chart]. Retrieved from https://www.eia.gov/todayinenergy/detail.php?id=17131
gathered is utilized in a modeling program to simulate energy use and cost. The results from the models create the CBECS tables, which contain statistical information pertaining to energy consumption and characteristics of commercial buildings. The data is essential to understanding the landscape of commercial buildings in the United States. Yet, to gather, analyze, and create the CBECS tables requires time (three years) and financial support.
The process begins by EIA employees gathering data from building owners and utility companies during the latter half of the year following the reference year, which is the year the data represents. The most recent report, CBECS 2012, was published in its entirety in 2016. It is based on data gathered from the 2012 reference year by in-person and over-the-phone interviews. The sample contains information for 6,700 buildings in the United States; half of the building owners provided information pertaining to energy consumption and cost, and utility companies provided the other half of energy data through the Energy Supplier Survey (ESS). The EIA administered the ESS during the spring and summer of 2013 (the year following the initial interviews), which concluded the gathering phase of the CBECS 2012. At this time, the EIA is able to begin modeling the raw data, analyzing the results, and creating the tables. For the most recent reference year, the EIA began releasing portions of the CBECS tables during the fall of 2015. Although this process provides meaningful information about commercial buildings, inconsistent funding prevents the creation of CBECS tables for every reference year. As a result, this report uses the most current data, the 2012 reference year (U.S. Energy Information
Administration, 2015).
To interpret the data from the CBECS tables, a definition of commercial buildings is necessary: according to the EIA (2015), commercial buildings are “buildings greater than 1,000 square feet that devote more than half of their floor space to activity that is not residential,
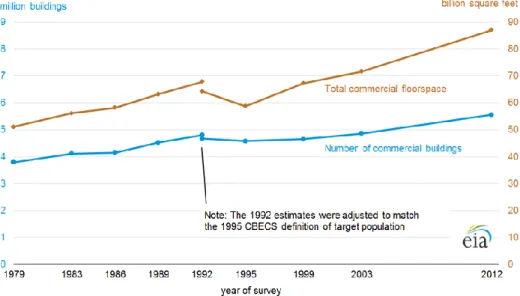
manufacturing, industrial, or agricultural” (About The Commercial Building Energy Consumption Survey section, para. 1). As a result, most buildings that are not places where people live are considered commercial. The administration has cataloged the quantity of buildings and their total square footage. Based on 2012 CBECS data, there are 5.6 million commercial buildings comprising 87 billion square feet of building area in the United States. Figure 1.3 shows how the amount of commercial buildings has changed over time. By the slopes being different, yet increasing, it indicates that newer commercial buildings are of greater gross floor area. As a result, newer buildings have the potential for greater energy consumption if advances in technology are not implemented and requirements for energy conservation are not enforced.
In 2011, a separate study by the U.S. Energy Information Administration concluded commercial buildings use 19 percent of United States’ energy consumption, which is 18
quadrillion BTU (U.S. Energy Information Administration, 2012). Of these structures, half were The Energy Information Administration. (2017). [Double-axis line chart].
Retrieved from https://www.eia.gov/consumption/commercial/
built prior to the year 1980 and a third were built during the 1980s and 1990s (U.S. Energy Information Administration, 2015). As a result, nearly 4.7 million of today’s commercial buildings in the United States were built prior to this millennium; they consumed a combined total of 5,373 trillion BTU in 2012 (U.S. Energy Information Administartion, 2016). This is important because ANSI/ASHRAE/IES Standard 90.1 - 2010 (Standard 90.1) has increased its energy efficiency from its 2004 version to its 2010 version by 23.4 percent (Goel, et al., 2014). Applying the changes in stringency of Standard 90.1 to the pre-millennial commercial buildings, an estimated energy consumption reduction of 1,257 trillion BTUs (approximately 7 percent of current usage) exists. This number is conservative because is assumes all the pre-millennium buildings meet the minimum efficiency values dictated by the Standard 90.1 – 2004, which is likely more efficient than the population, and it assumes a change in efficiency to meet ASHRAE 90.1 – 2010 when more current versions of the Standard 90.1 (2013 and 2016) have greater efficiency requirements. There is great potential for savings in the commercial existing building sector. For this to be done effectively, an evaluation of energy consumption is needed to
determine which buildings would benefit the most from increasing energy efficiency.
Evaluating Energy Consumption
There are two ways to assess existing building’s energy consumption: rating systems and certification systems. The major difference between the two is how a building is represented among its peers and/or a standard. A rating system produces a numerical result, while a certification system produces a classification or level. An example of a rating system is a standardized test, such as the American College Testing (ACT). Evaluators present the results from the ACT as a score. A score indicates how well an individual performed based on a specific scale. The key to a score is it allows for a comparison between each individual score in a specific
and measurable way. Alternatively, a certification system is best represented as a letter grade. A letter grade represents a range of scores that allow for ranking between groups, but does not provide the ability to distinguish between individuals within a group. Both a score (rating) and a grade (certification) have related use. A grade quickly shows the performance level of a student based on the professor’s expectations, which is represented through a grading scale created by the professor. The scale is based on the professor’s expectations of his or her students’
performance; therefore, the scale is subjective. When a scale is created, judgments are made that are subjective by nature. Yet, with a score, a numerical value represents a student’s knowledge of content. This scale has a subjective quality due to how the points are distributed, but the
subjective quality does not account for expectations. The element of removing subjectivity makes a score a truer representation of ability than a grade; this is also true of ratings and certifications. A certification represents a group of peoples’ expectations of what is excellent, while a rating measures the level of excellence. For an evolving field such as building energy consumption, a certification will need to be adjusted as ideas of excellence and available
technology change over time – an energy efficient building in 1960 is likely to not be considered efficient today. Without change, the scale will become outdated and will not be an accurate representation of performance. For this reason, a rating is more objective because it is a measure of performance at any time regardless of peoples’ opinions and changes in technology.
Specific to building energy consumption, rating systems use numerical values for comparison. The first is energy utilization index (EUI), which is the average annual energy consumption per square foot (kBTU/yrft2). There are two types of EUI scores available: site EUI
and source EUI. Site EUI represents the energy used by the property within the property boundary line, which is independent of the power source; source EUI represents the energy
consumed by the site and includes the energy losses due to energy generation and transmission infrastructure. By multiplying the specific site energy consumed with an efficiency factor (accounts for energy loss during conversion of energy and transporting the energy from the source to a building), the annual source energy consumption can be determined; note that any site-produced energy has a factor of one. Although both EUIs are useful for rating buildings, this report is concerned with building energy consumption as it affects utility infrastructure, which makes the source EUI the preferred rating value.
The other numerical rating value is ECI, which is the acronym for energy cost index. ECI is the average annual energy cost per square foot ($/yrft2). The cost for an ECI comes from the amount of money an owner spends on fuel and/or electricity to power the building at the site level. Although this score is useful for owners, it does not always directly scale with the amount of energy consumed. For example, a building that primarily uses site-generated solar and wind energy will have a low ECI because there is not an external cost of energy. Alternatively, if the same building solely uses energy from the utility grid, the ECI will be higher yet the site EUI will remain the same. Additionally, other methods of power production, building characteristics, and local energy cost can influence an ECI to indirectly trend with site and source EUI. This makes ECI less reliable as a measure for evaluation and building comparison.
Another aspect of energy evaluation systems is terminology. Some rating systems provide certificates; therefore, they call themselves certifications. For the purpose of this report, any system that uses an EUI to generate a level of certification is considered a rating system. Additionally, the report will use the term “certification system” for systems that use point accumulation to provide the level of certification. Lastly, another term in the industry is energy benchmarking, which uses a pre-determined value or goal to assess whether a building is
considered energy efficient or not. Although this is a different evaluation logic than a rating, benchmarking systems may use ratings as the qualifier.
Building Energy Consumption Legislation
In this section, legislation pertaining to limiting or benchmarking energy consumption of buildings is discussed. Items covered will include the levels of legislation that have been
adopted, locations that have passed such legislation, building type classifications as well as other important criteria used in legislation. The section will conclude with a discussion of trends related to such legislation and the role of legislation and its importance moving forward.
Currently in the United States, legislation exists at the federal, state, county, and city jurisdictional level for building energy performance. Nearly all jurisdictions adopt energy codes for newly constructed commercial buildings. The most common of these are the model codes, International Energy Conservation Code (IECC) and Standard 90.1, or other locally developed energy codes (Chow, 2016). Figure 1.4 is a map depicting the level of energy code stringency adopted and enforced at the state jurisdictional level. The helpful aspect of this figure is it can be used to identify states that are likely to have the greatest potential for reducing energy
consumption. It should not be assumed all buildings within that state conform to the minimum requirements for energy efficiency because this is regulation enforced on only new construction. Energy consumption evaluation is necessary for each existing building because there is no reference or indicator to make a generalized evaluation.
In response to the need to address the efficiency of existing buildings, new legislation is being developed, which is tabulated in Appendix A. The table, which separates laws by
jurisdiction, includes information about when a building energy assessment is required, how frequently a building must be assessed, and what enforcement measures exist. As seen in U.S. Department of Energy’s Office of Energy Efficiency & Renewable Energy. (2017).
[Color-coded map]. Retrieved from https://www.energycodes.gov/status-state-energy-code-adoption
Appendix A, there is not a standard template that has been adopted into legislation but rather each jurisdiction is developing their own policies that target specific outcomes. The existing policies vary in three primary areas: the types of buildings that are required to show compliance, the frequency a building needs to be assessed, and whether or not a building’s rating is required to be reported. The following paragraphs further discuss these differences.
The major categories of building type classifications used in existing legislation are public/government, non-residential, multi-family residential, and single-family residential
(Institute for Market Transformation (IMT), 2017). These categories separate buildings by owner more than by occupancy type. Occupancy type takes into account the occupants’ primary
function or activity within the space. The current building type classification system is valid if the categories are used exclusively to denote which buildings require ratings; the system is not valid if they are used to establish a source EUI goal. For example, in the non-residential category there are many occupancy types, such as retail stores, medical centers, schools, etc. Each of these building occupancy types have varying characteristics that directly affect their EUI. Differences in operating hours, occupant activity, indoor environmental quality requirements, code
minimums, and specialty equipment are examples of such attributes. If legislation requires a specific EUI to be met without considering occupancy type, facilities requiring systems that are especially energy intense such as healthcare would either raise the threshold (allowing for other building classifications to be less efficient) or not meet the defined EUI limits.
Another aspect to consider for policy is the frequency of assessing energy consumption. Currently, an assessment has two different triggers dictated in legislation: a specified date or a specific event (Institute for Market Transformation (IMT), 2017); yet, some jurisdictions do not specify frequency of assessment. The date trigger is used for annual assessments; the annual
evaluation functions similarly to vehicle registration. The specific event trigger usually occurs when the property is being sold, rented, or refinanced, and the results are supplied to the prospective owner(s) or tenant(s). Most jurisdictions use date trigger, but Washington State, Seattle, and Austin use event triggers to determine assessment frequency. Additionally, the frequency of assessment is important because each year newly constructed and more efficient buildings reduce the average energy used by the existing building stock.
A final aspect to consider is what entity is responsible for collecting and/or enforcing the energy assessments. The entities available are the authority having jurisdiction (AHJ), a third-party-operated organization, or the parties involved with a transaction. In current legislation, both AHJ and third-party-operated organizations are used for specific date assessments while reporting to parties involved in a transaction for the property are used for specific event
assessments. These reporting options can also be combined as is done for properties in the city of Berkley, California.
At this time, implemented legislation compares various building types with inconsistent rating frequencies and different entities to collect the ratings – if reporting is required. As jurisdictions consider adoption of policies to address existing commercial building energy consumption, the current means of categorizing buildings is effective. However, there needs to be more uniform adoption of setting a defined frequency of rating and reporting of energy consumption. Without this, owners can span decades between ratings therefore potentially not being aware of the opportunities for improvement.
Chapter 2 - Statement of the Problem
As demand of utilities increases, it is imperative to reduce the energy use of existing commercial buildings – the second largest sector of the built environment within the United States (the largest sector being residential buildings). In order to determine which buildings have the greatest potential to reduce energy consumption, an effective evaluation of each building’s energy performance needs to occur. Without an energy evaluation system for existing buildings, the evaluations are subjective and open to interpretation. Ideally, a rating or certification system will consider the climate, building characteristics, and the energy consumption of the building to create a fair comparison. Without a comparison, each building’s benchmark would be based on reducing energy based on past consumption – not average energy consumption of similar
buildings. Knowing an average value for energy consumption, a determination can be made as to which buildings have the greatest energy reduction potential based on realistic expectations.
The goal of this study is to evaluate the different energy benchmarking systems to determine which is the most effective for future regulation and to propose a specific rating system that is best suited for incorporation into policy. To do this in an objective manner, each energy benchmarking system needs to be evaluated. This is accomplished using a point-based evaluation system that allocates points in specific categories. The categories incorporated into evaluation are the complexity of the benchmarking system, the degree to which energy is represented, whether a third party ensures the accuracy of the data, how much it costs to complete the benchmarking system, whether indoor environmental quality (IEQ) is verified as being adequate, and the familiarity of the system to the public. The following paragraphs discuss the categories of the benchmarking system evaluation, which is applied in the following chapter to the reviewed benchmarking systems.
The first category is complexity. For this report, complexity is based on the amount of “red tape” involved and the ease an individual, unassociated with the benchmarking system, can understand the benchmarking process. The first aspect of complexity, the “red tape,” is a key aspect to consider; it can increase the degree of difficulty to benchmark a building. Some examples of “red tape” are the number of forms (tactile or electronic) necessary to complete the assessment, the number of individuals involved with the assessment (collection, application, and submission) process. The difficulty can be mitigated from an owner’s perspective if a third party is involved who completes all necessary correspondence and submissions – this typically results as an additional expense to the owner since a fee is paid to a third party for this service. Although this may appear to simply re-direct the issue, the third party is likely experienced or been
instructed in completing the evaluation system, which increases efficiency. Some benchmarking systems require a third party that is certified by the benchmarking system’s administrator to make the submission. The second aspect of complexity is the ease of understanding the
benchmarking system’s evaluation and results. The goal of a benchmarking system is to reduce energy consumption, but, if the results are difficult to interpret, a recommendation for energy efficiency improvements is more difficult to justify. Additionally, a system of high complexity that is unclear as to how a result was determined will require inquiry and justification by a professional affiliated with the benchmarking program. As a result, building owners and consultants can become frustrated and benchmarking associates can be inundated with
justification requests. For these reasons pertaining to “red tape” and understanding the system’s evaluation process, high complexity is seen as counterproductive.
The second category to consider is the degree to which energy consumption is
paper have energy as a portion of the evaluation process, not all systems place the same importance on energy use. Recognizing the ultimate objective of this paper is to identify a benchmarking system to drive reduction in commercial building energy consumption, the system must have energy as a large portion. If not, other categories contributing to the benchmarking system results will skew correlation between the results and the energy consumption. To prevent this, the recommended benchmarking system will require a minimum of 50 percent of the results to be directly related to energy use.
The third category for consideration is third party involvement. Third party involvement is important for two reasons: reduced effort for the owner and assurance of accuracy of the benchmarking input and results. By reducing the required involvement by an owner, the system is less likely to interrupt their current workload. Reducing this interruption, owners as a whole will be more accepting of the benchmarking system than they would be if it caused a high degree of disruption. In addition to reducing owner effort, a knowledgeable and experienced third party can be expected to increase the accuracy of the results of the benchmarking system.
Benchmarking result’s accuracy is based on two factors: accurate information and correct completion of the benchmarking system. Any third party is expected to be educated in aspects pertaining to the information required for completion, such as utility data, building systems, and IEQ. Additionally, third parties associated with a specific assessment system are experienced in completing all required documentation as well as understanding the collected and submitted information. Due to the reduced effort for the owner and the ability to increase accuracy of results, a third party is identified as a necessary requirement for the recommended benchmarking system.
The fourth category to evaluate is the cost to benchmark a building. Higher cost inhibits the frequency of benchmarking. Cost can be separated into several components: base cost for benchmarking, third party or professional fees, acceleration fees, auditing fees, etc. The base cost is the absolute minimum cost to benchmark a building by excluding all optional fees and third party or professional expenses. Third party expenses are a result of employing a third party. Acceleration fees—fees for speeding up the process—are not applicable or desirable for all applications for all benchmarking systems, but they are an option for some evaluation systems. The auditing fee is an expense paid to the evaluation’s organization for reviewing the results of the benchmarking system in the case an owner believes a mistake was made. There are many variations of cost pertaining to benchmarking systems, so, to allow for a fair comparison, only the base cost is used for evaluation.
The fifth category for evaluation is IEQ. IEQ consists of lighting, thermal comfort, and air quality. Each aspect of IEQ is expected to meet the requirements of health and safety codes mandated within a building’s jurisdiction as well as meet recommended levels for good design. Energy is used to achieve appropriate IEQ conditions. Yet, not all systems allow for energy to be reduced without consideration of the effect on the building IEQ which directly relates to
occupant comfort and productivity as well as meeting code minimum requirements. An example of an energy saving measure that compromises IEQ is to reduce the amount of outdoor air ventilation below code minimums. This will reduce energy consumption, but when reduced below code minimums the safety of the occupant is at risk. For this reason, IEQ must be assessed to assure that code expectations are maintained at a minimum when reducing energy
The final category is familiarity. As a rule, people prefer to use things they are familiar with. With familiarity, an expectation and level of trust has already been determined. This notion applies to benchmarking systems as well. If the public is familiar with a benchmarking system or the entity that supplies the benchmarking system, they are more likely to accept the validity of the system. Therefore, if a benchmarking system or its associated entity are commonly known to have a positive reputation, then the system will be considered to be familiar and earn the point in this category.
The intent of a recommended benchmark system is to produce a result that has a very strong correlation with energy efficiency; this results in the energy category being the most fundament for selection. The next category of importance is IEQ, which ensures indoor environmental quality meets, at a minimum, the code requirements to provide occupant health and safety is mandatory of the recommended system. Finally, third parties allow the assessment system to be complex while fully encapsulating the complex field of building energy efficiency. As a secondary advantage, the third party consultant reduces the coordination and involvement of building owners. This likely will minimize the resistance from a building owner which may otherwise hinder the enactment of the policy.
Based on the evaluation of rating and certification systems, each system can earn up to 1 point in each of the six categories previously described. A maximum of 6 points can be
achieved; the higher the point total, the more desirable the evaluation system. Additionally, there are categories defined as mandatory concerning this report; these categories are energy, third party involvement, and IEQ. Any system that meets the requirements of these three categories is eligible to be the recommended benchmarking system. Chapter 3 will utilize this evaluation system as the basis for comparing benchmarking systems.
Chapter 3 - Comparison of Existing, Commercial Building
Benchmarking Systems
In the United States, there are many different building evaluation systems. However, those considered in this report have been narrowed down to only the systems that apply to existing commercial buildings that have energy consumption as a component of the building’s evaluation. This report is targeting existing commercial buildings because it is anticipated they can have the greatest reduction of demand on the energy grid. This chapter compares the available rating and certification systems for this building sector. The chapter begins by introducing each of the systems and then comparing the systems with the ultimate objective to identify the best system for consideration for adoption through legislation.
Benchmarking Systems
This section provides an overview of the different rating and certification systems found in the U.S that meet the characteristics defined in Chapter 2: complexity, energy composition, third party involvement, cost, IEQ, and familiarity. A point will be awarded for each of the following: low complexity, energy comprises at least 50 percent of the rating or certification, a third party is required, zero cost, IEQ is assessed, and the evaluation system or its organization is familiar to the public. The list of the narrowed rating and certification systems considered
includes Energy Star’s Portfolio Manager, Leadership in Energy and Environmental Design (LEED), Building Energy Quotient (bEQ), Green Globes, and the Energy Asset Score. The format of the subsections progresses by increasing detail. Each subsection begins with an
introduction to the system, its origins, and the category type in the first paragraph. The second paragraph includes the aspects evaluated by the assessment and the proportion that each aspect is
weighted in the assessment. The final paragraph includes other important information, such as cost and third party involvement, which affect building owners.
ENERGY STAR
Under the Office of Energy Efficiency and Renewable Energy, the Environmental Protection Agency (EPA) developed the Energy Star rating system. Initially, Energy Star was introduced in 1992 to certify energy consuming appliances but was expanded to certify low-energy consuming buildings. As a result, the public trusts Energy Star as a leader in low-energy conservation. Figure 3.1 shows the certification statistics from 2001 through 2015, which indicates Energy Star becoming more familiar to the public. The Portfolio Manager is Energy Star’s online tool used to manage rating information and to produce ratings for existing
buildings. The Portfolio Manager contains many ratings for buildings in terms of a normalized EUI that produces a statistically reliable average EUI for most building types. It is common for other rating systems to use the building type average EUIs determined by the Portfolio Manager (ENERGY STAR, n.d.).
An Energy Star rating is a percentile that is determined by a weather-normalized source EUI that is compared to the average source EUI for the building type. By separating buildings by type, the EUI accounts for variations in building operational hours and the typical loads of different building types. The percentile systems that Energy Star utilizes only compares EUIs within each calendar year. As a result, the average normalized source EUI decreases each year due to newer technology used in buildings and more energy efficient buildings coming online which reduces a buildings’ energy consumption. The comparison data set and average decrease annually, which makes it more challenging to achieve the same score each year without
pertaining to building characteristics and energy consumption. Other optional information, such as operational hours, a count of the number of computers, etc. can be recorded but is not required to attain a score. The energy data includes energy consumption and its associated cost, water consumption and its associated cost, and waste. After this information is input, a determination is made whether the score is high enough to certify the building through Energy Star: the rating must be in the 75th percentile or greater, which equates to a score of 75 or above (the average building is assigned a score of 50) (ENERGY STAR, n.d.).
The only cost of using this system is associated with a third party’s fee, and it is only in the event that the building receives a rating of 75 or higher and a certificate is desired by the owner. To be certified, a third party, being either a professional engineer (PE) or registered
Energy Star. (2017). [Cumulative line and bar chart]. Retrieved from
https://www.energystar.gov/buildings/about-us/find-energy-star-certified-buildings-and-plants
certificate is not desired, there is no cost to input a building in Energy Star because anyone can enter the information to attain the score. Because the certification is based on a rating that is a result of a building’s percentile for a specific calendar year, the certification is only valid for the year that it is rated as indicated on the certificate. To maintain a current Energy Star certification, a building must be evaluated annually (ENERGY STAR, n.d.).
Based on the above discussion, points are awarded as follows… The online portal is a simple system to use with detailed instruction. An owner or building representative simply inputs utility company recorded energy consumption each month; all other information is supplement and is not necessary to receive a score. As a result a point is awarded. The score is based entirely on energy, which allows for an additional point earned. A third party is not required to achieve a score, and a third party is the only associated cost with this system. Although IEQ is assessed prior to certification, it is not a prerequisite to receive a score. Lastly, Energy Star is a commonly known indicator of energy efficiency and has been present in the market for more than two decades. The results are depicted in Table 3.1 with five total points accumulated.
Table 3.1 Evaluation of Energy Star
Complexity Energy 3rd Party Completion Cost IEQ Familiarity Total
5
LEED
The LEED certification system was developed by the U.S. Green Building Council (USGBC) in the year 1998. It has had several updates with the current version being v4. USGBC offers certifications for 5 different applications: Building Design and Construction (BD+C), Operations and Maintenance (O+M), Interior Design and Construction (ID+C), Neighborhood
Development (ND), and Homes (HOMES). This report is reviewing LEED O+M for existing buildings (U.S. Green Building Council, 2017).
LEED uses a scorecard to accumulate points as a means to determine the awarded
certification level; although this is a certification system, the category of the scorecard pertaining to energy does require a rating as a prerequisite. LEED certifications have four levels: Certified (40 to 49 points), Silver (50 to 59 points), Gold (60 to 79 points), and Platinum (80 or more points). Buildings must meet the perquisites prior to accumulating points in a category of the scorecard. There are a total of 110 points available. The LEED O+M existing building scorecard has 8 categories: Location and Transportation (up to 15 points), Sustainable Sites (up to 10 points), Water Efficiency (up to 12 points), Energy and Atmosphere (up to 38 points), Materials and Resources (up to 8 points), Indoor Environmental Air Quality (up to 17 points), Innovation (up to 6 points), and Regional Priority (up to 4 points). The Energy and Atmosphere category qualifies this certification system to be included in this report. One of this category’s
prerequisites is the building must receive a rating of 75 or higher through Energy Star’s Portfolio Manager, or, if unable to receive a rating, it must perform 25 percent better than at least three buildings within its building type. Since this is a prerequisite, if not met, then the building is unable to be certified (U.S. Green Building Council, 2017).
To complete a LEED O+M existing building certification, there are several things to consider in addition to the above certification qualifications. A third party must be used who has the designation of a LEED Accredited Professional (LEED AP) – the clarified certification type will follow this acronym. This person is necessary to complete all the documentation and
submission forms required. For a LEED O+M existing building project, the LEED AP O+M will complete nearly 50 forms for a single project. The number of forms vary by certification and sub
certification category (e.g. O+M and Existing Building). In addition to the third party professional, another aspect to consider is the cost of certification. As a LEED member (the highest discount available), the minimum cost in 2017 is $3,100; this value is based on the registration fee ($1,200) and the minimum certification review fee ($1,900) listed in Figure 3.2. The final consideration of the LEED certification is the frequency of certification. The
certification was awarded for a specific year, so to maintain a current certification the building must be re-evaluated each year (U.S. Green Building Council, 2017).
In summation, a LEED certification requires a lot of documentation, which makes it a U.S. Green Building Council. (2017). [Table]. Retrieved from
http://www.usgbc.org/cert-guide/fees#om
required to complete all the documentation. A minimum level of energy efficiency is required to earn points in the Energy & Atmosphere category; even if all points were earned for the
category, energy could only comprise 35 percent of the certification. Another prerequisite is to establish that IEQ is met, which is done by the LEED AP during the on site assessment. A LEED expense, therefore it does not receive a point in the associated evaluation category. Finally, LEED is a popular evaluating system and has been in existence for nearly 20 years which qualifies it as a familiar system. Three points were accumulated by the LEED O+M system as displayed in Table 3.2.
Table 3.2 Evaluation of LEED O+M: Existing Building.
Complexity Energy 3rd Party Completion Cost IEQ Familiarity Total
3
Building Energy Quotient
ASHRAE, a non-profit professional organization, developed a rating system known as the Building Energy Quotient, which is referred to as bEQ. It was introduced to the industry in 2012. This system offers a certificate based on the rating for two different categories: “bEQ – As Designed” and “bEQ – In Operation.” This study looks only at the In Operation rating because it applies to existing buildings. ASHRAE is currently adapting how it accepts information for the rating process. Prior to Fall 2017, third parties submitted rating documentation via an Excel Workbook to ASHRAE for approval. This submission process has changed to a web-based portal to make data entry easier and more efficient.
ASHRAE represents the bEQ level as a letter grade with an accompanying description. A lower score results in a greater level of certification because lower values reflects lower energy consumption. The levels available are Zero Net Energy (A+; 0 or less rating), High Performance
Inefficient (D; 115 to 145), and Unsatisfactory (F; 145 or greater). The 6 categories contained in the workbooks used for evaluation includes Building Characteristics, Water Use, Energy
Calculations, Indoor Environmental Quality (IEQ), Energy Savings, and Energy End Use. The Energy Calculations combined with the Building Characteristics provide a normalized source EUI score, which is compared to a climate zone specific median source EUI for the multi-use occupancy types, if applicable. The climate zone median is derived from CBECS data for each climate zone and occupancy use – just as Energy Star does. ASHRAE adjusts the CBECS data using methods from AHSRAE Standard 100, which has its process prepared by Oak Ridge National Laboratory in document ORNL/TM-2014/215. In addition to a score, the system provides a list of energy efficiency measures that if incorporated into the building would likely result in its ability obtain the next highest certification level. The recommendations include information about the payback time and the initial cost (Building Energy Quotient, n.d.). This list of energy efficiency measures emphasizes the desire to see improvement in existing building performance rather than to just benchmark current performance.
To complete a bEQ certification, a third party is required. The third party is either an ASHRAE Certified Building Energy Assessment Professional (BEAP) or a PE licensed in the state that the building is located. A third party is necessary because information in the workbook requires technical expertise. Yet, other than fees associated with a BEAP, there will be no cost for submitting for a certification on the online format, which is available starting in
mid-November (Pratt, 2017). Like the other systems reviewed so far, the certificate identifies the year of certification. ASHRAE recommends recertifying the building every three years due to
Star; this prevents excessive assessment that will overload ASHRAE and be more expensive for an owner (Building Energy Quotient, n.d.).
Table 3.3 indicates the point allocation for bEQ. The system requires significant data collection and input as well as requires coordination with a third party to complete an on-site assessment. This qualifies it as a complex and costly system. The on-site assessment is when the third party verifies the building is conforming to IEQ standards. Additionally, the score and certification resulting from the evaluation is solely dependent on energy consumption. Lastly, although the general public may not know ASHRAE well, the engineering community uses ASHRAE’s technical documents as the basis of the model energy code.
Table 3.3 Evaluation of bEQ In Operation.
Complexity Energy 3rd Party Completion Cost IEQ Familiarity Total
4
Green Globes
Green Globes is a certification system that was created by the non-profit organization Green Building Initiative (GBI). GBI is a Canadian company that originally based their energy rating systems on the popular energy rating system used in Europe, Building Research
Establishment Environmental Assessment Method (BREEAM); GBI converted Green Globes for the American market in 2004. Since then, they consider themselves LEED’s direct competition. Green Globes offers 3 different certifications (New Construction, Existing Buildings, and Interiors). This report only considers the existing building certification (Green Building Initiative, 2014).
Green Globes offers 4 levels of certification for existing buildings based on a system comprised of 1,000 points that are converted into a percentage: One Globe (35 to 54 percent),
Two Globes (55 to 69 percent), Three Globes (70 to 84 percent), and Four Globes (85 to 100 percent). These points come from 6 different categories: energy, water, resources, emissions, IEQ, and environmental manager; the energy component itself comprises 35 percent of the overall point score (Green Building Initiative, 2014).
To complete the certification, Green Globes requires a pre-evaluation to verify the building is qualified for a certification. Like the previously covered programs, a third party is also required for this certification. However, it differs in that this person is a designated professional assigned by and contracted through Green Globes. This individual will provide a quote for the cost of the assessment during the pre-evaluation phase. After qualifying for evaluation and purchasing the assessment, the Green Globes’ assessment representative is assigned to the building. The purpose of the representative is to manage documentation for the rating process as well as perform an on-site assessment. As with the other systems, the
certification denotes a specific year (Green Building Initiative, 2014).
Table 3.4 represents the points earned by evaluating the Green Globes certification system. The system is complex due to the initial documentation submitted to GBI, which determines if the building meets qualifications to be certified as well as to determine the quoted price for certification. Upon payment, a third party is assigned whose fee is incorporated into the original quote. Although the certification does not have energy consumption as the focus of a majority of its points, it does verify that IEQ is satisfactory. Lastly, although the system has been used for a couple decades, it has not achieved as much notoriety as other systems.
Table 3.4. Evaluation of Green Globes: Existing Building.
Complexity Energy 3rd Party Completion Cost IEQ Familiarity Total
Energy Asset Score
Under the EPA, another energy rating system, Energy Asset Score (EAS), began in 2016. Although this rating system includes greater input detail pertaining to building characteristics than Energy Star requires, it uses the Portfolio Manager to assess energy performance. An analogy for the two rating systems is a microscope: Energy Star (microscope) captures some building characteristic details, but by using EAS (an additional magnifying lens) more detail is available, which provides greater understanding of energy consumption. In addition to the detail, EAS determines consumption by running simulations as opposed to calculations done by Energy Star. This system is only for rating energy consumption of commercial buildings, which
subsequently separates it from Energy Star; there is no certification available (Office of Energy Efficiency & Renewable Energy, 2016).
EAS indicates results on a 10-point scale with half-point increments, as seen in Figure 3.3. In addition to being visually simplified, the scale allows for comparison of what a potential score could be and where a building is compared to defined energy standards. It uses building energy simulation software to predict current energy consumption, which is then used in conjunction with the Portfolio Manager to produce a numerical score. EAS also uses the simulation software to predict potential scores with the implementation of energy efficiency measures that are later recommended as part of the final report provided to the owner. The simulations are generated using input information that includes general building information, envelope components, fenestration, lighting fixtures, mechanical components, service water
heating equipment, and operation information (Office of Energy Efficiency & Renewable Energy, 2016).
There is not a requirement of an on-site assessment or a third party to receive a score, which allows an owner or employee to complete the rating entirely on his or her own at little cost (because EAS is funded as a federal government program). Therefore, there is no external cost to the owner. All required information is submitted online. Important distinguishing features of this system is that it does not provide a certification, and its rating is only valid as long as the
building is unaltered from its evaluated state (Office of Energy Efficiency & Renewable Energy, 2016).
This system is meant to supply owners with more information about efficiency upgrades, but, in doing so, the complexity of the information needed to be input is not common knowledge for most building owners. The third party may still be needed depending on the owner and their staff’s knowledge and skill-set for the data collection. Not requiring a third party potentially brings questions to the validity of the results. The rating is completely dependent on energy
The Office of Energy Efficiency & Renewable Energy. (2017). [Image]. Retrieved from https://energy.gov/eere/buildings/building-energy-asset-score
consumption, but it is based on computer-based energy models – not solely on the buildings performance. Although the rating system is new, it is produced by the same organization who manages the Energy Star program. The point allotted are displayed as noted in Table 3.5.
Table 3.5 Evaluation of Energy Asset Score.
Complexity Energy 3rd Party Completion Cost IEQ Familiarity Total
3
Comparison of Benchmarking Systems
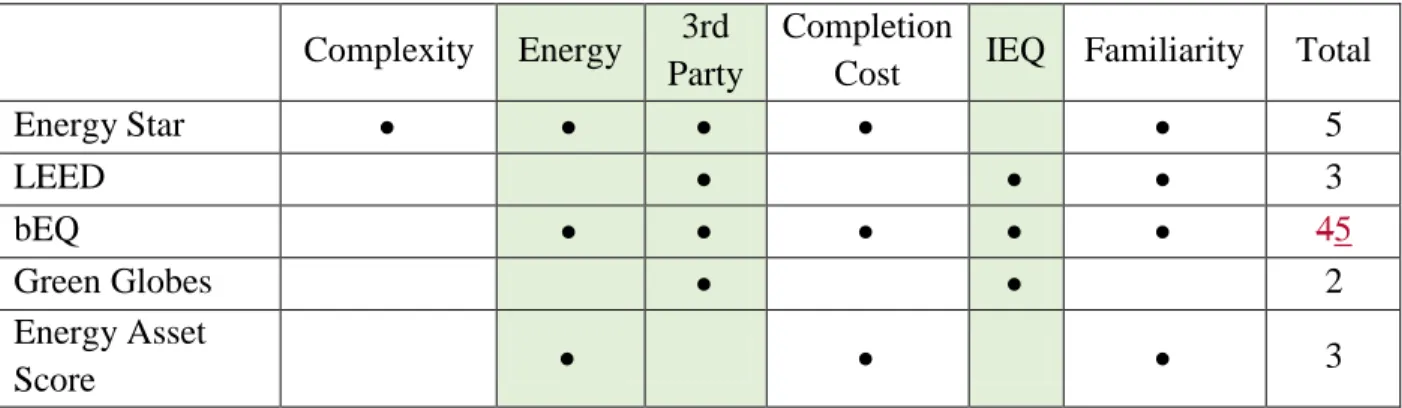
The purpose of this paper is to establish the most appropriate system to recommend to jurisdictions as they consider implementing legislation to address existing building performance. After introducing the 5 established evaluation systems applicable to existing buildings, aspects of each need to be compared to conclude which system is best for evaluating existing commercial building consumption. By comparing the benchmarking systems with respect to the mandatory categories and the total number of points, the recommended system is evident. In Table 3.6, each evaluation system is listed in order of discussion with the point distribution and total.
Additionally, the mandatory columns—energy, third party, and IEQ—have been highlighted green. As mentioned in the previous chapter, a system that is available for recommendation must have a point in each mandatory category.
As a result, Building Energy Quotient is the only eligible system for recommendation as a benchmarking tool. Yet, Energy Star does perform an IEQ assessment if a certification is completed; if legislation prescribes an Energy Star certification as the benchmarking goal, then it would be a viable candidate as well. Therefore, both Energy Star and bEQ will be assessed further to better understand both systems as applied to a case study building in Chapter 4. The chapter will discuss both system’s process of rating and the results of rating in detail.
Table 3.6 Comparison of Evaluated Systems.
Complexity Energy 3rd Party
Completion
Cost IEQ Familiarity Total
Energy Star 5 LEED 3 bEQ 45 Green Globes 2 Energy Asset Score 3
Chapter 4 - Application of Building Benchmarking Process
Chapter 4 demonstrates the case study certification process for Energy Star and bEQ. To best and most accurately represent this process, a specific building is used as an example. Items that are covered in this process description include how to attain or access the necessary data; preparation for and the actual building walk-through; required coordination with the owner, building engineer, or facility manager; and the submittal process for certification. Procedural instructions regarding rating completion are annotated within this chapter.
Case Study Building
The building used as the case study is the Leadership Studies Building located on Kansas State University’s main campus located in Manhattan, Kansas. This building operates
independently from campus central utility services (chilled water and steam). This is important because it allows for more accurate and simplified measurement of energy and fuel consumption. Pertaining to its characteristics, the Leadership Studies Building is an independent structure that is comprised of two above-grade levels for a total gross area of 36,842 square feet. The on-grade level consists primarily of classroom space but also includes a small café that serves espresso drinks, smoothies, breakfast and lunch foods, etc. The upper level contains employee offices and conference rooms. Based on these three occupancies, the Leadership Studies Building is a mixed-use occupancy containing office space (18,089 square feet), education space (17,103 square feet), and restaurant space (1,650 square feet).
The Leadership Studies Building’s construction was completed in 2010. It was certified as LEED BD+C: New Construction (v2.2) with a Gold level designation the same year. LEED BC+D: New Construction (v2.2) had a minimum consumption standard set as a prerequisite
IECC 2006. This compliance was modeled using energy simulation software (U.S. Green Building Council, 2017). Since the Leadership Studies Building completion, the facilities department has not implemented any changes to the original construction. The point allocation for the LEED certification is documented in the appendix, Table B.1.
The building’s utilities are from commercial providers for electricity, natural gas, and district water. Utility data for the years 2012 through 2016 was gathered for all three sources by the Kansas State University facilities department. In 2015, the facilities department noted that the electricity meter was faulty which lead to inaccurate readings from August 2014 through June 2015. In addition to this missing data, there was a concern with the electricity data for May through July of 2016 because it was not consistent with past performance; during these summer months, the electricity consumption was less than the lowest energy consumption otherwise recorded. This is shown graphically in Figure 4.1. These atypical summer months cannot be contributed to weather entirely because ventilation would still be required – preventing the energy consumption from being significantly less than evident in the spring or autumn. These minimums are during the months of February and November. As a result, the electrical consumption for June 2016 is too low for the conditions present during that month – mild air conditioning, ventilation, and building electrical load. The facilities department did not indicate any changes in operation; therefore, it is assumed that another faulty meter may be to blame.
Figure 4.1 Leadership Studies Building's Electricity Consumption from 2012 to 2017.
The inaccuracy of the electrical data collected from the Leadership Studies Building created implications when applying the two evaluation systems. The Energy Star and bEQ ratings use the most current utility data for electricity, natural gas, and water. This would have been from July 2016 through June 2017. With the discovery of the faulty meter, the data set for this time period would not provide an accurate rating. In an effort to create a representative data set to enable a rating to be conducted, the monthly utility data is averaged excluding the
electrical data from August 2014 through June 2015 to determine an approximate annual usage; these values account for discrepancies in annual weather cycles. The results are located in Figure 4.2.
In addition to the utility data, information about the building characteristics was attained from the as-built plans supplied by the facilities department, the Leadership Studies Building’s
230000 250000 270000 290000 310000 330000 350000 370000 390000 410000 En ergy in kBT U 2012 2013 2014 2016
webpage through the Kansas State University website, and the Leadership Studies’ director’s office. The information used for the two rating systems is from the above sources.
Figure 4.2 Leadership Studies Building's Average Energy Consumption.
ENERGY STAR’s Portfolio Manager
The Portfolio Manager tool as well as a step-by-step process to complete a rating is found on Energy Star’s webpage - energystar.gov; additionally, screenshots of the webpages applied to the Leadership Studies Building are provided in Appendix B. Before creating an account for the Portfolio Manager, a few fact-gathering steps need to occur, which begins on the Portfolio Manager homepage depicted in Figure C.1. The first of these tasks is to identify the building type. On the left of the webpage, a link list is provided; it contains “Identify your property type.” By clicking this link, it will direct you to the page to identify a building type. Primary building types are listed in the first bulleted list. Below the primary building types, there are lists of secondary building types. The secondary building types are more refined classifications. The Leadership Studies Building falls under the primary building type category of Mixed Use. This
Jan Feb Mar Apr May Jun Jul Aug Sep Oct Nov Dec
Electrical 333,21 300,91 308,62 305,44 333,01 332,50 362,35 364,39 329,63 312,98 287,37 330,00 Natural Gas 52,958 89,972 17,965 6,157 358 - 78 60 585 7,347 19,902 47,457 Combined 386,17 390,88 326,59 311,60 333,37 332,50 362,42 364,45 330,21 320,33 307,27 377,45 50,000 100,000 150,000 200,000 250,000 300,000 350,000 400,000 450,000 Co n su mp ti o n in kBT U p er Mo n th
individually: a primary building type of Education with a secondary building type of
College/University, a primary building type of Office with a secondary building type of Office, and a primary building type of Food Service and Sales with a secondary building type of Restaurant (ENERGY STAR, n.d.).
After identifying the building type, the next item is to determine what building characteristics are necessary based on the building type. To find this information, use “The benchmarking starter kit” link on the left side of the webpage. Once the page loads, hyperlinked text is on the page written in blue. Of the links available, click the “data collection worksheet” link, which will load a webpage that provides a tool to identify the necessary building
information; Figure C.2 is an image of this webpage. Use the drop-down menus to fill in the necessary information – the country where the property is built and the property type. For the Leadership Studies Building, the country location is the United States, and the secondary property type is College/University, Office, and Restaurant. Once this information is entered, click the “Lookup Required Data” button, which initiates a list of information that needs to be collected, including items specific to the secondary building type. The option to create a PDF or Word document is provided which is useful in efficiently collecting the necessary information. The resulting worksheet pages are provided in Figures C.3 to C.7 (ENERGY STAR, n.d.).
Once the listed information is collected, the next stage is to create a Portfolio Manager account. The creation of a Portfolio Manager account requires the entry of personal identification information: name, address, generation of a username, and password. Once an account is created, the webpage will open to “MyPortfolio” displaying all created properties as shown in Figure C.8; a first time user does not have any properties listed. To create a property, select the link on the right of the webpage “Add a Property.” In the case an entire portfolio of projects need to be
input, an Excel file can be used to create multiple properties at once. When creating the property, the gathered information from the list is added to the online system; this is done in a page
resembling Figure C.9. After creating the property, a user may select it to view, edit, or add information later (ENERGY STAR, n.d.).
Upon opening the webpage for a created building, there are seven tabs under the property information: Summary, Details, Energy, Water, Waste & Materials, Goals, and Design. The Summary tab, seen in Figure C.10, displays all results of the input data in a central location as well as provides common trends. The Details tab is used to add information to the property, such as optional building characteristics; for the Leadership Studies Building, the optional building characteristics that were added are the number of full-time equivalent employees and the number of computers – presented in Figure C.11. The three tabs labeled Energy (shown in Figure C.12), Water, and Waste & Material are used to input utility information. For the Leadership Studies Building, there are two meters under the Energy tab—one for electricity and one for natural gas; this is shown in Appendix Figure C.13. Once the information is recorded in the Portfolio
Manager, a graph is generated and available on the Energy tab that displays consumption. A similar process is followed for Water and Waste & Materials meters, but this information was not input for the Leadership Studies Buildings because the information does not contribute to generating a score. The tabs for Goals and Design are used to set targets for results and predicting scores reflecting potential changes to a property, and the details for these tools is shown in Figures C.14 and C.15.
The available results include an Energy Star score, source EUI, site EUI, energy cost, total greenhouse gas emissions, water usage, and total waste. The Energy Star score is the rating and is based on a weather-normalized source EUI compared to all other properties of the same
secondary property type; the details for the average property type is available under the Design tab. An Energy Star score is not available for the Leadership Studies Building because it is a multiuse building type, and a single building type does not comprise at least 50 percent of the total gross floor area. Even without a score, the Energy Star results do provide a weather-normalized source EUI and expresses the building performance in relation to other similar properties. In Chapter 5, the results of the rating are discussed (ENERGY STAR, n.d.).
Building Energy Quotient
The process for obtaining a rating using bEQ is simple from an owner’s perspective; a hired third party gathers the building characteristic information, conducts the building walk-through, and submits the information with ASHRAE’s bEQ web portal. As mentioned in Chapter 3, the third party must be either a BEAP or a PE. To find a qualified professional, an owner can visit the Building Energy Quotient website - buildingenergyquotient.org. Under the In Operation section, there is a link, “Find a bEQ Qualified Practitioner,” which prompts several fields: name, organization, certification type, and location. Once completed, a table lists BEAPs near the building’s location. If there is not a BEAP in the area, any Professional Engineer licensed within the building’s state is acceptable. Upon hiring a third party, the owner’s involvement is reduced to supplying the professional with building information and answering any questions that the professional may have (Building Energy Quotient, n.d.).
Once hired, the third party gathers information about the building through as-built
drawings, metered data, etc. in preparation for an on-site evaluation. They add the information to the Excel workbook, which is free to download from bEQ’s website under the In-Operation section. The workbook contains pre-formulated cells, input cells, and additional instructions to assist the third party with completing the workbook. Beginning November 2017, ASHRAE will