Von der Wirtschaftswissenschaftlichen Fakultät
der Universität Leipzig
genehmigte
DISSERTATION
zur Erlangung des akademischen Grades
Doctor rerum politicarum
Dr. rer. pol.
vorgelegt
von Dipl.-Wirtsch.-Inf. Richard Müller
geboren am 23. September 1983 in Dresden
Gutachter: Prof. Dr. U. W. Eisenecker Prof. Dr. B. Franczyk
Müller, Richard
Software Visualization in 3D – Implementation, Evaluation, and Applicability Leipzig University, Dissertation
126 Pages, 104 References, 25 Figures, 7 Tables, 8 Listings, 2 Appendices
Abstract
The focus of this thesis is on the implementation, the evaluation and the useful application of the third dimension in software visualization. Software engineering is characterized by a complex interplay of different stakeholders that produce and use several artifacts. Software visualization is used as one mean to address this increasing complexity. It provides role-and task-specific views of artifacts that contain information about structure, behavior, role-and evolution of a software system in its entirety. The main potential of the third dimension is the possibility to provide multiple views in one software visualization for all three aspects. However, empirical findings concerning the role of the third dimension in software visua-lization are rare. Furthermore, there are only few 3D software visuavisua-lizations that provide multiple views of a software system including all three aspects. Finally, the current tool sup-port lacks of generating easy integrateable, scalable, and platform independent 2D, 2.5D, and 3D software visualizations automatically.
Hence, the objective is to develop a software visualization that represents all important struc-tural entities and relations of a software system, that can display behavioral and evolutionary aspects of a software system as well, and that can be generated automatically.
In order to achieve this objective the following research methods are applied. A literature study is conducted, a software visualization generator is conceptualized and prototypically implemented, a structured approach to plan and design controlled experiments in software visualization is developed, and a controlled experiment is designed and performed to inves-tigate the role of the third dimension in software visualization.
The main contributions are an overview of the state-of-the-art in 3D software visualization, a structured approach including a theoretical model to control influence factors during con-trolled experiments in software visualization, an Eclipse-based generator for producing au-tomatically role- and task-specific 2D, 2.5D, and 3D software visualizations, the controlled experiment investigating the role of the third dimension in software visualization, and the recursive disk metaphor combining the findings with focus on the structure of software in-cluding useful applications of the third dimension regarding behavior and evolution.
I am writing these last lines with pleasure. A long way with ups and downs lies behind me. At this point I would like to take the opportunity to say thank you to all the people who have paved this way and who have accompanied me on this way.
First, I want to thank my parents Bettina and Bernd Müller as they have given me the chance to study and have made this possible in the first place. Moreover, I want to thank my brother Axel Müller who has been a constant role model and a valuable advisor. Another big thank you goes to Mikaela Mollenhauer. She has supported me in an extraordinary manner during the ups and downs.
I also wish to thank Ulrich Eisenecker for the outstanding supervision, the inspiring discus-sions, and the useful advices regarding science and life. I want to thank Bogdan Franczyk for acting as an assessor of this thesis and for his constructive feedback as well as An-dré Ludwig for his support. Furthermore, I want to thank Dirk Zeckzer for the excellent cooperation. Thanks are also due to my friends and colleagues Johannes Müller, Pascal Ko-vacs, Jan Schilbach, Christopher Klinkmüller, Ábel Sinkovics, Christoph Jobst, Max Lillack, Christoph Augenstein, Martin Roth, Stefan Mutke, Hendrik Kerkhoff, Robert Kunkel, and David Baum.
Finally, I would like to thank all the students who have contributed directly and indirectly to this thesis, namely Elton Qinami, Christian Mählig, André Naumann, Philipp Günther, Lino Janke, Dan Häberlein, Denise Zilch, Andreas Gessner, and Christian Stein.
and punch through the sphere."
Table of Contents
Table of Contents V
List of Figures VIII
List of Tables IX
List of Listings X
List of Abbreviations XI
1 Introduction 1
1.1 Motivation and Problem Statement . . . 1
1.2 Objective and Research Questions . . . 2
1.3 Research Methodology . . . 3 1.4 Contributions . . . 4 1.5 Outline . . . 4 2 Background 5 2.1 Software Visualization . . . 5 2.1.1 Definitions . . . 5
2.1.2 Supported Software Engineering Tasks . . . 8
2.1.3 Taxonomies . . . 8
2.1.4 Metamodels . . . 9
2.1.5 Visualization Pipeline . . . 9
2.2 Adapted Software Engineering Paradigms . . . 10
2.2.1 Generative Paradigm . . . 10
2.2.2 Model-Driven Paradigm . . . 12
2.3 Eclipse . . . 15
2.3.1 Java Development Tools . . . 16
2.3.2 Plug-in Development Environment . . . 16
2.3.4 Xtend 2 . . . 23 2.4 Extensible 3D . . . 24 2.4.1 X3D . . . 24 2.4.2 X3DOM . . . 30 2.5 Summary . . . 34 3 Literature Study 35 3.1 Past, Present, and Future of 3D Software Visualization - A Systematic Liter-ature Analysis . . . 35
3.2 Summary . . . 48
4 Generator for 2D, 2.5D, and 3D Software Visualizations 50 4.1 Generative Software Visualization: Automatic Generation of User-Specific Visualizations . . . 50
4.2 Summary . . . 56
5 Structured Approach 58 5.1 A Structured Approach for Conducting a Series of Controlled Experiments in Software Visualization . . . 58
5.2 Summary . . . 65
6 Controlled Experiment 68 6.1 How to Master Challenges in Experimental Evaluation of 2D versus 3D Soft-ware Visualizations . . . 68
6.2 Summary . . . 73
7 The Recursive Disk Metaphor 76 7.1 The Recursive Disk Metaphor - A Glyph-based Approach for Software Visua-lization . . . 76
7.2 Summary . . . 83
8 Conclusion and Future Work 85 8.1 Contributions . . . 85
8.2 Recommendations for 3D Software Visualizations . . . 87
8.3 Outlook . . . 87
8.3.1 Literature Study . . . 88
8.3.2 Generator . . . 88
8.3.4 Recursive Disk Metaphor . . . 89 8.3.5 Research Project . . . 89
Appendix XIII
A Famix . . . XIII B Recursive Disk Metaphor . . . XIX
Glossary XXI
Bibliography XXVII
Wissenschaftlicher Werdegang XXXVI
List of Figures
1.1 Software engineering processes with stakeholders and artifacts. . . 1
1.2 Research methodology. . . 3
2.1 Software visualization examples showing structural, behavioral, and evolu-tionary aspects. . . 7
2.2 Adapted visualization pipeline for generating software visualizations. . . 9
2.3 Elements of the generative domain model. . . 11
2.4 Mapping alternatives between problem and solution space. . . 12
2.5 Relations between domain, DSL, formal model, and metamodel. . . 13
2.6 Subset of Ecore. . . 14
2.7 Extension points and extensions in Eclipse. . . 16
2.8 Relations between plug-ins, fragments, and features. . . 17
2.9 Subset of the Famix metamodel. . . 23
2.10 Profiles of the X3D standard. . . 25
2.11 X3D architecture. . . 28
2.12 X3D example. . . 29
2.13 Moving from X3D to X3DOM. . . 30
2.14 X3DOM architecture. . . 31
2.15 X3DOM fallback model. . . 32
2.16 X3DOM example. . . 33
4.1 Generative software visualization domain model. . . 56
4.2 Architecture and dependencies of the generator in a component diagram. . 57
5.1 Domain specific adaption of Munzner’s extended model for software visua-lization. . . 65
7.1 The structure of Findbugs visualized with the recursive disk metaphor in a browser. . . 83
7.2 Behavior with the recursive disk metaphor. . . 84
8.1 Applications of the third dimension in software visualization. . . 87 8.2 The structure of Freemind visualized with the city metaphor in a browser. 88
List of Tables
2.1 Definitions for software visualization. . . 5
2.2 Taxonomies for software visualization. . . 8
2.3 Overview of profiles, components, and levels in X3D version 3.3. . . 26
2.4 Units of measurement in X3D. . . 27
5.1 Possible influence factors on the effectiveness of a software visualization. 66 6.1 Directed hypotheses operationalizing the research questions. . . 73
6.2 Instance of the theoretical model for comparing a 2D vs. an inherent 3D software visualization. . . 74
List of Listings
2.1 Xtext grammar of important terminal rules. . . 18
2.2 A subset of the Xtext grammar of Famix. . . 20
2.3 Language generator for Famix. . . 22
2.4 X3D example. . . 29
2.5 X3DOM example. . . 32 A.1 Language generator for Famix. . . XIII A.2 Xtext grammar of Famix. . . XIV B.1 Xtext grammar of the recursive disk metaphor for visualizing the structure
List of Abbreviations
AOPT
Avalon-Optimizer[10, 34, 57, 85]
API
Application Programming Interface[18, 22, 23]
AST
Abstract Syntax Tree[17–19]
BD Big Data[88] BI Business Intelligence[88] CAD Computer-aided Design[24] CASE
Computer-Aided Software Engineer-ing[8]
CMM
Common Meta-Model[9]
CSS
Cascading Style Sheet[33]
CVS
Concurrent Versions System[2, 6]
DMM
Dagstuhl Middle Model[9]
DOM
Document Object Model[14, 30, 31]
DSL
Domain Specific Language [10–12, 17, 18, 20, 34, 56, 85, 88,Glossary:DSL]
EBNF
Extended Backus-Naur Form[18]
EMF
Eclipse Modeling Framework[14, 19]
EMP
Eclipse Modeling Project[5, 16, 34, 57, 86]
GP
Generative Programming [10, 13, 34, Glos-sary:GP]
GPU
Graphics Processing Unit[34]
HTML
Hypertext Markup Language[30–34]
HTTP
Hypertext Transfer Protocol[34]
IDE
Integrated Development Environment
[2, 15, 16, 18, 23, 34, 86, 88]
ISO
International Organization for Stan-dardization[24]
JAR
JDT
Java Development Tools[5, 16, 17, 23, 34, 57, 86] LOC Lines of Code[2, 49, 87] M2M Model-to-Model Transformation[15, 24, 57,Glossary:M2M] M2P Model-to-Platform Transformation [15, 24, 57,Glossary:M2P] MDA Model-Driven Architecture[12] MDSD
Model-Driven Software Development
[10, 12, 13, 34,Glossary:MDSD]
MSE
File exchange format[9, 57]
MWE2
Modeling Workflow Engine 2 [18–21, 24, 57,Glossary:MWE2]
OMG
Object Management Group[12]
OSGi
Open Services Gateway initiative[17]
PDE
Plug-in Development Environment [5, 16, 34, 57, 86]
RCP
Rich Client Platform[16, 88]
SAI
Abstract Scene Access Interface [28, 30, 31]
SOA
Service-oriented Architecture[6]
SRC
Shape Resource Container[34]
SVN
Subversion[2, 6]
TMF
Textual Modeling Framework [5, 16, 34, 57, 86]
UA
User Agent[31]
URI
Uniform Resource Identifier[21, 31]
VRML
Virtual Reality Modeling Language[24, 25, 27]
WebGL
Web Graphics Library[31]
X3D
Extensible 3D[5, 10, 12, 24, 25, 27, 28, 30–34, 57, 85, 89,Glossary:X3D]
X3DOM
Extensible 3D Document Object Model[5, 10, 12, 24, 30–34, 57, 85, 88, 89,Glossary:
X3DOM]
XHTML
Extensible Hypertext Markup Lan-guage[30, 31, 33, 34]
XML
Extensible Markup Language [13, 24, 27, 28, 30]
XSD
1 Introduction
This chapter motivates the topic of the thesis and formulates the corresponding problem statement. Further, it describes the research design including objective, research questions, and the applied research methods. The introductory chapter closes with a summary of the main contributions and an outline of the thesis.
1.1 Motivation and Problem Statement
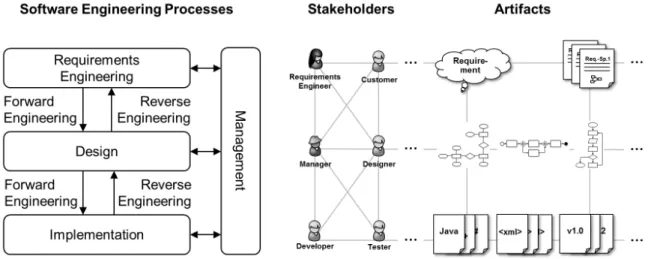
Typical software engineering processes are forward and reverse engineering [Chikofsky and Cross 1990] usually controlled by a cross-cutting management process [Frailey et al. 2004]. Forward engineering covers the classical software development process from requirements engineering to the design and the implementation of the software system. On the contrary, reverse engineering aims at analyzing an implemented software system to gain an under-standing of its design, and if necessary, of its requirements. This supports the system’s main-tenance, enhancement, replacement, or reuse. Reverse engineering plays an important role in software engineering because of the rapid development of technology [Garcia et al. 2004]. Software engineering management covers planning, coordinating, measuring, monitoring, controlling, and reporting of these processes. As depicted in Figure 1.1, these software en-gineering processes comprise several phases1and involve stakeholders that use and produce
artifacts. Today and in the future, one major challenge is the increasing complexity due to an increase of number, types, and relations of stakeholders on the one hand and of artifacts on the other hand.
Figure 1.1:Software engineering processes with stakeholders and artifacts.
Software visualization provides means to deal with this complexity and to support all three major software engineering processes [Bohnet and Döllner 2005]. According to Diehl [2007], software visualization is"[...] the visualization of artifacts related to software and its devel-opment process.". The major objective is to provide role- and task-specific views of these artifacts for stakeholders. The visualized aspects of a software system may be structural, behavioral, and evolutionary. While source code, data structures, or static call-graphs are sources of information regarding the structure of a software system, execution traces pro-vide behavioral information about it. Additionally, information regarding the evolution can be obtained from version control systems, such as Concurrent Versions System (CVS), Sub-version (SVN), or Git. For example, a developer can use a structural view of the system to detect design flaws during software quality assessment, a tester is provided with a behavioral view to detect bottlenecks during execution, and a manager is supported in planning and de-cision making by an aggregated evolutionary view. In general, software visualization tools support stakeholders in software comprehension, finding errors, improving the quality of the software, and managing complexity [Bassil and Keller 2001]. The necessity of software visualization is further confirmed by a survey conducted by Koschke [2003]. The results in-dicate that 82% of the participants see software visualization as important and absolutely necessary in software engineering. There are many useful 2D, 2.5D, and 3D software visu-alizations. Some comprehensive overviews are provided by Graˇcanin et al. [2005], Teyseyre and Campo [2009], and Caserta and Zendra [2011].
The focus of this thesis is on the implementation phase, especially on the combined visuali-zation of artifacts containing information about the structure, behavior, and evolution of soft-ware systems. A useful application of the third dimension may be the possibility to provide multiple views with one software visualization for all three aspects, i.e., structure, behavior, and evolution. However, empirical findings concerning the role of the third dimension in software visualization are rare [Müller et al. 2014a, b; Müller and Zeckzer 2015a]. Further-more, there are only few 3D software visualizations that provide multiple views of a software system including all three aspects [Müller and Zeckzer 2015a]. Finally, there is no general approach to automatically generate 2D, 2.5D, and 3D software visualizations that scale for large software systems (> 500K Lines of Code (LOC)), that are easy to integrate into an In-tegrated Development Environment (IDE), and that are platform independent [Müller et al. 2011].
1.2 Objective and Research Questions
Consequently, the main objective of this thesis is to develop a software visualization that represents all important structural entities and relations of a software system, that can display behavioral and evolutionary aspects of a software system as well, and that can be generated automatically.
The resulting research question is based on this objective and detailed by three sub-questions.
RQ:How should a software visualization be designed to visualize structural, behavioral, and evolutionary aspects of a software system, and how can it be generated automatically?
• SQ1:What is the state-of-the-art in 3D software visualization?
• SQ2:How can 2D, 2.5D, and 3D software visualizations be generated automatically? • SQ3: What role does the factor dimensionality play in solving software engineering
tasks?
1.3 Research Methodology
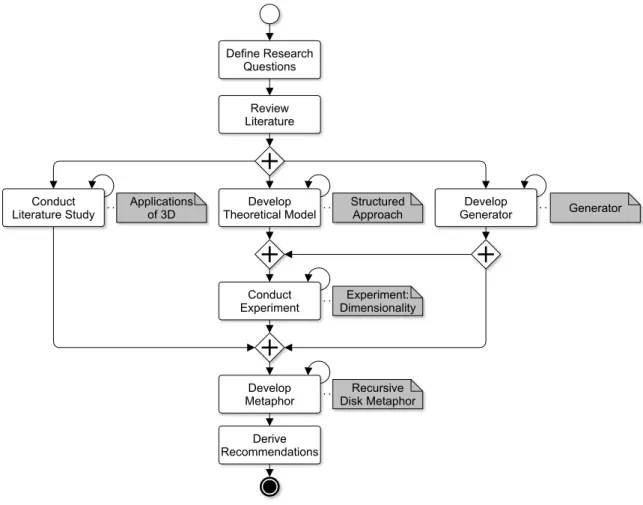
In order to answer the research questions, the research methodology shown in Figure 1.2 is chosen.
Figure 1.2:Research methodology.
First, the relevant literature is reviewed. This step lays the foundations providing the theoret-ical and the techntheoret-ical background. The four main research methods applied in this thesis are the literature study combining a systematic mapping study [Petersen et al. 2008] and a sys-tematic literature review [vom Brocke et al. 2009], the development of a prototype [Wilde and Hess 2007], the development of a structured approach, and the controlled experiment [Sjøberg et al. 2007]. The literature study is conducted to examine the state-of-the-art in
3D software visualization (SQ1). The prototypical conception and implementation of the software visualization generator (SQ2) and the structured approach are two preconditions for the controlled experiment. The generator produces 2D, 2.5D, and 3D software visual-izations. The approach helps to plan and to design controlled experiments and to control the influence factors. The experiment is designed and performed to empirically investigate the role of the third dimension in solving software engineering tasks (SQ3). The findings of the previous steps are combined and form the input for the development of the recursive disk metaphor (RQ). All major steps have an iterative character, as they are repeated dur-ing the whole research process. Finally, recommendations for 3D software visualizations are derived.
1.4 Contributions
Altogether, there are five main contributions which have all been published separately as peer-reviewed conference and workshop articles.
1. Literature study presenting an overview of state-of-the-art in 3D software visualization [Müller and Zeckzer 2015a].
2. Eclipse-based generator for generating 2D, 2.5D, and 3D software visualizations au-tomatically [Müller et al. 2011].
3. Structured approach for conducting controlled experiments in software visualization [Müller et al. 2014a].
4. Controlled experiment investigating the role of the third dimension in software visua-lization [Müller et al. 2014b].
5. Recursive disk metaphor combining the findings with focus on the structure of soft-ware with useful applications of the third dimension [Müller and Zeckzer 2015b].
1.5 Outline
The structure of the thesis is based on the research process. In Chapter 2 the theoretical and technical foundations are explained. The literature study giving an overview of the state-of-the-art in 3D software visualization is described in Chapter 3. The generator to create 2D, 2.5D, and 3D software visualizations automatically as well as the structured approach for conducting controlled experiments in software visualization are presented in Chapters 4 and 5. The actual experiment investigating the role of the third dimension in solv-ing software engineersolv-ing tasks is subject of Chapter 6. The recursive disk metaphor brsolv-ings all findings of the previous chapters together and is introduced in Chapter 7. Finally, the contri-butions are summarized, the recommendations for 3D software visualization are concluded, and an outlook to future work is provided in Chapter 8.
2 Background
This chapter explains the theoretical foundations of software visualization and of relevant software engineering paradigms. Further, it introduces the important technical concepts based on Eclipse, such as Java Development Tools (JDT), Plug-in Development Environment (PDE), Eclipse Modeling Project (EMP), and Textual Modeling Framework (TMF) with Xtext, and Xtend as well as Extensible 3D (X3D) and Extensible 3D Document Object Model (X3DOM) to create and render 3D scenes.
2.1 Software Visualization
Software visualization is a branch of information visualization as it offers techniques and methods to visualize abstract data [Diehl 2007, p. 3]. In addition, it has an interdisciplinary character that is affected by software engineering, human computer interaction, graphics, and cognitive psychology [Marcus et al. 2005]. There are two main fields of application for soft-ware visualization: educational visualization and softsoft-ware engineering [Hundhausen 1996]. The scope of this thesis is placed on 3D software visualization for software engineering. In the following, the working definition for software visualization is chosen and explained, the supported software engineering tasks are introduced, important taxonomies are presented, and the visualization process is described in detail.
2.1.1 Definitions
The field of software visualization has continually developed since its beginnings in the late 1980’s. Table 2.1 summarizes the most influencing definitions.
Table 2.1:Definitions for software visualization.
Authors Definition
Myers [1990] "Program visualisation uses graphics to illustrate some aspect of the
program or it’s run-time execution, where the program is specified in a conventional, textual manner."
Price et al. [1993] "Software visualisation is the use of the crafts of typography, graphic
design, animation and cinematography with modern human- com-puter interaction technology to facilitate both the human understand-ing and effective use of computer software."
Roman and Cox [1993] "Program visualisation is a mapping, or transformation, of a program
to a graphical representation."
Table 2.1– continued from previous page
Authors Definition
Knight and Munro [1999] "Software visualisation is a discipline that makes use of various forms of imagery to provide insight and understanding and to reduce com-plexity of the existing software system under consideration."
Reiss [2005] "[...] the development and evaluation of methods for graphically
rep-resenting different aspects of software, including its structure, its ab-stract and concrete execution, and its evolution."
Diehl [2007, p. 3f] "[...] the visualization of artifacts related to software and its
develop-ment process. [...] visualizing the structure, behavior, and evolution of software."
Diehl [2007, p. 3f] provides the most recent definition of software visualization, including all necessary aspects, i.e., structure, behavior, and evolution. For these reasons, this definition is used throughout the thesis.
• Structure includes program code, data structures, static call-graphs, relations, and the organization of a software system.
• Behaviorcovers the execution of a software system with real and abstract data.
• Evolutionrefers to the development process of a software system. This information is
usually provided by version control systems, such as CVS, SVN, or Git.
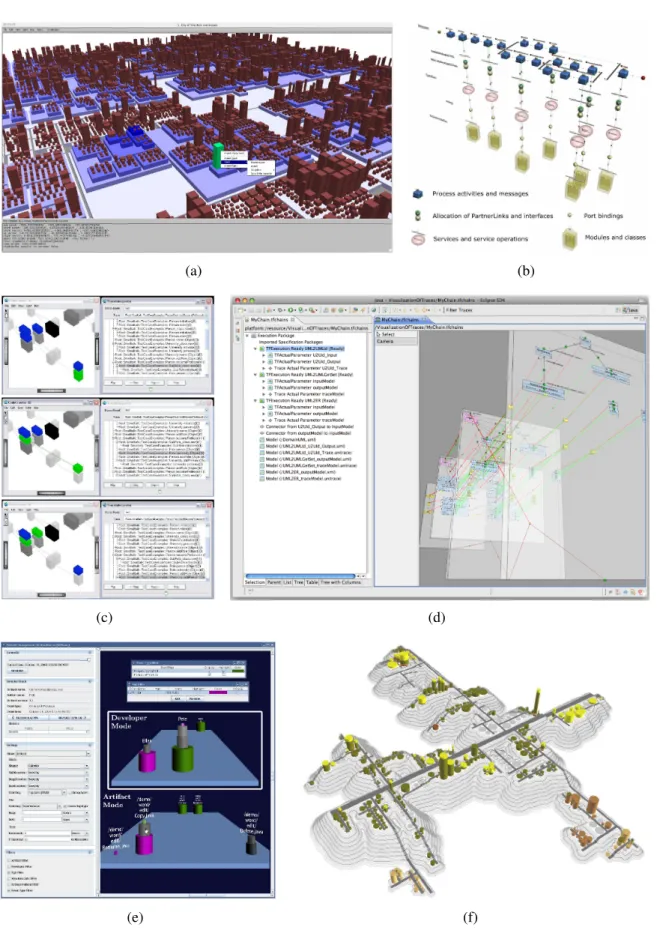
Figure 2.1 shows examples of software visualizations including structural (a-b), behavioral (c-d), and evolutionary (e-f) aspects. Wettel and Lanza [2007] visualize the structure of soft-ware systems with a city metaphor (a). Here, packages are mapped to districts and classes are mapped to buildings. The base area of the buildings is proportional to the number of attributes and their height is proportional to the number of methods of a class. Eicker et al. [2007] provide structural views of Service-oriented Architectures (SOAs) divided into busi-ness process layer, service interface layer, and application layer (b). Greevy [2007] visualizes execution traces in terms of object creations and interactions in the context of a static class hierarchy (c). Von Pilgrim and Duske [2008] represent execution traces with stacked views (d). Ripley et al. [2007] offer means to visualize and explore workspace activity as well as evolution on a project-wide basis. The workspaces are mapped to a stack of cylinders where each cylinder corresponds to an artifact. Stacks of cylinders with recent changes are placed in front of the view. Stacks with less activity move into the background (e). Steinbrückner and Lewerentz [2010] use the city metaphor to visualize the evolution of software systems. Their approach maps the development history to elevation levels. The levels correspond to the number of versions of an artifact. Thus, the higher an artifact is placed, the higher version it has. Besides system evolution, the approach includes modification history and authorship history (f).
(a) (b)
(c) (d)
(e) (f)
Figure 2.1:Software visualization examples showing structural, behavioral, and evolutionary aspects: structure with (a) CodeCity [Wettel and Lanza 2007] and (b) SOA views [Eicker et al. 2007], behavior with (c) CodeCrawler [Greevy et al. 2005] and (d) GEF3D [von Pilgrim and Duske 2008], evolution with (e) Palantír [Ripley et al. 2007] and (f) Evo-Streets [Steinbrückner and Lewerentz 2010].
2.1.2 Supported Software Engineering Tasks
Software visualization enhances comprehension of software systems in constructive and an-alytical tasks in software engineering. Actually, it supports three major software engineering processes with their corresponding tasks [Bohnet and Döllner 2005, p. 4]:
• forward engineering, i.e., design and implementation of new software systems,
• reverse engineering, i.e., maintenance, enhancement, and reuse of existing software
systems, and
• management, i.e., planning, coordinating, measuring, monitoring, controlling, and
re-porting the software engineering process.
In general, software visualization tools support stakeholders in software comprehension, finding errors, improving the quality of the software, and managing complexity [Bassil and Keller 2001]. The forward engineering process covers the classical software development process from requirements engineering to the design and the implementation of the soft-ware system. This process is usually supported by Computer-Aided Softsoft-ware Engineering (CASE) tools. These tools provide structural views, as well as behavioral views of the soft-ware system under development. The reverse engineering process aims at gaining sufficient design-level understanding about an existing software system to help with its maintenance, enhancement, replacement, and reuse [Chikofsky and Cross 1990]. Structural, behavioral, and evolutionary views of the initially unknown system help to solve these tasks time- and cost-efficiently. Reverse engineering plays an important role in software engineering due to the rapid development in technology [Garcia et al. 2004]. For this reason, software visualiza-tion in the context of reverse engineering is an important use case. The management process covers the planning, coordinating, measuring, monitoring, controlling, and reporting of the software engineering process [Frailey et al. 2004]. In this context the main source for visua-lization are evolutionary aspects of software systems, such as system evolution, modification history, and authorship history. The aggregation and visualization of this information may support the management in planning and decision making.
2.1.3 Taxonomies
Taxonomies are a mean to structure a discipline in order to communicate on a common basis among researchers and to identify research gaps. Table 2.2 builds partly upon Hundhausen et al. [2002, p. 261] and summarizes the main taxonomies in the field of software visualiza-tion.
Table 2.2:Taxonomies for software visualization.
Taxonomy Dimensions
Myers [1990] Aspect (Code, Data, Algorithm)×Form (Static, Dynamic)
Table 2.2– continued from previous page
Taxonomy Dimensions
Stasko and Patterson [1993] Aspect×Abstractness×Animation×Automation
Roman and Cox [1993] Scope×Abstraction Level×Specification Method×Interface×
Presentation
Price et al. [1993] Scope×Content×Form×Method×Interaction×Effectiveness
Maletic et al. [2002] Task×Audience×Target×Representation×Medium
Storey et al. [2005] Intent×Information×Presentation×Interaction×Effectiveness
Gallagher et al. [2005] Static Representation×Dynamic Representation×Views×
Navi-gation and Interaction×Task Support×Implementation×
Visua-lization
These taxonomies play an important role in developing the theoretical model for conduct-ing controlled experiments because they reveal all important aspects that may influence the processing of a software engineering task supported by a software visualization.
2.1.4 Metamodels
According to Diehl [2007, p. 3f], the information of software systems to be visualized may be structural, behavioral, or evolutionary. For each of these aspects exists a metamodel. Structural information is covered by Famix [Ducasse et al. 2011], behavioral information is covered by Dynamix [Greevy 2007], and evolutionary information is covered by Hismo [Ducasse et al. 2004]. These metamodels are independent of the actual programming lan-guage, execution trace tool, or version control system. The serialization format of Famix, Dynamix, and Hismo is MSE (meaning unknown) [Kuhn and Verwaest 2008]. There are al-ternative metamodels, such as the Dagstuhl Middle Model (DMM) [Lethbridge et al. 2004] and the Common Meta-Model (CMM) [Strein et al. 2007]. However, none of these alterna-tive models covers all three aspects.
2.1.5 Visualization Pipeline
The main steps of a generalvisualization pipelineare extraction, analysis, filtering, mapping, and rendering [dos Santos and Brodlie 2004]. In this thesis, this general visualization process is adapted to software visualization and realized with a generator. The adapted visualization pipeline is depicted in Figure 2.2.
Figure 2.2:Adapted visualization pipeline for generating software visualizations based on dos Santos and Brodlie [2004].
The information needed for the visualization isextracted from software systems and stored in corresponding models, either conforming to Famix [Ducasse et al. 2011], to Dynamix [Greevy 2007], or to Hismo [Ducasse et al. 2004]. These metamodels are defined with Xtext that automatically generates the necessary language infrastructure, including parsers and val-idators, for each metamodel. Duringanalysis, these models are checked for syntactic and semantic validity. They must conform to their metamodel and fulfill some predefined vali-dation rules, e.g., each entity must have a unique identifier. In the next step, the userfilters the desired entities. This step may occur at build time of the visualization or at runtime. The
mappingis realized by model transformations and model modifications using Xtend. It is
divided into two parts. First, the valid and filtered entities from the input model are mapped to a platform independent model. Then, the layout of these entities is computed providing sizes and positions for the visualization. Second, the platform independent model is mapped to a platform specific one, here, X3D. Finally, the X3D model is optimized for the web and converted with the Avalon-Optimizer (AOPT) to X3DOM [Behr et al. 2012]. The resulting visualization is rendered by a browser. As the rendering may be done on every platform, X3D and X3DOM are platform independent.
2.2 Adapted Software Engineering Paradigms
The generator to be developed adapts and combines concepts and techniques of Generative Programming (GP) and of Model Driven Software Development (MDSD) from the field of software engineering. For this reason, both paradigms are described in the following.
2.2.1 Generative Paradigm
A comprehensive overview of GP is for example provided by Czarnecki and Eisenecker [2000] and by Czarnecki [2005]. Especially Czarnecki and Eisenecker [2000] is used as a primary source to explain the terminology and concepts of the generative paradigm.
Definition
"Generative Programming (GP) is a software engineering paradigm based on modeling soft-ware system families such that, given a particular requirements specification, a highly cus-tomized and optimized intermediate or end-product can be automatically manufactured on demand from elementary, reusable implementation components by means of configuration knowledge."[Czarnecki and Eisenecker 2000, p. 5]
According to this definition, the generative paradigm aims at the development of a set of software systems, a so called system family. Asystem familycovers a set of of systems that are similar enough in terms of architecture to be assembled by a common set of components [Czarnecki and Eisenecker 2000, p. 31]. The requirements of the product to be created are de-scribed with a Domain Specific Language (DSL). Adomainis a bounded field of knowledge
comprising professional knowledge on the one hand and technical knowledge on the other hand [Czarnecki and Eisenecker 2000, p. 34]. The professional knowledge includes concepts and terminologies understood by practitioners and the technical knowledge includes ways of how to build software systems. Further, a domain is always related to its stakeholders. ADSL is specialized, problem-oriented, and provides means to describe concrete members of a sys-tem family [Czarnecki and Eisenecker 2000, p. 137]. The resulting specification is handed over to a generator. The generator assembles the desired product by combining elementary and reusable components.Componentsare building blocks that are used to assemble differ-ent systems of a system family [Czarnecki and Eisenecker 2000, p. 9]. Ageneratoris a piece of software that produces a system automatically according to the specification [Czarnecki and Eisenecker 2000, p. 333ff]. There are four essential tasks of a generator. It
• completes the specification with default values,
• verifies the specification and reports warning and error messages, • performs optimizations, and
• generates artifacts.
The result of the generation process is a member of the system family and shares the common system family architecture, no matter if it is an intermediate or a final artifact.
Generative Domain Model
Thegenerative domain model plays an important role in the context of this paradigm, as it
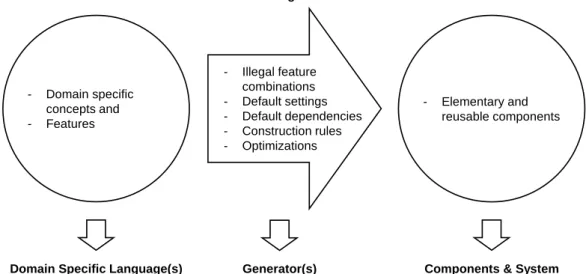
summarizes its important terms and their relations. It is shown in Figure 2.3.
- Illegal feature combinations - Default settings - Default dependencies - Construction rules - Optimizations - Elementary and reusable components - Domain specific concepts and - Features
Problem Space Configuration
Knowledge
Solution Space
Domain Specific Language(s) (DSLs)
Generator(s) Components & System Family Architecture
Figure 2.3:Elements of the generative domain model [Czarnecki and Eisenecker 2000, p. 132].
The generative domain model consists of the problem space, the solution space and the con-figuration knowledge [Czarnecki and Eisenecker 2000, p. 131f]. Theproblem spaceprovides
domain specific concepts and features to specify members of a system family by means of a DSL. Thesolution space covers the elementary and reusable implementation components and the common system family architecture. Theconfiguration knowledgemaps the elements of the problem space to the elements of the solution space and is usually implemented as a generator. The mapping process considers information about illegal feature combinations, default settings, default dependencies, construction rules, and optimizations.
As depicted in Figure 2.4, there are different ways of mappings between the problem and the solution space [Czarnecki 2005]. The generative domain model can be processed recur-sively, i.e., the solution space of one model is simultaneously the problem space of another generative domain model. This results in a chained mapping (a). Moreover, multiple problem spaces, either defined by a composed DSL (b) or by alternative DSLs (d), can be mapped to one solution space. Finally, one problem space can be mapped to complementary (c) or al-ternative (e) solution spaces. In practice, there may be more complex combinations of these elementary mapping patterns.
(a) (b) (c) (d) (e)
Figure 2.4:Mapping alternatives between problem and solution space [Czarnecki 2005]: (a) chained mapping, (b) multiple problem spaces, (c) multiple solution spaces, (d) alternative problem spaces, (e) alternative solution spaces.
Technology Projection
The elements of the generative domain model may be implemented with different techniques. The mapping of these elements to a paradigm, a programming language, or a platform is calledtechnology projection [Czarnecki 2005]. An overview of several technology projec-tions is provided by Czarnecki [2005]. In this thesis, Eclipse, especially Xtext and Xtend, as well as X3D and X3DOM are chosen as technology projections.
2.2.2 Model-Driven Paradigm
A comprehensive overview of MDSD is provided by for example Stahl et al. [2006, 2007]. MDSD can be seen as the practical realization, driven by the developer community, of the Model-Driven Architecture (MDA) standard [Miller and Mukerji 2003] initiated by the Ob-ject Management Group (OMG). Völter et al. [2013] have developed MDSD further and have brought the generative and model-driven paradigms closer together. Thus, both sources [Stahl et al. 2006, 2007; Völter et al. 2013] are combined to explain the terminology and concepts of the model-driven paradigm.
Definition
"MDSD is a generic term for techniques, that create runnable software from formal models automatically."2 [translated into English from Stahl et al. 2007, p. 11]
According to this definition, in the model-driven paradigm models become central artifacts of software development, as they are at least as important as source code. Models are specified in a way allowing the automatic generation of parts of a software system or a complete software system by means of transformations.
Metamodels and Models
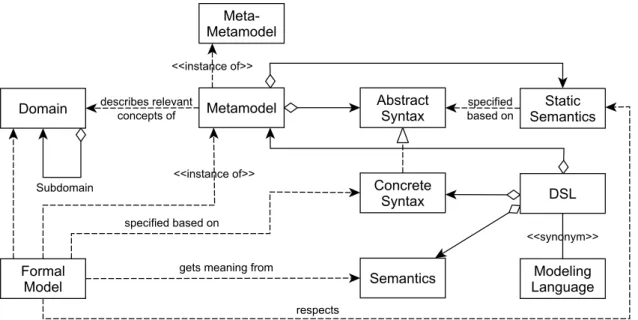
Similar to GP, in the context of MDSD, the domain plays an important role. In order to pro-vide the basis for automation, the domain’s structure has to be formalized. This formalization is realized by the metamodel. The relations between all relevant terms of the model-driven paradigm are outlined in Figure 2.5.
Figure 2.5:Relations between domain, DSL, formal model, and metamodel [Stahl et al. 2006, p. 56].
Themetamodeldefines the abstract syntax and the static semantics of a language [Stahl et al. 2006, p. 55ff]. In other words, it describes concepts that can be used for creating the formal model. The abstract syntax of a language specifies the language’s structure, typically as a tree or a graph. The realization of an abstract syntax is theconcrete syntax that is accepted by a parser and used as notation to specify formal models. It may be textual, graphical, tabu-lar, or a combination of these [Völter et al. 2013, p. 27]. For example, in Extensible Markup Language (XML) the XML document is formulated in the concrete syntax of XML. A parser
2 "Modellgetriebene Softwareentwicklung (Model Driven Software Development, MDSD) ist ein Oberbe-griff für Techniken, die aus formalen Modellen automatisiert lauffähige Software erzeugen." [Stahl et al. 2007, p. 11]
instantiates a representation in memory, where the resulting Document Object Model (DOM) is the abstract syntax of XML. The syntax of a language is not sufficient to check semantic rules. For this reason, the criteria for well-formedness of a language are defined by itsstatic
semantics. These are a set of constraints and/or type system rules to which formal models
have to conform. Additionally, thedynamic semanticsgives a meaning to the metamodel’s constructs. Finally, aformal model is formulated in the concrete syntax and follows its se-mantic, i.e., it is an instance of the metamodel. Subsequently, the term model is used as a synonym for a formal model. In order to finish the theoretically infinite instance hierarchy of models and their metamodels, at a certain point the metamodel is defined in itself.
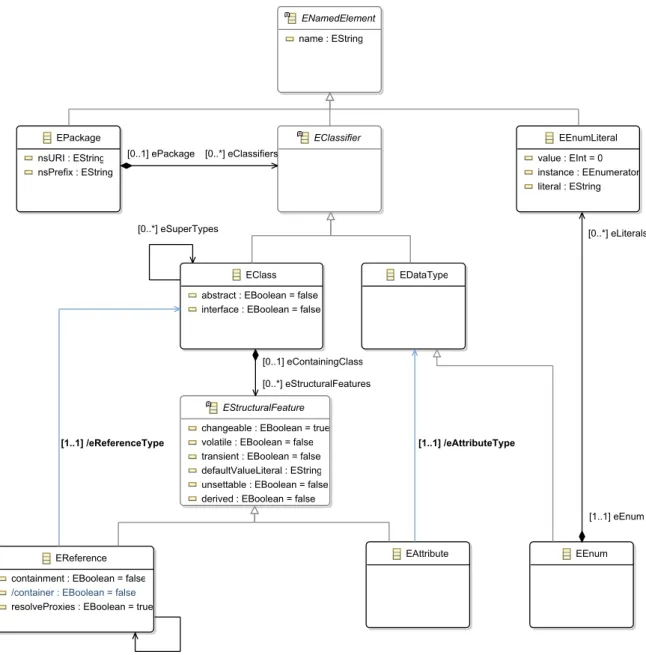
An important meta-metamodel in the Eclipse ecosystem, especially in the Eclipse Modeling Framework (EMF), is Ecore. It provides the language including syntax and semantics for defining custom metamodels for a domain. A subset of the important elements of Ecore and their relations are shown in Figure 2.6.
EAttribute EClass
abstract : EBoolean = false interface : EBoolean = false
EClassifier
EPackage nsURI : EString nsPrefix : EString
EReference containment : EBoolean = false
/container : EBoolean = false
resolveProxies : EBoolean = true
EStructuralFeature
changeable : EBoolean = true volatile : EBoolean = false transient : EBoolean = false defaultValueLiteral : EString unsettable : EBoolean = false derived : EBoolean = false
EDataType EEnumLiterall value : EInt = 0 instance : EEnumerator literal : EString ENamedElement name : EString EEnum [0..*] eSuperTypes [0..1] eOpposite [1..1] /eReferenceType [0..*] eClassifiers [0..1] ePackage [0..1] eContainingClass [0..*] eStructuralFeatures [1..1] /eAttributeType [0..*] eLiterals [1..1] eEnum
The classEPackagerepresents packages and may containEClasses. This relation is modeled
by the reference eClassifiers to the abstract class EClassifier. EClass defines classes
and holds references to other classes as well as attributes. These relations are modeled by the referenceeStructuralFeaturesto the abstract classEStructuralFeature. The references
between classes, represented byEReference, may be inheritance, composition, or
aggrega-tion.EAttributestands for attributes and has a reference to its type. Primitive and complex
datatypes are specified byEDataType. A special datatype is the enumeration represented by EEnumcontaining literals of typeEEnumLiteral.
Model Transformations
A platform supports the realization of a domain and can be founded on existing building
blocks, such as middleware, libraries, frameworks, or components [Stahl et al. 2006, p. 59]. Transformations are necessary to connect the domain concepts of the problem space with the platform in the solution space. Transformation rules are based on the metamodel’s con-structs. There are two types of model transformations: Model-to-Platform Transformation (M2P) and Model-to-Model Transformation (M2M) [Stahl et al. 2006, p. 60]. AM2P gen-erates artifacts that are based on the platform. This process is also called generation. An example is generated source code that fits into an existing framework. For this purpose, tem-plates describe how source code should be generated from model elements. AM2M maps one or more source models to a target model. There are three different categories: Model transformation, model modification, and model weaving [Stahl et al. 2007, p. 199f]. Amodel
transformationmaps a source model to a target model, where both models conform to a
dif-ferent metamodel. That means, there is a metamodel change and the source model remains unchanged. In contrary, amodel modificationchanges or extends source model elements, i.e., the target model is the modified source model and still conforms to the same metamodel. In some cases, information is distributed in different models and needs to be joined. Here, a
model weavingcombines at least two source models and creates one target model.
Tool Support
A suitable tool support is necessary to realize a model-driven approach. Czarnecki and Helsen [2006] provide a comprehensive overview of such tools. One of the tools mentioned in the survey is openArchitectureWare, the predecessor of Xtext and Xtend explained in the next section.
2.3 Eclipse
Eclipse is an open-source and generic IDE for a myriad of purposes. In other words:"The Eclipse Project provides a kind of universal tool platform - an open extensible IDE for any-thing and yet noany-thing in particular."[Eclipse Website 2014]. Eclipse can be used as an IDE for a certain programming language, as an IDE framework combining different programming
languages, as a tool framework, as an application framework, and as a runtime environment. The reason of this variety lies in the IDE’s plug-in architecture. The main task of the small Eclipse core is to load plug-ins at runtime. These plug-ins provide the actual functionalities of Eclipse. The Eclipse Project addresses two areas. On the one hand, there is the develop-ment of tool integration platforms including core frameworks and technologies that are used as a base to build software development tools of all kinds. On the other hand, there are tools required to build and to extend these platforms. These tools are used to build the integration platforms, to extend, and to adopt the platforms.
For the generator, the following Eclipse projects are important: JDT and PDE as parts of the Eclipse Project, as well as Xtext and Xtend as parts of the TMF respectively the EMP. At the moment, the generator is implemented with version 4.3 (Kepler) of Eclipse and version 2.6 of Xtext and Xtend.
2.3.1 Java Development Tools
The JDT project provides tools to develop, test, debug, build, and deploy Java applications, including Eclipse plug-ins [JDT Project Website 2014]. The Java IDE adds a Java project nature and a Java perspective to the Eclipse workbench enhanced by corresponding views, editors, wizards, builders as well as code merging and refactoring tools.
2.3.2 Plug-in Development Environment
The PDE project provides tools to develop, test, debug, build and deploy Eclipse plug-ins, fragments, features, update sites and Rich Client Platform (RCP) products [PDE Project Website 2014]. The PDE also adds perspectives, views, editors, wizards, and builders to the Eclipse workbench. Further, it is highly integrated with the JDT. The modular and extensible plug-in architecture of the generator is realized with three concepts that are described next, namely plug-ins, fragments, and features.
Plug-in
A plug-in is the smallest functional unit in Eclipse [Eclipse Documentation 2014]. It can
be an extension and it can offer extension points as placeholders for other plug-ins. The extension concept is explained in Figure 2.7.
Extension Point P Interface I Extension Point P Interface I Extension Point P Interface I Extension Class C Plug-in A Plug-in B contributes implements creates, calls
Plug-in A defines the extension point P and its interface I. Plug-in B contributes an extension to plug-in A as it implements this interface in class C. At runtime, plug-in A instantiates this class by calling the methods of the interface.
Every plug-in consists at least of a manifest (META-INF/MANIFEST.MF). The manifest
con-tains all necessary information about its execution including name, version, and dependen-cies to other plug-ins. The runtime management of a plug-in is controlled by an implemen-tation of the Open Services Gateway initiative (OSGi) framework. The extended manifest (plugin.xml) specifies the extensions of the in and the extension points for other
plug-ins. Further optional parts of a plug-in are the Java byte-code, usually shipped as a Java Archive (JAR) file, as well as resources, such as icons, help pages, or internationalized strings.
Fragment
Afragment is always part of a plug-in [Eclipse Documentation 2014]. It extends a plug-in
non-invasively with further contents or functionality. For example, language packages are often implemented as fragments and added after the development of the plug-in has been finished. Its manifest (fragment.xml) controls the coupling of the fragment and the plug-in.
Apart from this, the structure of a fragment is similar to plug-ins.
Feature
Afeaturecombines related plug-ins and their fragments to a product [Eclipse Documentation
2014]. For example, the JDT is a feature consisting of plug-ins, such as a Java source code editor, a debugger, and a console. The relations between plug-ins, fragments, and features are illustrated in Figure 2.8. Here, feature x bundles the plug-ins A, B, C and fragment 1. Feature y introduces fragment 2 that extends plug-in C.
Feature x
Feature y
Plug-in A Plug-in B Plug-in C
Fragment 2 Fragment 1
Figure 2.8:Relations between plug-ins, fragments, and features [Daum 2008, p. 499].
2.3.3 Xtext
Xtext is a language development framework for programming languages and DSLs [Xtext
Documentation 2014]. It covers all aspects of a complete language infrastructure by provid-ing runtime components, such as a parser, a type-safe Abstract Syntax Tree (AST), a serial-izer, a code formatter, a linker, compiler checks, a factory, a validation component for static analysis, and a code generator. Moreover, Xtext is completely integrated into the Eclipse
IDE. It uses the dependency injection framework Google Guice to wire up the whole lan-guage as well as the IDE infrastructure. All subsequent statements refer to version 2.7.2 of Xtext.
In the context of the generator, Xtext’s grammar language is used to define the metamod-els, i.e., Famix, Dynamix, and Hismo. The desired components are described in a Model-ing Workflow Engine 2 (MWE2) configuration that is the input for the language generator. The language generator creates important components for the visualization process such as parsers, validators, and the Application Programming Interfaces (APIs).
The Grammar Language
The grammar language is a DSL for the description of textual languages [Xtext Documen-tation 2014]. It is used to describe the concrete syntax and how the syntax is mapped to an in-memory representation—the AST. The AST will be created by the parser when it reads an input file written in this language. Every Xtext grammar starts with a header that defines some properties of the language. Additional grammars can be included with the keyword
with. This mechanism is calledgrammar mixin. An existing Ecore model can be referenced
with the keywordimportand aliased to avoid name collisions with the keywordasfollowed
by a name.
There are four different types of rules available to define the grammar: terminal rules, parser rules, data type rules, and enum rules. Aterminal ruleis described using Extended Backus-Naur Form (EBNF)-like expressions. Return types are atomic values of type EDataType.
Examples for terminal rules are in Listing 2.1 in lines 4 to 18. A hidden terminal symbol defines a sequence of patterns that are ignored by the parser, such as white space, and com-ments. Nevertheless, they are woven into the model but do not play any role for the semantic model. They are shipped as default inTerminals.xtext.
1 grammar org.eclipse.xtext.common.Terminals hidden(WS, ML_COMMENT, SL_COMMENT) 2 import "http://www.eclipse.org/emf/2002/Ecore"as ecore
3
4 terminal ID:
5 ’^’?(’a’..’z’|’A’..’Z’|’_’) (’a’..’z’|’A’..’Z’|’_’|’0’..’9’)*; 6 terminal INT returns ecore::EInt:
7 (’0’..’9’)+; 8 terminal STRING : 9 ’"’ ( ’\\’. /* ’b’|’t’|’n’|’f’|’r’|’u’|’"’|"’"|’\\’ */ | !(’\\’|’"’) )*’"’ | 10 "’" ( ’\\’. /* ’b’|’t’|’n’|’f’|’r’|’u’|’"’|"’"|’\\’ */ | !(’\\’|"’") )*"’"; 11 terminal ML_COMMENT: 12 ’/*’ ->’*/’; 13 terminal SL_COMMENT: 14 ’//’ !(’\n’|’\r’)* (’\r’? ’\n’)?; 15 terminal WS: 16 (’ ’|’\t’|’\r’|’\n’)+; 17 terminal ANY_OTHER: 18 .;
Aparser rule uses terminal rules and other parser rules. The parser rules lead to the parse tree. This is the blueprint for the AST. In this context, actions and assignments are used to derive types and initialize the elements of the AST. If not explicitly specified the return type of a parser rule is the rule’s name. Assignments(=, +=,?=) are used to bind the consumed information to a feature of the currently produced object. The type of this object is spec-ified by the return type of the parser rule. It is possible to declare cross-references in the grammar. This information is used by the linker.Actionsmake the creation of a return type explicit. There are simple actions and assigned actions. Adata type rulecreates instances of
EDataTypeinstead ofEClass. They are similar to terminal rules but they are context sensitive
and allow the use of hidden tokens. Anenum rulereturns enumeration literals from strings. It is a kind of data type rule with a specific value converter and creates an instance ofEEnum.
Xtext infers Ecore models from a grammar. Xtext parsers create an in-memory object graph that is an instance of Ecore models. Such a model consists of an EPackage containing EClasses with EAttributes and EReferences, EDataTypes and EEnums according to the
different parser rules. Xtext generates or infers an Ecore model from every grammar as fol-lows [Xtext Documentation 2014]:
• AnEPackagefor eachgeneratedeclaration,
• anEClassfor each return type of a parser rule and for each type defined in an action
or a cross-reference,
• anEEnumfor each return type of an enum rule,
• anEDataTypefor each return type of a terminal rule or a data type rule,
• anEAttributein each current return type, and
• anEReference in each current return type for each assignment and for each assigned
action.
MWE2
The MWE2 is a declarative, externally configurable generator engine [Xtext Documentation 2014]. It provides means to describe object compositions and to declare object instances, attribute values, and references. Its main purpose is the definition of workflows. Aworkflow summarizes components that interact with each other. Among others, there are components to read and write EMF models, or to transform them. However, it is also possible to write custom components and to integrate them into MWE2 workflows.
The Language Generator
The language generator takes an Xtext grammar as input and generates necessary compo-nents of the language infrastructure according to the MWE2 configuration [Xtext Documen-tation 2014]. This includes a parser, a serializer, an inferred Ecore model, and a couple of base classes for validation, formatting, and testing. The generator also contributes to shared project resources such as theplugin.xml,MANIFEST.MF, and the Google Guice modules.
Famix Example
As mentioned in Section 2.1, Famix is a metamodel describing structural aspects of software [Ducasse et al. 2011]. In the following example, this metamodel is defined by means of an Xtext grammar. Then, the language generator is used to generate the language infrastructure and necessary components. The whole process is configured with MWE2.
Listing 2.2 shows a subset of the Xtext grammar definition of Famix. In other words, this is a DSL for describing structural aspects of software systems. The complete grammar definition of Famix can be found in Listing A.2.
1 grammar org.svis.xtext.Famixwith org.eclipse.xtext.common.Terminals 2 import "http://www.eclipse.org/emf/2002/Ecore"as ecore
3 generate famix "http://www.svis.org/famix" 4 5 Root: 6 document=Document?; 7 8 Document: 9 {Document} 10 ’(’ elements+=FAMIXElement* ’)’; 11 12 FAMIXElement:
13 FAMIXNamespace | FAMIXClass | FAMIXAttribute | FAMIXMethod | FAMIXInheritance; 14 15 FAMIXNamespace: 16 ’(FAMIX.Namespace’ 17 ’(’ ’id: ’name=INT_ID ’)’ 18 ’(’ ’name’value=MSESTRING ’)’ 19 (’(’ ’isStub’ isStub=Boolean’)’)? 20 (’(’ ’parentScope’parentScope=IntegerReference ’)’)? 21 ’)’; 22 23 FAMIXClass: 24 ’(FAMIX.Class’ 25 ’(’ ’id: ’name=INT_ID ’)’ 26 ’(’ ’name’value=MSESTRING ’)’ 27 ’(’ ’container’ container=IntegerReference ’)’ 28 (’(’ ’isInterface’isInterface=Boolean ’)’)? 29 (’(’ ’isStub’ isStub=Boolean’)’)? 30 (’(’ ’modifiers’ modifiers+=MSESTRING* ’)’)? 31 (’(’ ’sourceAnchor’type=IntegerReference ’)’)? 32 ’)’; 33 34 FAMIXAttribute: 35 ’(FAMIX.Attribute’ 36 ’(’ ’id: ’name=INT_ID ’)’ 37 ’(’ ’name’value=MSESTRING ’)’ 38 ’(’ ’declaredType’declaredType=IntegerReference ’)’ 39 (’(’ ’hasClassScope’ hasClassScope=Boolean ’)’)? 40 (’(’ ’isStub’ isStub=Boolean’)’)? 41 (’(’ ’modifiers’ modifiers+=MSESTRING* ’)’)? 42 ’(’ ’parentType’ parentType=IntegerReference ’)’ 43 (’(’ ’sourceAnchor’sourceAnchor=IntegerReference ’)’)? 44 ’)’; 45 46 FAMIXMethod:
47 ’(FAMIX.Method’ 48 ’(’ ’id: ’name=INT_ID ’)’ 49 ’(’ ’name’value=MSESTRING ’)’ 50 (’(’ ’cyclomaticComplexity’cyclomaticComplexity=INT ’)’)? 51 (’(’ ’declaredType’declaredType=IntegerReference ’)’)? 52 (’(’ ’hasClassScope’ hasClassScope=Boolean ’)’)? 53 (’(’ ’isStub’ isStub=Boolean’)’)? 54 (’(’ ’kind’kind=MSESTRING ’)’)? 55 (’(’ ’modifiers’ modifiers+=MSESTRING* ’)’)? 56 (’(’ ’numberOfStatements’ numberOfStatements=INT’)’)? 57 ’(’ ’parentType’ parentType=IntegerReference ’)’ 58 ’(’ ’signature’ signature=MSESTRING ’)’ 59 (’(’ ’sourceAnchor’sourceAnchor=IntegerReference ’)’)? 60 ’)’; 61 62 FAMIXInheritance: 63 ’(FAMIX.Inheritance’ 64 ’(’ ’id: ’name=INT_ID ’)’ 65 (’(’ ’previous’previous=IntegerReference ’)’)? 66 ’(’ ’subclass’subclass=IntegerReference ’)’ 67 ’(’ ’superclass’ superclass=IntegerReference ’)’ 68 ’)’; 69 70 IntegerReference: 71 ’(’ ’ref: ’ ref=[FAMIXElement|INT_ID] ’)’;
Listing 2.2:A subset of the Xtext grammar of Famix.
In Line 1, the name of the language is declared. This declaration requires that the grammar file is namedFamix.xtext and placed in the packageorg.svis.xtext. The keywordwith
references an existing language, Terminals.xtext, that is also required for this language.
This grammar mixin provides definitions forINT,ID, andSTRING. Further, Ecore isimported
in Line 2 and used for primitive type definitions. Thegeneratestatement in line 3 creates
an EPackage named famix with the namespace Uniform Resource Identifier (URI) http: //www.svis.org/xtext/famix. This empty EPackage will be extended by EClasses with EAttributesandEReferencesdefined by the subsequent parser rules. In this listing, there
are nine parser rules in lines 5 to 71.
According to this grammar or metamodel, every Famix model starts with a Root element
containing one or noneDocument. TheDocumentholds a list ofFAMIXElements. Each FAMIX-Elementhas a name.FAMIXElementsmay be of typeFAMIXNamespacefor packages, FAMIX-Class for classes, FAMIXAttribute for attributes, FAMIXMethod for methods, and FAMIX-Inheritance for inheritance relations. All relations between these elements are modeled
using the element IntegerReference. For example, parent packages are resolved by the
referencesparentScopeandref.
This grammar is then handed over to the language generator with a MWE2 configuration presented in extracts in Listing 2.3. The complete MWE2 configuration can be found in Listing A.1.
1 module org.svis.xtext.GenerateFamix 2 3 import org.eclipse.emf.mwe.utils.* 4 import org.eclipse.xtext.generator.* 5 import org.eclipse.xtext.ui.generator.* 6
7 var grammarURI ="classpath:/org/svis/xtext/Famix.xtext" 8 var fileExtensions="famix"
9 var projectName ="org.svis.xtext.famix" 10 var runtimeProject ="../${projectName}" 11 var generateXtendStub = true
12 13 Workflow { 14 bean= StandaloneSetup { 15 scanClassPath = true 16 platformUri = "${runtimeProject}/.." 17 } 18 component= DirectoryCleaner { 19 directory ="${runtimeProject}/src-gen" 20 } 21 //[...] 22 component= Generator { 23 pathRtProject = runtimeProject 24 pathUiProject ="${runtimeProject}.ui" 25 pathTestProject = "${runtimeProject}.tests" 26 projectNameRt = projectName 27 projectNameUi ="${projectName}.ui" 28 language = auto-inject { 29 uri = grammarURI
30 // Java API to access grammar elements (required by several other fragments) 31 fragment = grammarAccess.GrammarAccessFragment auto-inject {}
32 // generates Java API for the generated EPackages 33 fragment = ecore.EMFGeneratorFragment auto-inject {} 34 // serializer 2.0
35 fragment = serializer.SerializerFragment auto-inject {
36 generateStub = false
37 }
38 // The antlr parser generator fragment.
39 fragment = parser.antlr.XtextAntlrGeneratorFragment auto-inject {} 40 // Xtend-based API for validation
41 fragment = validation.ValidatorFragment auto-inject {}
42 // [...]
43 }
44 }
45 }
Listing 2.3:Language generator for Famix.
The keyword modulein Line 1 declares the fully qualified name for the language
genera-tor’s classGenerateFamix. Lines 3 to 5importrequired Java classes. Lines 7 to 11 declare
attribute values with the keyword var. The main workflow is defined in lines 13 to 45. It
consists of a bean to initialize the workflow (lines 14–17), directory cleaning components (lines 18–21), and a generator component (lines 22–44). The generator component includes some properties and predefined fragments, e.g. for the Famix API (Line 31), model inference (Line 33), serialization (lines 35–37), parsing (Line 39), and validation (Line 41).
After processing this grammar by the language generator from Listing 2.3, one of the out-puts is the inferred Ecore model, respectively the class diagram of the Famix metamodel in Figure 2.9. The result of this process is a complete language infrastructure for Famix models including an API and components to parse, serialize, and validate these models.
Document FAMIXAttribute value : EString hasClassScope : EString isStub : EString modifiers : EString FAMIXClass value : EString isInterface : EString isStub : EString modifiers : EString FAMIXElementt name : EString FAMIXInheritance FAMIXMethod value : EString cyclomaticComplexity : EInt = 0 hasClassScope : EString isStub : EString kind : EString modifiers : EString numberOfStatements : EInt = 0 signature : EString FAMIXNamespace value : EString isStub : EString IntegerReference Root [0..*] elements [0..1] declaredType [0..1] parentType [0..1] sourceAnchor [0..1] container [0..1] type [0..1] previous [0..1] subclass [0..1] superclass [0..1] declaredType [0..1] parentType [0..1] sourceAnchor [0..1] parentScope [0..1] ref [0..1] document
Figure 2.9:Subset of the Famix metamodel.
2.3.4 Xtend 2
Xtend is a statically-typed programming language that translates to comprehensible Java
source code [Xtend Documentation 2014]. It is closely integrated with the Eclipse JDT pro-viding IDE features like call-hierarchies, refactoring, and debugging. Concerning syntax and semantics Xtend is quite similar to Java. However, there are some improvements over Java, such as: • extension methods, • lambda expressions, • active annotations, • operator overloading, • switch expressions,
• multiple dispatch, i.e., polymorphic method invocation, • template expressions with intelligent white space handling,
• no statements as everything is an expression,
• properties for accessing and defining getters and setter, • type inference,
• full support for Java generics, and • it translates to Java.
In the context of the generator, Xtend’s extension methods and the template expressions are used to describe M2Ms and M2Ps. Models conforming to an Xtext grammar are read by a generated parser component and modified or transformed by Xtend components. In the case of a M2M the models are written by a generated serializer component. In the case of a M2P the models are written directly according to a template definition. Similar to Xtext, the complete workflow is configured with MWE2.
2.4 Extensible 3D
X3D and X3DOM are two complementary approaches to create and render 2D and 3D scenes. X3DOM is build upon the X3D standard with the objective to render these scenes in a web browser without requiring additional plug-ins. In the following, both approaches are introduced. Comprehensive descriptions of X3D are given by Brutzman and Daly [2007] and descriptions of X3DOM are given by Behr et al. [2009, 2010, 2011, 2012].
2.4.1 X3D
X3D is an XML-based file format and runtime architecture to represent 3D scenes [X3D Website 2014]. It evolved from its predecessor Virtual Reality Modeling Language (VRML). X3D is royalty-free and since 2004 an International Organization for Standardization (ISO) ratified standard [X3D Standard 2014]. The development is managed by the Web3D Consor-tium. All subsequent statements refer to version 3.3 of the XML Schema Definition (XSD) for X3D [X3D Schema 2014].
Features
X3D provides a set of componentized features that can be tailored for use in several areas of applications, such as in engineering, in information as well as scientific visualization, in education, and in entertainment [X3D Website 2014]. The following features are supported: 3D graphics, 2D graphics, animation, spatialized audio and video, user interaction, naviga-tion, user-defined objects, scripting, networking, physical simulanaviga-tion, geospatial positioning, Computer-aided Design (CAD) geometry, layering, support for programmable shaders, and particle systems.
Profiles, Components, and Levels
The underlying structure of X3D is modular. It is organized in nested profiles varying in func-tionality and complexity. Aprofileis composed by a predefined set of components [Brutz-man and Daly 2007, p. 13ff]. Each component is divided into levels describing increasing capability. Every X3D node belongs to a component and varies in features depending on the component level. The specification of a profile is mandatory and the specifications of components and levels are optional.
There are five main profiles, namelyCore,Interchange,Interactive,Immersive, andFull
as well as three special profiles namely,CADInterchange,MedicalInterchange, andMPEG-4 interactive. The latter three profiles are not relevant in this thesis and thus excluded from
further description. Figure 2.10 puts the five main profiles in a hierarchical relationship.
Full
Immersive
Interactive
Interchange
Core
Figure 2.10:Profiles of the X3D standard [Brutzman and Daly 2007, p. 13].
All profiles build upon each other, i.e., every profile that is higher in the hierarchy includes the capabilities of its lower profile. For example, theInteractiveprofile offers all
capabil-ities from theCoreand theInterchangeprofile. The Coreprofile provides minimal
defini-tions required by an X3D browser, such as the routing mechanism and meta-data. It acts as a base level so that an author can build minimally defined scenes specifying the required com-ponents and levels explicitly. TheInterchangeprofile is the base for the representation and
exchange of geometric models providing material, texture, lightening, and animation func-tionality. The Interactive profile adds the nodes necessary for users to interact with the
scene, such as sensors. TheImmersiveprofile adds audio, scripting, 2D geometry,
environ-mental effects, and event utilities. This profile most closely matches the VRML 97 standard. TheFullprofile includes all nodes available in the X3D standard and covers advanced areas,
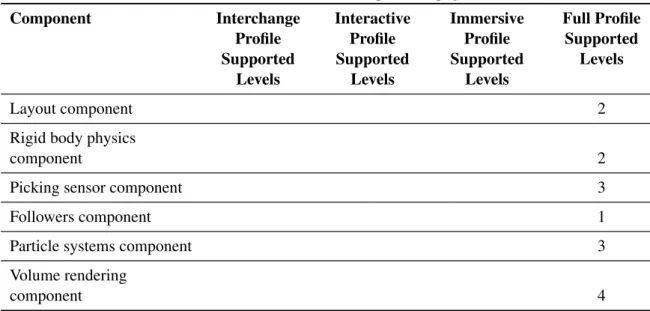
as for example humanoid animation and geospatial components. Table 2.3 gives an overview of the supported components with corresponding levels in each profile.
Table 2.3:Overview of profiles, components, and levels in X3D version 3.3 [X3D Standard 2014]. Component Interchange Profile Supported Levels Interactive Profile Supported Levels Immersive Profile Supported Levels Full Profile Supported Levels Core 1 1 2 2 Time 1 1 1 2 Networking 1 2 3 3 Grouping 1 2 2 3 Rendering 3 3 3 5 Shape 1 1 2 4 Geometry3D 2 3 4 4 Geometry2D 1 2 Text 1 1 Sound 1 1 Lighting 1 2 2 3 Texturing 2 2 3 3 Interpolation 2 2 2 5
Pointing device sensor 1 1 1
Key device sensor 1 2 2
Environmental sensor 1 2 3 Navigation 1 1 2 3 Environmental effects 1 1 2 4 Geospatial 2 Humanoid animation 1 Non-uniform Rational B-Spline (NURBS) 4 Distributed interactive simulation (DIS) 2 Scripting 1 1 Event utilities 1 1 1 Programmable shaders 1 CAD geometry 2 Texturing 3D 2
Cube map
environ-mental texturing 3
Layering component 1
Table 2.3– continued from previous page Component Interchange Profile Supported Levels Interactive Profile Supported Levels Immersive Profile Supported Levels Full Profile Supported Levels Layout component 2
Rigid body physics
component 2
Picking sensor component 3
Followers component 1
Particle systems component 3
Volume rendering
component 4
Encoding
X3D supports three file formats. First, the XML-based format with the suffix*.x3d. Second,
the VRML syntax with the suffix*.x3dv. Finally, the binary format with the suffix*.x3db.
Conventions
There are two important conventions in X3D concerning coordinate system and units of measurement [X3D Standard 2014]. Every scene has a three-dimensional, Cartesian, right-handed coordinate system. For this reason, rotations perform in a mathematical positive sense, i.e., counter-clockwise. The units of measurement for length, angle, time and color are listed in Table 2.4.
Table 2.4:Units of measurement in X3D.
Category Unit of Measurement
Length Meter
Angle Rad
Time Seconds
Color RGB(0.0–1.0, 0.0–1.0, 0.0–1.0)
Scene Graph
A scene graph is the basic unit of the X3D runtime environment. It is a directed, acyclic
graph or a tree, respectively [Brutzman and Daly 2007, p. 1]. The nodes of this tree corre-spond to objects of the scene. All objects are positioned in the virtual world according to the transformation hierarchy. This hierarchy describes the spatial relationships of the objects.
Further, the behavior graph describes the connections between fields of nodes and the flow of events through the system.
Runtime Architecture
The interpretation, execution, and representation of a scene is realized by the X3D browser. The browser reads a scene description and parses its content. The created nodes are trans-ferred to the scene graph manager which renders the nodes with corresponding geometry, appearance, position, and orientation. Further, the manager is able to receive events from an-imation or script nodes manipulating the scene. The Abstract Scene Access Interface (SAI) provides means to access nodes of a scene at runtime. Figure 2.11 outlines the architecture of X3D.
Figure 2.11:X3D architecture [X3D Standard 2014].
Viewer
The resulting scene can be viewed in a web browser with corresponding plug-ins or stan-dalone with a player. A list of available plug-ins and players can be found at [X3D Website 2014]. The InstantPlayer was used for testing during development. This viewer is part of the InstantReality platform developed by the Fraunhofer Institute for Computer Graphics [InstantReality Website 2014].
Example with X3D
To illustrate the usage of X3D, a simple example is used. Listing 2.4 shows the XML-based scene description with meta-data to create the slightly rotated red box in Figure 2.12 rendered by the InstantPlayer.
![Figure 2.2: Adapted visualization pipeline for generating software visualizations based on dos Santos and Brodlie [2004].](https://thumb-us.123doks.com/thumbv2/123dok_us/11067246.2993329/21.892.135.779.1028.1110/figure-adapted-visualization-pipeline-generating-software-visualizations-brodlie.webp)

![Figure 2.11: X3D architecture [X3D Standard 2014].](https://thumb-us.123doks.com/thumbv2/123dok_us/11067246.2993329/40.892.157.756.418.786/figure-x-d-architecture-x-d-standard.webp)
