Declaration:
I confirm that this thesis is my own work and that any material from published or unpublished work from others is appropriately referenced.
Structural Behaviour of Lean Duplex
Stainless Steel Welded I-Sections
A thesis submitted to Imperial College London
for the degree of Doctor of Philosophy
By
Najib Saliba
Department of Civil and Environmental Engineering
Imperial College London
London SW7 2AZ
2
ABSTRACT
Despite growing interest in the use of stainless steel in the construction industry and the development of a number of national and regional design codes, stainless steel is often regarded as only suitable for specialised applications. This is attributed largely to the high initial material cost associated with the most commonly adopted austenitic grades of stainless steel, as well as some conservatism embedded in current stainless steel guidance. A recently developed grade, known as lean duplex stainless steel (EN 1.4162), possesses higher strength than the common austenitic grades and has a lower cost, along with good corrosion resistance and adequate weldability and fracture toughness. The structural performance of lean duplex stainless steel remains relatively unexplored to date with only a few studies having been performed. The main aim of this study is to examine the structural behaviour of lean duplex stainless steel welded I-sections, and to assess the applicability of the current European stainless steel design guidance.
As part of this research, a total of fifty two material tests, four stub column tests, eight 3-point and 4-point bending tests, eight continuous beam tests and nine shear buckling tests were carried out. The experimental programme was complemented by a parallel numerical investigation, in which finite element models were initially validated against the test results and subsequently used for parametric studies. These test and numerical results were used in conjunction with existing test data on stainless steel welded I-sections to characterise the basic material properties, assess the codified slenderness limits for cross-section classification, investigate the applicability of plastic design to indeterminate stainless steel structures, and establish new shear resistance design equations for stainless steel plate girders.
Based on the findings, it was concluded that the present European design provisions can be safely applied to lean duplex but are rather conservative in some areas. To rectify this, modifications have been proposed for cross-section classification, plastic design and shear resistance calculations. These proposals, together with additional developments to the strain based continuous strength method of design, are suitable for incorporation into future revisions of Eurocode 3.
3
ACKNOWLEDGEMENTS
The work presented in this thesis was carried out under the supervision of Dr Leroy Gardner, Reader in the Department of Civil and Environmental Engineering, to whom I extend my sincere gratitude. I am extremely appreciative for his continuous support, invaluable advice, guidance, knowledge, patience and encouragement throughout my research.
I would like to thank the UK Outokumpu Stainless Steel Research Foundation for the supply of test specimens and for funding the laboratory testing programme.
The experimental part of this project has been carried out in the Structures Laboratory of the Department of Civil and Environmental Engineering at Imperial College London. I would like to thank all the technicians who contributed to the work, particularly Gordon Herbert and Les Clark for their expertise, hard work and patience. I am thankful to the members of staff in the Department particularly, Fionnuala Ni Dhonnabhain, for her continuous assistance. Special thanks should be given to Dr Jeanette Abela, Dr Ada Law, Sheida Afshan, Anqi Chen, Martin Eder, Ebuka Nwankwo, and Karl Micallef who made Room 429 a quiet and ideal working environment.
Very special thanks are due to Fatima Almubbad for tolerating me, encouraging me and supporting me throughout the course of my research. I am also thankful to all of my friends in London and Lebanon for their appreciation of my study.
Last, yet above all, words could never be enough to express how grateful I am to my parents, Roula and Georges, to whom I dedicate this thesis. Their continuous love and support has always been the reason behind any success I achieve. I will forever be thankful for their moral and financial support without which the completion of this thesis would have never been possible. Finally, I would like to convey my appreciation to my sisters Nada and Nina and my family for their inspirational encouragement.
4
CONTENTS
Abstract...2 Acknowledgements...3 Contents...4 Notation...11 List of figures...18 List of tables...25CHAPTER 1 – INTRODUCTION
1.1 BACKGROUND ... 281.2 STAINLESS STEEL ALLOYS, MATERIAL GRADES AND PRODUCT FORMS ... 29
1.3 STRUCTURAL APPLICATIONS OF STAINLESS STEEL ... 30
1.4 LEAN DUPLEX STAINLESS STEEL ... 33
CONTENTS
5
CHAPTER 2 – LITERATURE REVIEW
2.1 INTRODUCTION ... 37
2.2 STRUCTURAL STAINLESS STEEL DESIGN STANDARDS ... 38
2.2.1 American Standards ... 38
2.2.2 Australia/New Zealand Standards... 38
2.2.3 European Standards ... 39
2.2.4 Discussion ... 39
2.3 STRUCTURAL PERFORMANCE DATA ... 40
2.3.1 Introduction ... 40
2.3.2 Review of laboratory tests ... 41
2.3.3 Stub column tests ... 42
2.3.4 In-plane bending tests ... 42
2.3.5 Shear tests ... 43 2.4 NUMERICAL MODELLING ... 43 2.4.1 Introduction ... 43 2.4.2 Element type ... 44 2.4.3 Analysis technique ... 44 2.4.4 Material modelling ... 45 2.4.5 Geometric imperfections ... 47 2.4.6 Residual stresses ... 48 2.5 DISCUSSION ... 48
CHAPTER 3 – CROSS-SECTION STABILITY
3.1 INTRODUCTION ... 506
3.2.1 Material testing ... 51
3.2.2 Measurement of geometric imperfections ... 60
3.2.3 Stub column tests ... 60
3.2.4 Beam tests ... 64
3.3 NUMERICAL MODELLING ... 70
3.3.1 Introduction ... 70
3.3.2 Basic modelling assumptions ... 70
3.3.3 Material modelling ... 71
3.3.4 Initial geometric imperfections ... 71
3.3.5 Residual stresses ... 72
3.3.6 Validation of models and parametric studies ... 72
3.4 ANALYSIS OF RESULTS AND DESIGN RECOMMENDATIONS ... 79
3.4.1 Introduction ... 79
3.4.2 Slenderness limits ... 79
3.4.3 Compression ... 80
3.4.4 Bending ... 81
3.5 Continuous strength method... 87
3.6 Comparison with other stainless steel grades ... 90
3.7 CONCLUDING REMARKS ... 92
CHAPTER 4 – CONTINUOUS BEAMS
4.1 INTRODUCTION ... 944.2 OVERVIEW OF PLASTIC DESIGN ... 95
4.2.1 Plastic analysis ... 95
4.2.2 Calculation of rotation capacity ... 96
CONTENTS
7
4.3 EXPERIMENTAL INVESTIGATION ... 99
4.3.1 Introduction ... 99
4.3.2 Material tests ... 100
4.3.3 Continuous beam tests ... 100
4.4 NUMERICAL MODELLING ... 107
4.4.1 Introduction ... 107
4.4.2 Validation of models ... 107
4.4.3 Parametric studies ... 110
4.5 ANALYSIS OF TEST RESULTS AND DESIGN RECOMMENDATIONS 111 4.5.1 Introduction ... 111
4.5.2 European codified design predictions ... 112
4.5.3 Conventional plastic analysis ... 114
4.5.4 The continuous strength method (CSM) without moment redistribution 116 4.5.5 The continuous strength method (CSM) with moment redistribution . 118 4.5.6 Other stainless steel grades and cross-sections ... 119
4.6 CONCLUDING REMARKS ... 121
CHAPTER 5 –PLATE GIRDERS
5.1 INTRODUCTION ... 1235.2 EXPERIMENTAL PROGRAMME ... 124
5.2.1 Material testing ... 124
5.2.2 Plate girder tests ... 132
5.3 NUMERICAL MODELLING ... 139
5.3.1 Basic modelling assumptions ... 139
8
5.3.3 Parametric studies ... 146
5.4 ANALYSIS OF RESULTS ... 146
5.4.1 Introduction ... 146
5.4.2 Failure modes ... 147
5.4.3 Eurocode 3: Part 1.4 design method ... 151
5.4.4 Comparison of test and numerical shear capacities with EN 1993-1-4 for plate girders with rigid end posts ... 153
5.4.5 Comparison of test and numerical shear capacities with EN 1993-1-4 for plate girders with non-rigid end posts ... 156
5.4.6 Comparison with other stainless steel grades ... 159
5.5 CONCLUDING REMARKS ... 160
CHAPTER 6 – SHEAR DESIGN RECOMMENDATIONS
6.1 INTRODUCTION ... 1616.2 LITERATURE REVIEW ... 162
6.2.1 Introduction ... 162
6.2.2 Overview of previous experimental studies ... 162
6.2.3 Overview of theoretical models for predicting shear buckling resistance 163 6.3 CURRENT AND PROPOSED DESIGN METHODS ... 163
6.3.1 Introduction ... 163
6.3.2 Carbon steel design provisions ... 164
6.3.3 Stainless steel design provisions ... 165
6.4 ANALYSIS OF STRUCTURAL PERFORMANCE DATA ON STAINLESS STEEL PLATE GIRDERS ... 167
6.4.1 Introduction ... 167
CONTENTS 9 6.4.3 Analyses of results ... 171 6.4.4 Discussion ... 178 6.5 DESIGN PROPOSALS ... 178 6.5.1 Introduction ... 178
6.5.2 Proposed design method ... 178
6.5.3 Reliability analysis ... 181
6.6 CONCLUDING REMARKS ... 185
CHAPTER 7 – THE CONTINUOUS STRENGTH METHOD FOR
DETERMINING SHEAR RESISTANCE
7.1 INTRODUCTION ... 1877.2 OVERVIEW OF THE CONTINUOUS STRENGTH METHOD ... 188
7.2.1 Brief description... 188
7.2.2 Cross-section resistance ... 189
7.2.3 Discussion ... 192
7.3 DEVELOPMENT OF THE CONTINUOUS STRENGTH METHOD TO CALCULATE SHEAR RESISTANCE ... 192
7.3.1 Web slenderness... 192
7.3.2 Shear deformation capacity... 193
7.3.3 Shear resistance according to CSM ... 198
7.4 COMPARISONS BETWEEN TEST DATA AND DESIGN MODELS ... 199
10
CHAPTER 8 – CONCLUSIONS AND RECOMMENDATIONS
FOR FUTURE RESEARCH
8.1 CONCLUSIONS ... 203 8.2 RECOMMENDATIONS AND SUGGESTIONS FOR FUTURE RESEARCH ... 207
REFERENCES...209
NOTATION
11
NOTATION
pl ln
logarithmic plastic strain p
non-dimensional local plate slenderness w
λ
non-dimensional web slendernesses A gross cross-sectional areaa shear panel length a/hw web panel aspect ratio
Ac cross-sectional area of the coupon Aw web area
Aw,m mean value of the web area
b average ratio of experimental to model resistance based on a least squares fit to the test data (Chapter 6)
b overall flange width bs width of the stiffeners c flat element width CHS circular hollow section
12 COV coefficient of variation
CSM continuous strength method
ctest measured horizontal dimension from the support stiffener to the plastic hinge that formed in the flange at collapse
e distance between the end post and the internal stiffener over the support
E Young’s modulus
E0.2 tangent modulus at 0.2% offset strain EHS elliptical hollow section
Esh strain hardening slope
Fcoll theoretical total plastic collapse load FE finite element
Fh1 theoretical total load corresponding to the formation of the first plastic hinge at the central support
Fpred predicted ultimate load calculated according to conventional plastic analysis
Fu total ultimate test load Fu,FE numerical ultimate load Fu,test experimental ultimate load fyf yield strength of the flange
fτw independent variableequal to fyw/√
G shear modulus
grt(X) resistance function
Gsh shear strain hardening modulus hw web depth
NOTATION
13 I second moment of area
kd,n design (ultimate limit state) fractile factor for n tests
L specimen length
LVDT linear variable displacement transducer
M applied moment
Mc,Rd cross-section bending resistance Mcsm,Rd bending resistance according to CSM MEd design bending moment
Meff,Rd bending resistance of the effective section Mel elastic moment capacity
Mf,csm,Rd moment resistance of the flanges alone according to CSM
Mf,Rd design plastic moment of resistance of a cross-section consisting of the flanges only
Mpl plastic moment capacity Mu ultimate bending moment Mu,test test ultimate bending moment
n population of test data under consideration (Chapter 6) n strain hardening exponents used in Ramberg-Osgood model n’0.2,1.0 strain hardening exponents used in Ramberg-Osgood model Nu ultimate load achieved by the stub columns
Ny yield load R rotation capacity
RHS rectangular hollow section R-O Ramberg-Osgood
14
t element thickness
tf thickness of the flange ts thickness of the stiffeners tw thickness of the web U utilization ratio
VAw coefficient of variation of the web area Vb,csm,Rd CSM total shear resistance
Vb,Rd codified total shear buckling resistance
Vbf,csm,Rd flange contribution to shear resistance according to the CSM Vbf,Rd flange contribution to shear resistance
Vbw,csm,Rd CSM web shear resistance Vbw,Rd codified web shear resistance
Vcr elastic critical shear buckling load of the web Vr combined coefficient of variation
Vrt coefficient of variation of the basic variables
Vu,FE ultimate shear resistance obtained from the FE models with rigid end post
Vu,FE,non-rigid ultimate shear resistance obtained from the FE models with non-rigid end post
Vu,test test ultimate shear force Vy shear yield load
Vδ coefficient of variation of the tests relative to the resistance model Vτyw coefficient of variation of the shear yield strength
Wel elastic section modulus Wpl plastic section modulus
NOTATION
15
X constant
γ shear strain
γcsm CSM shear limiting strain
γM0 partial safety factor for cross-section resistance γM1 partial safety factor for member buckling resistance γsb shear buckling strain
γu ultimate shear strain
γy shear yield strain of the material δ total jack displacement
δb,theory theoretical elastic bending deflection δs,theory theoretical elastic shear deflection δtotal,test total measured vertical deflection δu end shortening at ultimate load
ε strain, or material factor defined in EN 1993-1-4 εcsm CSM limiting strain
εf plastic strain at fracture εlb local buckling strain εnom engineering strain εt0.2 total strain at σ0.2 εt1.0 total strain at σ1.0
εu strain at the ultimate tensile stress εy yield strain of the material
η parameter that approximates the influence of strain hardening θ rotation at mid-span taken as the sum of the end rotations θpl elastic component of the rotation when Mpl is reached
16 θu total rotation at mid-span when the moment curve falls back below Mpl
κ curvature
κpl elastic curvature corresponding to Mpl defined as κpl=Mpl/EI
κu total curvature at the plastic hinge when the moment-rotation curve falls back below Mpl
σ stress
σ0.2 proof stress at 0.2% offset strain σ0.2w yield strength of the web
σ1.0 proof stress at 1% offset strain σAw standard deviation of the web area
σcr elastic critical buckling stress of a cross-section or individual plate element
σcsm CSM limiting stress σnom engineering stress σtrue true stress
σu ultimate tensile stress
στyw standard deviation of the yield strength in shear τcr elastic critical shear buckling stress of web panel τy yield shear stress
τyw,m mean value of the shear yield strength υ Poisson’s ratio
χw web shear buckling reduction factor
ωD&W imperfection amplitude derived from the predictive model of Dawson and Walker
NOTATION
17 ωflange2 flange 2 maximum measured local geometric imperfection
18
LIST OF FIGURES
Figure 1.1: Edmonton Composting Facility, Canada ... 31
Figure 1.2: Walt Disney Concert Hall, Los Angeles, USA ... 31
Figure 1.3: Helix Bridge, Singapore ... 32
Figure 1.4: Cloud Gate sculpture, Chicago, Illinois, USA ... 32
Figure 1.5: Comparison between austenitic, ferritic, duplex and lean duplex stress-strain curves ... 34
Figure 2.1: Comparison between test and Ramberg-Osgood stress-strain curves ... 46
Figure 2.2: Typical conversion of engineering stress-strain to true stress-strain ... 47
Figure 3.1: Compressive coupons bracing jig... 52
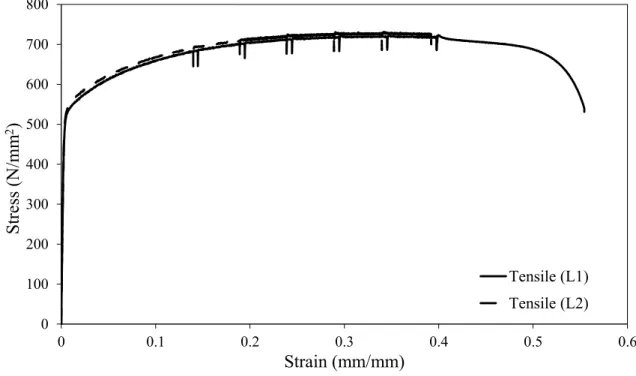
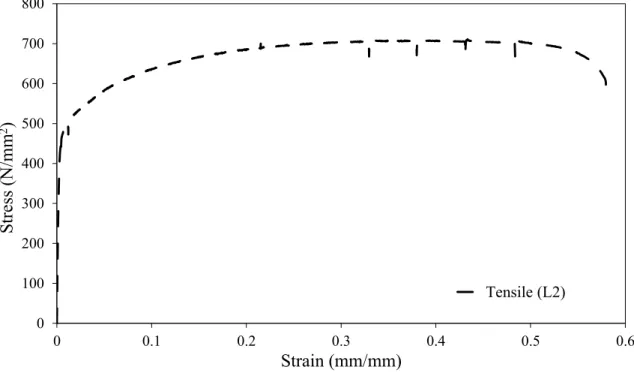
Figure 3.2: Full tensile stress-strain curve for 6 mm material (L= Longitudinal) ... 53
Figure 3.3: Initial part of tensile and compressive stress-strain curves for 6 mm material (L= Longitudinal, T: Transverse) ... 53
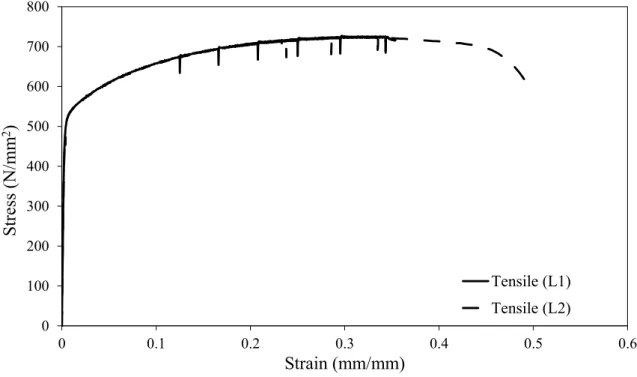
Figure 3.4: Full tensile stress-strain curve for 8 mm material (L= Longitudinal) ... 57
Figure 3.5: Initial part of tensile and compressive stress-strain curves for 8 mm material (L= Longitudinal, T= Transverse) ... 57
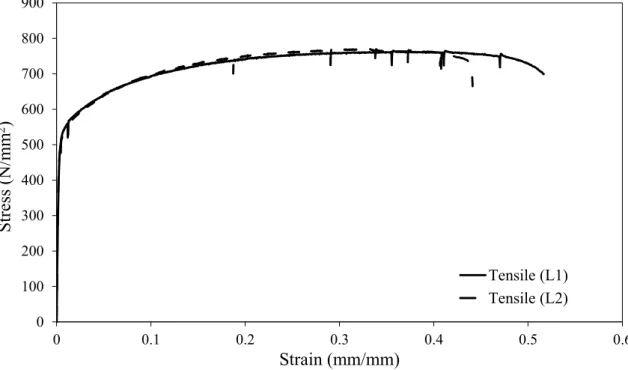
Figure 3.6: Full tensile stress-strain curve for 10 mm material (L= Longitudinal) ... 58
Figure 3.7: Initial part of tensile and compressive stress-strain curves for 10 mm material (L= Longitudinal, T= Transverse) ... 58
LIST OF FIGURES
19 Figure 3.9: Initial part of tensile and compressive stress-strain curves for 12 mm
material (L= Longitudinal, T=Transverse) ... 59
Figure 3.10: Stub column test setup ... 62
Figure 3.11: Cross-section notation ... 62
Figure 3.12: Typical stub column failure mode ... 63
Figure 3.13: Stub column load-end shortening curves ... 63
Figure 3.14: Schematic 3-point bending test arrangement ... 65
Figure 3.15: Schematic 4-point bending test arrangement ... 65
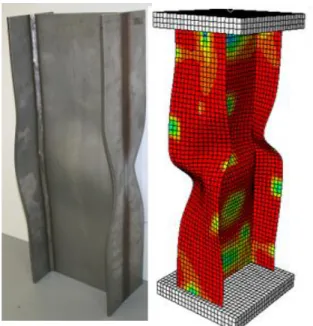
Figure 3.16: Typical failure mode from 3-point bending tests ... 68
Figure 3.17: Typical failure mode from 4-point bending tests ... 68
Figure 3.18: Normalised moment-rotation curves for the tested sections under 3-point bending ... 69
Figure 3.19: Normalised moment-curvature curves for the tested sections under 4 point bending ... 69
Figure 3.20: Effect of residual stresses on I−200×140×6×6-1 and I−200×140×12×8-1 3-point bending FE models ... 73
Figure 3.21: Typical local buckling failure mode from the FE stub column models ... 76
Figure 3.22: Typical FE failure mode in the 3-point bending configuration ... 76
Figure 3.23: Typical FE failure mode in the 4-point bending configuration ... 77
Figure 3.24: Experimental and numerical load-end shortening curve for the stub column I−200×140×10×8 ... 77
Figure 3.25: Experimental and numerical normalised moment-rotation curve for the 3 point bending of I−200×140×10×8-1 ... 78
Figure 3.26: Experimental and numerical normalised moment-curvature curve for the 4-point bending of I−200×140×10×8-2 ... 78
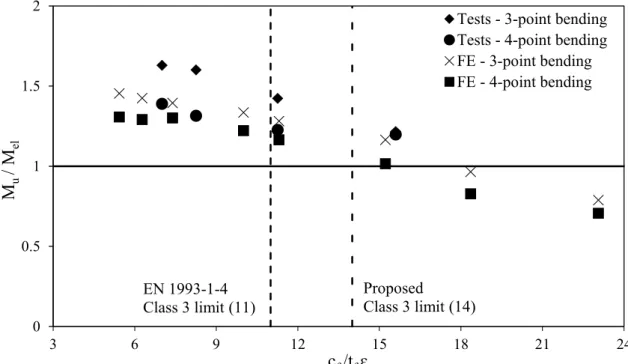
Figure 3.27: Assessment of Class 3 slenderness limits for internal web elements in compression ... 81
Figure 3.28: Assessment of Class 3 slenderness limits for welded outstand flanges in compression ... 84
Figure 3.29: Assessment of Class 3 slenderness limits for internal web elements in bending ... 84
Figure 3.30: Assessment of Class 2 slenderness limits for welded outstand flanges in compression ... 85 Figure 3.31: Assessment of Class 2 slenderness limits for internal web elements in
20
bending ... 85
Figure 3.32: Assessment of Class 1 slenderness limits for welded outstand flanges in compression ... 86
Figure 3.33: Assessment of Class 1 slenderness limits for internal web elements in bending ... 86
Figure 3.34: Class 3 limits for internal compression elements – comparison between stainless steel grades ... 91
Figure 3.35: Class 3 limits for welded outstand flanges – comparison between stainless steel grades ... 91
Figure 3.36: Class 2 limits for welded outstand flanges – comparison between stainless steel grades ... 92
Figure 4.1: Definition of rotation capacity ... 97
Figure 4.2: Test configuration ‘1/2 span’ – loads applied at midspan ... 102
Figure 4. : Te st configuration ‘1/ span’ – loads applied at 800 mm from central support... 102
Figure 4.4: Typical failure mode of I-200×140×6×6-1 – configuration: 1/2 span ... 104
Figure 4.5: Typical failure mode of I-200×140×8×6-2 – configuration: 1/3 span ... 104
Figure 4.6: Total load versus jack displacement for 1/2 span configuration ... 105
Figure 4.7: Total load versus jack displacement for 1/3 span configuration ... 105
Figure 4.8: Normalised load versus end rotation for 1/2 span configuration ... 106
Figure 4.9: Normalised load versus end rotation for 1/3 span configuration ... 106
Figure 4.10: Typical FE failure mode for the 1/2 span configuration continuous beam arrangement... 109
Figure 4.11: Typical FE failure mode for the 1/3 span configuration continuous beam arrangement... 109
Figure 4.12: Experimental and numerical total load versus end rotation curves for Specimen I−200×140×10×8-1 ... 109
Figure 4.13: Experimental and numerical total load versus end rotation curves for Specimen I−200×140×8×6-2 ... 110
LIST OF FIGURES
21 Figure 5.1: Initial part of tensile and compressive stress-strain curves for 4 mm
material (L= Longitudinal, T: Transverse) ... 128 Figure 5.2: Initial part of tensile and compressive stress-strain curves for 6 mm
material (L= Longitudinal, T: Transverse) ... 129 Figure 5.3: Initial part of tensile and compressive stress-strain curves for 8 mm
material (L= Longitudinal, T: Transverse) ... 129 Figure 5.4: Initial part of tensile and compressive stress-strain curves for 10 mm
material (L= Longitudinal, T= Transverse) ... 130 Figure 5.5: Initial part of tensile and compressive stress-strain curves for 12 mm
material (L= Longitudinal, T= Transverse) ... 130 Figure 5.6: Initial part of tensile and compressive stress-strain curves for 15 mm
material (L= Longitudinal, T= Transverse) ... 131 Figure 5.7: Initial part of tensile and compressive stress-strain curves for 20 mm
material (L= Longitudinal, T= Transverse) ... 131 Figure 5.8: Geometry of the tested plate girder ... 132 Figure 5.9: Location of strain gauges ... 135 Figure 5.10: Schematic shear test setup and instrumentation ... 135 Figure 5.11: Load-mid-span vertical displacement curves for plate girders of aspect
ratio 1.0 ... 137 Figure 5.12: Load-mid-span vertical displacement curves for plate girders of aspect
ratio 2.0 ... 137 Figure 5.13: Load-lateral web displacement curves for plate girders of aspect ratio
1.0... 138 Figure 5.14: Load-lateral web displacement curves for plate girders of aspect ratio
2.0... 138 Figure 5.15: Typical shear dominant FE failure mode for plate girders with a web
panel aspect ratio of 1.0 ... 142 Figure 5.16: Typical shear dominant FE failure mode for plate girders with a web
panel aspect ratio of 2.0 ... 142 Figure 5.17: Experimental and numerical load-mid-span vertical displacement curve
22 Figure 5.18: Experimental and numerical load-mid-span vertical displacement curve
for the plate girder I−600×200×12×8-2 ... 143 Figure 5.19: Evolution of principal strains at centre of web panel for plate girder
I−600×200×12×8-1− comparison between experimental and numerical results ... 144 Figure 5.20: Evolution of principal strains at corner of web panel for plate girder
I−600×200×12×8-1− comparison between experimental and numerical results ... 145 Figure 5.21: Inclination of principal plane to horizontal at centre of web panel for
plate girder I−600×200×12×4-1− comparison between experimental and numerical results ... 145 Figure 5.22: Typical shear dominant failure mode showing shear buckling of the web
for plate girder I−600×200×12×4-1 ... 148 Figure 5.23: Moment-shear interaction diagram from EN 1993-1-4 (2006) for plate
girder I−600×200×12×4-1 exhibiting a shear dominant failure mode1 148 Figure 5.24: Typical bending dominant failure mode showing local flange buckling
for plate girder I−600×200×12×10-2 ... 149 Figure 5.25: Moment-shear interaction diagram from EN 1993-1-4 (2006) for plate girder I−600×200×12×10-2 exhibiting a bending dominant failure
model... 150 Figure 5.26: Typical combined shear plus bending failure mode for plate girder
I−600×200×12×8-1 ... 151 Figure 5.27: Moment-shear interaction diagram from EN 1993-1-4 (2006) for plate
girder I−600×200×12×8-1 exhibiting a combined shear-bending failure mode1 ... 151 Figure 5.28: Moment-shear interaction diagrams and definition of cases 1 (shear
dominant failure as Vu,test/ Mu,test >Vbw,Rd/ Mf,Rd) and 2 ... 155 Figure 5.29: Comparison of experimental and numerical results for lean duplex
stainless steel plate girders with rigid and non-rigid end posts and the EN1993-1-4 (2006) shear design model ... 156 Figure 5.30: Comparison of shear buckling resistance for tested plate girders of
LIST OF FIGURES
23 Figure 6.1: Geometry of the tested plate girders... 168 Figure 6.2: Test data and normalised moment-shear interaction diagram according to
EN 1993-1-4 (2006) ... 172 Figure 6.3: Comparison between experimental results of case 1 only and the shear
resistance function of EN 1993-1-4 (2006) ... 173 Figure 6.4: Utilization ratio (test/design resistance) as obtained from EN 1993-1-4
(2006) ... 174 Figure 6.5: Comparison between experimental results of case 1 only and the shear
resistance function of EN 1993-1-5 (2006) ... 176 Figure 6.6: Comparison between experimental results of case 1 only and the shear
resistance function of Estrada et al. ... 177 Figure 6.7: Utilization ratio (test/design resistance) as obtained from the proposed
equations of this chapter ... 180 Figure 6.8: Comparison between experimental results of case 1 only and the shear
resistance functions of EN 1993-1-4 (2006) and the proposed approach . 181 Figure 6.9: The powers a and b for rigid and non-rigid end posts versus web
slenderness
λ
w ... 185Figure 7.1: Bi-linear elastic, linear hardening stress-strain model ... 191 Figure 7.2: Shear strain γ in a rectangular element subjected to uniform shear stress
τ ... 194 Figure 7.3: Geometric deformation of an infinitesimal material element; definition of
the engineering shear strain γ ... 194 Figure 7.4: Calculation of the shear strain γfor the test and FE data using the diagonal
readings d1 and d2 ...196 Figure 7.5: Calculation of the shear strain γδ for published results using the reported
total vertical deflection δtotal,test, modified as shown to determine δs,test ...196 Figure 7.6: Shear base curve – relationship between shear strain ratio and web
slenderness ... 198 Figure 7.7: Bi-linear elastic, linear hardening shear stress-strain model ... 199 Figure 7.8: Comparison of the CSM scenario 1, EN1993-1-4 (2006) and proposed
24 Figure 7.9: Comparison of the CSM scenario 2, EN1993-1-4 (2006) and proposed
equations of Chapter 6 with plate girder test and FE results ... 201 Figure 7.10: Moment-shear interaction diagrams according to EN 1993-1-4 (2006) 202
Figure A.1: Full tensile stress-strain curve for 4 mm material (L= Longitudinal, T= Transverse) ... 223 Figure A.2: Full tensile stress-strain curve for 6 mm material (L= Longitudinal, T= Transverse) ... 224 Figure A.3: Full tensile stress-strain curve for 8 mm material (L= Longitudinal, T= Transverse) ... 224 Figure A.4: Full tensile stress-strain curve for 10 mm material (L= Longitudinal, T= Transverse) ... 225 Figure A.5: Full tensile stress-strain curve for 12 mm material (L= Longitudinal, T= Transverse) ... 225 Figure A.6: Full tensile stress-strain curve for 15 mm material (L= Longitudinal, T= Transverse) ... 226 Figure A.7: Full tensile stress-strain curve for 20 mm material (L= Longitudinal, T= Transverse) ... 226
LIST OF TABLES
25
LIST OF TABLES
Table 2.1: Tests conducted on stainless steel welded I-sections ... 41
Table 3.1: Measured material properties from tensile coupon tests and mill
certificates ... 54 Table 3.2: Measured material properties from compressive coupon tests and mill
certificates ... 55 Table 3.3: Measured geometric imperfection amplitudes ... 60 Table 3.4: Stub column test data ... 61 Table 3.5: Dimensions of the tested cross-sections under 3-point bending ... 66 Table 3.6: Summary of key test results from 3-point bending ... 67 Table 3.7: Dimensions of the tested cross-sections under 4-point bending ... 67 Table 3.8: Summary of key test results from 4-point bending ... 67 Table 3.9: Comparison of the laboratory test results with FE results for varying
imperfection amplitudes ... 75 Table 3.10: Eurocode 3 slenderness limits for carbon steel (CS), stainless steel (SS)
and proposed limits for stainless steel compression elements ... 83 Table 3.11: Assessment of EN1993-1-4, the proposed limits and the CSM for the
tested specimens and FE models... 89
26 Table 4.2: Results for continuous beam tests... 104 Table 4.3: Comparison of the laboratory test results with FE results for varying
imperfection amplitudes ... 108 Table 4.4: Dimensions and key results from the FE continuous beam parametric
study ... 111 Table 4.5: Comparison of test and code predicted failure loads for continuous
beams ... 113 Table 4.6: Comparison of FE and code predicted failure loads for continuous
beams ... 113 Table 4.7: Comparison between test and predicted failure loads for continuous beams
allowing for plastic design for Class 1 sections ... 115 Table 4.8: Comparison between test and FE failure loads for continuous beams
allowing for plastic design for Class 1 sections ... 116 Table 4.9: Assessment of the CSM for the tested continuous beams ... 117 Table 4.10: Assessment of the CSM for the FE continuous beams ... 118 Table 4.11: Comparison of test data reported by Mirambell and Real (2000) and
Theofanous and Gardner (2010) with design predictions based on
EN 1993-1-4 (2006) and CSM ... 120 Table 4.12: Comparison of test data reported by Mirambell and Real (2000) and
Theofanous and Gardner (2010) with design predictions based on
conventional plastic analysis... 121
Table 5.1: Measured material properties from tensile coupon tests, together with comparative transverse tension mill certificate values ... 126 Table 5.2: Measured material properties from compressive coupon tests, together with
comparative transverse tension mill certificate values ... 127 Table 5.3: Measured dimensions of plate girders and key test results ... 133 Table 5.4: Comparison between experimental and numerical results ... 141 Table 5.5: Comparisons of experimental results with EN 1993-1-4 predictions ... 154 Table 5.6: Comparisons of parametric FE results on plate girders with rigid end posts
LIST OF TABLES
27 Table 5.7: Comparisons of parametric FE results on plate girders with non-rigid end
posts with the EN 1993-1-4 predictions... 158 Table 5.8: Comparison between FE results for rigid and non-rigid end post plate
girders ... 158
Table 6.1: Collected experimental data on stainless steel plate girders ... 169 Table 6.2: Utilization ratios (test/design resistance) for plate girders as obtained from EN 1993-1-4 (2006), EN 1993-1-5 (2006), Estrada et al. (2007) and
proposed design methods ... 175 Table 6.3: Proposed design expressions for the calculation of the web contribution to
the shear resistance ... 180 Table 6.4: Results of statistical analysis of test data for proposed web shear resistance
equations ... 184
Table 7.1: Comparison of the CSM scenario 1, EN1993-1-4 (2006) and proposed equations of Chapter 6 with plate girder test and FE results ... 201 Table 7.2: Comparison of the CSM scenario 2, EN1993-1-4 (2006) and proposed
28
CHAPTER 1
INTRODUCTION
1.1
BACKGROUND
Now, one hundred years after its first inception, stainless steel refers to a family of corrosion resistant iron alloys that contain at least a minimum of 11% chromium by mass. The term ‘stainless’ was first popularized by Ernest Stuart, a cutlery manager, while the commercial birth of stainless steel is generally credited to the English metallurgist, Harry Brearley, in 1913. The use of stainless steel has expanded over the years from just cutlery to a wide range of applications, including wall claddings, architectural components and structural elements in buildings and bridges within the construction industry, as well as being used in marine applications, the food and chemical industries and the automotive and aerospace industries. The widespread use may be attributed largely to the range of characteristics that stainless steels exhibit, with corrosion resistance being one of its major strengths. Contrary to carbon steel, the corrosion resistance of stainless steel can eliminate the need to apply protective
CHAPTER 1 - INTRODUCTION
29 coating against corrosion and therefore reduces the necessity of continuous maintenance leading to overall savings in terms of economy (Mann, 1993; Gardner, 2005; Baddoo, 2008). Furthermore, stainless steel has superior temperature resistance characteristics compared to carbon steel making it a most suitable material for applications where elevated temperatures or fire may occur (Gardner and Baddoo, 2006; Gardner, 2007). Stainless steel is an environmentally friendly material and may be used for sustainable development due its long life span and its reusable recyclable nature.
Despite its beneficial characteristics, the major drawback of stainless steel is its high initial cost which is approximately four times that of carbon steel for the most commonly used austenitic grades. In general, cost highly influences the choice of a material but, considering the lifecycle cost of stainless steel with its distinctive characteristics (long life span, corrosion resistance, high temperature resistance and recyclability) makes it a more appealing choice (Gardner, 2007).
1.2
STAINLESS STEEL ALLOYS, MATERIAL GRADES AND
PRODUCT FORMS
Stainless steel is an iron based alloy that contains a minimum chromium content of about 11% by mass. This minimum amount of chromium allows the formation of a protective surface layer of chromium oxide (Cr2O3), which protects the original metal from corrosion and gives stainless steel its corrosion resistance. This layer is referred to as a non-porous passive film which is highly resistant to chemical attack and is capable of regenerating itself in the presence of oxygen. Stainless steel also consists of other alloys, most important of which are nickel (Ni) and molybdenum (Mo), which are added to increase the stability of the previously mentioned passive layer and to increase the ductility and weldability of stainless steel. There is a wide variety of stainless steel grades that are classified according to their atomic structure as austenitic (face-centred cubic), ferritic (body-centred cubic), duplex (mixed crystalline structure of austenitic and ferritic stainless steel), precipitation hardening and martensitic (EN 10088-1, 2005).
30 The most commonly used grades for structural applications are the austenitic and duplex grades due to their excellent ductility, weldability and corrosion resistance characteristics, with the duplex grade generally reaching higher strengths than the austenitic grade. Various grades and forms of stainless steel such as plates, sheets, tubes, bars, fasteners, cold-formed structural sections and hot-rolled structural sections may be manufactured depending on the alloy content and production process. It is worth noting that a number of stainless steel designation systems are in use, such as the AISI system which is adopted by both the American and Australian standards, the Unified Numbering System (ASTM 2002) and the European system (EN 10088-1, 2005). The European system (EN 10088-1, 2005) will be adhered to throughout the remainder of this thesis.
1.3
STRUCTURAL APPLICATIONS OF STAINLESS STEEL
The use of stainless steel in construction dates back to as early as 1929, when it was used as the cladding for the upper part of the famous Chrysler Building in New York. Other notable stainless steel structure is The Gateway Arch in St. Louis, Missouri, which was completed in 1965 and continues to be the second largest stainless steel structure in the world. Recent years have seen a significant increase in the usage of stainless steel for structural applications. Figure 1.1 shows the largest stainless building in North America, the Edmonton Composting Facility in Canada. Another remarkable structure is the Walt Disney Concert Hall in Los Angeles that is cladded with stainless steel as shown in Figure 1.2. Stainless steel has also been recently used in numerous road and pedestrian bridges; Figure 1.3 presents the Helix Bridge in Singapore, a footbridge that was inspired by the form of the curved DNA structure. One more example in which the aesthetic appeal of stainless steel was fully exploited is depicted in Figure 1.4: the Cloud Gate sculpture in Chicago, Illinois.
It may be observed that although stainless steel has been used in some structural applications its use as a primary structural element is still rather limited, with major
CHAPTER 1 - INTRODUCTION
31 applications being of a specialized nature where in most cases the aesthetic appeal of stainless steel is influential to the architectural image of the structure.
Figure 1.1:Edmonton Composting Facility, Canada
(http://en.wikipedia.org/wiki/Edmonton_Composting_Facility)
Figure 1.2:Walt Disney Concert Hall, Los Angeles, USA (http://en.wikipedia.org/wiki/Walt_Disney_Concert_Hall)
32
Figure 1.3:Helix Bridge, Singapore (courtesy of Er. Mah Guan Pang)
Figure 1.4:Cloud Gate sculpture,Chicago, Illinois, USA (courtesy of Dr Leroy Gardner)
CHAPTER 1 - INTRODUCTION
33
1.4
LEAN DUPLEX STAINLESS STEEL
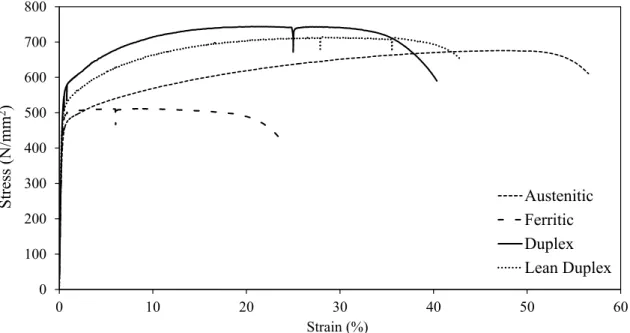
Stainless steel has a range of physical characteristics such as high strength, stiffness, and ductility together with excellent durability that makes it ideally suited for use in construction (Gardner, 2005). However, due to the high initial cost of structural stainless steel compared to that of structural carbon steel, and the relatively limited awareness of its credentials among structural engineers, the use of stainless steel as a main structural material in construction remains rather restricted. On average the ratio of the price of stainless steel (austenitic grade 1.4301) to carbon steel in the European Union for year 2012 is approximately 4 to 1 (MEPS, www.meps.co.uk). The high initial cost of stainless steel is largely attributed to the nickel content which, for the commonly used grades of austenitic stainless steel, lies between about 8% and 10% by mass. A new breed of stainless steel has been developed with low nickel content (around 1.5%), which may offer improved economy over existing grades. The material, referred to as lean duplex stainless steel or EN 1.4162, has a balanced austenitic-ferritic structure (approximately equal amounts of ferrite and austenite) with high chromium (21%) and nitrogen (0.22%) content and an addition of molybdenum (0.3%), providing it with good resistance to localized and uniform corrosion. Lean duplex also possesses higher strength than the austenitic grades, is less expensive, retains good high temperature properties, and has adequate weldability and fracture toughness (Outokumpu, 2010; Gardner et al., 2010; Nilsson et al., 2008; Sieurin et al., 2007). Therefore, lean duplex stainless steel may offer a better balance of properties than the austenitic grades for structural applications. A comparison between the typical stress-strain diagrams of the austenitic, ferritic, duplex and lean duplex stainless steel grades is presented in Figure 1.5.
Despite the fact that lean duplex stainless steel has already featured in the construction of a number of footbridges, such as those in Förde, Norway and Siena, Italy, and is included in the material standard EN 10088-4 (EN 10088-4, 2009) with a minimum specified 0.2% proof strength of 480 N/mm2 for plate material in the annealed condition, it is not currently covered by any structural design code, due to its structural characteristics having been largely unverified. It is the aim of this research project to study lean duplex stainless steel and to provide a better understanding of the
34 structural behaviour of this material. For this reason, a comprehensive experimental and numerical research programme investigating the structural characteristics of lean duplex stainless steel welded I-sections was initiated at Imperial College London. Initial research on lean duplex stainless steel concentrated on cold-formed hollow sections (Theofanous and Gardner, 2009; Theofanous and Gardner, 2010) while the attention of this study is on lean duplex stainless steel welded I-sections.
Figure 1.5:Comparison between austenitic, ferritic, duplex and lean duplex stress-strain curves
Although the focus of this research is on lean duplex stainless steel welded I-sections, comparisons with the most commonly used stainless steel grades in the construction industry such as the austenitic and duplex grades are also carried out. Furthermore, a key part of this study is to evaluate the current Eurocode design provisions for the design of stainless steel structures (EN 1993-1-4, 2006) and assess their applicability to lean duplex stainless steel welded I-sections. Several design codes have been developed for the design of stainless steel structures (as discussed in Chapter 2) but the general approach is still considered to be conservative, particularly for stocky structural elements, since the design rules are harmonized with those of structural carbon steel. This may lead to inefficient designs as stainless steel presents different
0 100 200 300 400 500 600 700 800 0 10 20 30 40 50 60 Stress (N/m m 2) Strain (%) Austenitic Ferritic Duplex Lean Duplex
CHAPTER 1 - INTRODUCTION
35 physical and material properties to carbon steel. Therefore, it is the intention of this research to provide design recommendations that allow for a better exploitation of the structural characteristics of stainless steel in general and lean duplex welded I-sections specifically, leading to more efficient designs.
1.5
OUTLINE OF THESIS
Chapter 1 provides an introduction to the thesis in which the history, alloy chemistry, grades, product forms and structural applications of stainless steel have been briefly discussed. Lean duplex stainless steel has also been introduced and identified as the main focus of this study. Likewise, it has been indicated that the study will concentrate on assessing the applicability of European structural stainless steel design specifications EN 1993-1-4 (2006) to lean duplex welded I-sections and stainless steel structures in general.
In Chapter 2, a comprehensive literature review relevant to this research project is presented. This includes a review of the current design codes for structural stainless steel, the available structural performance data on stainless steel welded I-sections and the key components of the finite element (FE) modelling carried out in this research. Further detailed discussion of relevant literature is presented in each of the subsequent chapters.
Chapter 3 describes the experimental and numerical programme conducted on lean duplex stainless steel welded I-sections, including material coupon tests, stub column tests and bending tests (3-point and 4-point). The results from both the tests and FE modelling are used to assess the suitability of the codified slenderness limits employed in EN 1993-1-4 (2006) and the applicability of the continuous strength method (CSM) (Gardner, 2008; Gardner et al., 2011). Comparisons with other stainless steel grades are made and design recommendations are proposed.
As part of this study, a series of laboratory tests were carried out on lean duplex stainless steel welded I-sections continuous beams to investigate the applicability of plastic design to stainless steel as it is currently not allowed for in EN 1993-1-4
36 (2006). The tests results were accompanied by a parallel numerical analysis where parametric studies were performed. Full details of the tests, results obtained, findings and proposals are reported in Chapter 4.
Chapter 5 examines the behaviour of lean duplex stainless steel welded plate girders under shear. The conducted experiments and FE modelling on lean duplex stainless steel plate girders are presented. The failure modes observed from the laboratory tests and FE modelling are discussed and analyzed. The results obtained, together with the available test data on other stainless steel plate girders, are used to assess the applicability of the EN 1993-1-4 (2006) shear design provisions to stainless steel in general and lean duplex stainless steel specifically.
In Chapter 6, a comprehensive review of the shear design methods for steel plate girders is presented and the codified design provisions for both carbon steel and stainless steel plate girders are discussed. The available test data on stainless steel plate girders is collected, reported and utilized for a comparative analysis among the different shear design methods available. Based on the collected data and comparisons, new design expressions for the calculation of the ultimate shear capacity of stainless steel plate girders are proposed and validated.
Chapter 7 focuses on applying the continuous strength method (CSM) (Gardner, 2008; Gardner et al., 2011) to the calculation of the ultimate shear resistance of stainless steel plate girders. The test data reported in Chapters 5 and 6 are utilized to develop the preliminary design expressions. Comparisons between the predicted CSM capacities and the codified capacities are presented and recommendations for further work are included.
Finally, Chapter 8 summarizes the important findings from this research project and presents the major contributions of this study. Further research suggestions are also included.
CHAPTER 2 – LITERATURE REVIEW
37
CHAPTER 2
LITERATURE REVIEW
2.1
INTRODUCTION
The aim of this chapter is to provide a comprehensive review of the previous studies carried out on structural stainless steel with a focus on welded I-sections, while further detailed literature review is presented and discussed in each of the consecutive chapters accordingly. This chapter is divided into three sections where the first section presents an overview of the development of structural design standards for stainless steel; the second section briefly summarizes the previous work carried out on stainless steel welded I-sections and reports the available structural performance data on stainless steel stub columns, beams and plate girders; and finally the third section focuses on the numerical modelling of stainless steel components covering the major findings in terms of modelling the material behaviour, geometric imperfections and residual stresses.
38
2.2
STRUCTURAL STAINLESS STEEL DESIGN STANDARDS
2.2.1
American Standards
In 1968, the American Iron and Steel Institute (AISI) was the first to publish a design code addressing structural stainless steel members and was entitled ‘Specification for the design of cold-formed stainless steel structural members’. This design code relied on the findings of the study carried out by Johnson and Winter (1966) on austenitic stainless steel and was based on the allowable stress design method. Further research performed by Wang and Winter (1969) on structural stainless steel allowed the American code to be revised and an updated version was published in 1974 by AISI (AISI, 1974). Following the research conducted in 1986 in the University of Missouri-Rolla by Lin et al. (1988), the ANSI/ASCE-8 Structural Stainless Steel Design Standard was published in 1991 (ASCE, 1991), effectively superseding the AISI standards for stainless steel in North America. The most recent American design guidance for stainless steel structures is the SEI/ASCE 8-02 ‘Specification for the design of cold formed stainless steel structural members’ (ASCE, 2002). A detailed review of the improvements in this design code is given by Lin et al. (2005). For thicker material, a new design code, AISC Design Guide 30: Structural Stainless Steel, is currently under development.
2.2.2
Australia/New Zealand Standards
The development of Australian design guidance for structural stainless steel was initiated in 1988 by a committee assembled by Standards Australia. The decision was made to base the Australian code on the North American ANSI/ASCE-8 (ASCE 1991) design code mainly because the Australian standard for cold-formed carbon steel structures AS/NZS 4600 (2005) was based on the AISI specifications. This would ensure the consistency between the Australian codes for stainless steel and carbon steel. The first Australian/New Zealand design code for stainless steel structures, AS/NZS 4673 (2001) was published in 2001, in which some additions were made to the original ANSI/ASCE standards. A detailed review of the
CHAPTER 2 – LITERATURE REVIEW
39 development of the Australian/New Zealand design code is provided by Rasmussen (2000).
2.2.3
European Standards
The first European design guidance for stainless steel structures was the SCI/Euro Inox ‘Design Manual for Structural Stainless Steel’ published in 1994 (SCI/Euro Inox, 1994). This design manual was the result of the joint industry project initiated in 1991 and managed by the UK Steel Construction Institute. The findings of this guidance formed the basis of the European pre-standard ENV 1993-1-4 (1996), which was later converted to the full European standard EN 1993-1-4 (2006) published in 2006. The latter is considered to be the latest international design standard on stainless steel structures. It is worth noting that a third edition of the SCI/Euro Inox Design Manual for Stainless Steel was published in 2006 (SCI/Euro Inox, 2006) with its commentary published in 2007 (SCI/Euro Inox, 2007). As previously mentioned in Chapter 1, EN 1993-1-4 (2006) is the design code that will be referred to and assessed throughout the thesis.
2.2.4
Discussion
The reviewed stainless steel codes adopt a material specific limiting stress value (the yield strength), referred to as the maximum stress value achieved by any structural member, hence, assuming stainless steel exhibits an elastic perfectly-plastic (bilinear) behaviour. This limit is considered to be conservative as it does not reflect the actual structural response of stainless steel and only applies to materials such as carbon steel in which they exhibit a sharply defined yield point upon which the stiffness of the material is reduced significantly. This approach was implemented to maintain consistency between stainless steel and carbon steel in order to prevent any design difficulties an engineer might encounter.
40
2.3
STRUCTURAL PERFORMANCE DATA
2.3.1
Introduction
This section contains a brief review of the experiments carried out on stainless steel structural members with the main focus being on the laboratory tests conducted on stainless steel welded I-sections. The results of carefully conducted and reported experiments are crucial to under-pining structural design codes and developing new design methods.
As documented in the Commentary to the third edition of Design Manual for Structural Stainless Steel (SCI/Euro Inox, 2007), the first stainless steel design codes were based on test data generated from experiments carried out in the nineteen fifties and sixties by Hammer and Petersen (1955), Dubuc et al. (1956) and Johnson and Winter (1966). Since then, the amount of research on stainless steel structural members has considerably risen. In a study by Theofanous (2010), 431 tested stainless steel sections were identified from the literature, but only 54 sections were welded I-sections. The majority of the reported data was based on tests performed on square, rectangular and circular hollow sections of the austenitic, ferritic, and duplex grades. The only reported tests on lean duplex stainless steel (28 tests) are those conducted by Theofanous and Gardner (2009, 2010) on square and rectangular hollow sections.
CHAPTER 2 – LITERATURE REVIEW
41
Table 2.1: Tests conducted on stainless steel welded I-sections
Test type Reference No. of tests Material grade
Stub column tests: Bredenkamp and 2 1.4003
van den Berg (1995)
ECSC WP2 (2000) 3 1.4301 1 1.4462 ECSC WP6 (2000) 7 1.4003 Kuwamura (2003) 8 1.4301 8 1.4310 In-plane bending
tests: Yamada and Kato (1988) 5 1.4301
ECSC WP2 (2000) 3 1.4301
1 1.4462
Real and Mirambell (2005) 2 1.4301
Shear tests: Olsson (2001) 4 1.4301
4 1.4462
Real et al. (2007) 9 1.4301
Estrada et al. (2007) 8 1.4301
2.3.2
Review of laboratory tests
The current study is focused upon structural lean duplex stainless steel welded I-sections, but with no data existing on lean duplex stainless steel welded I-sections prior to the start of this research project, the first step was to gather the available test data on stainless steel welded I-sections from published sources. Table 2.1 gives a summary of all tests conducted on stainless steel welded I-sections that have been reported in sufficient detail, where the number of tests performed, material grade and references are shown. A total of 65 tests are presented in Table 2.1 and have been categorized and reviewed in the subsequent chapters according to their type: stub column tests, in plane bending tests and shear buckling tests.
42
2.3.3
Stub column tests
A total of 29 stub column tests results have been collected from different authors. The first test data on stainless steel welded I-section were reported by Bredenkamp and van den Berg (1995), followed by the studies of the ECSC WP2 and WP6 (2000), while the most recent experiments were carried out by Kuwamura (2003). The main objectives of these studies were to investigate the cross-sectional behaviour of welded I-sections under axial compression, to check their local buckling behaviour and to assess the ENV 1993-1-4 (1996) design recommendations. These data, together with the data reported from experiments carried out as part of this research project, are utilized in Chapter 3 to assess the current Class 3 slenderness limits of EN 1993-1-4 (2006) and to check their applicability to lean duplex stainless steel cross-sections. The suitability of the proposed slenderness limits by Gardner and Theofanous (2008) is also assessed.
2.3.4
In-plane bending tests
A total of 11 in-plane bending tests have been collected in which 7 were 3-point bending tests and 4 were 4-point bending tests. These tests were conducted by Yamada and Kato (1988), ECSC WP2 (2000) and Real and Mirambell (2005). These authors mainly investigated the effect of the material nonlinearity of stainless steel on its behaviour in bending, including the effect of this nonlinearity on the calculation of deflections. These test data, together with those reported in Chapter 3 of this thesis, are used to evaluate the current Class 1, 2 and 3 slenderness limits of EN 1993-1-4 (2006). The generated test data are also used to investigate the behaviour of lean duplex stainless steel welded I-sections compared to other stainless steel grades, to evaluate the applicability of the proposed slenderness limits by Gardner and Theofanous (2008) to lean duplex stainless steel and to assess the applicability of the Continuous Strength Method (CSM) to lean duplex stainless steel welded I-sections.
CHAPTER 2 – LITERATURE REVIEW
43
2.3.5
Shear tests
A total of 25 experimental results on stainless steel plate girders (welded I-sections) have been collected from the literature. At the time of the development of ENV 1993-1-4 (1996), the only experimental work to address the shear resistance of stainless steel members was that carried out by Carvalho et al. (1990). The latter performed three point bending tests on cold formed members of austenitic and ferritic stainless steel grades. Their results formed the basis of the ENV 1993-1-4 (1996) design expressions. The first experimental investigation after the introduction of ENV 1993-1-4 (1996) was carried out by Olsson (2001), followed by the more recent studies of Real et al. (2007) and Estrada et al. (2007). The main objective of these experimental studies was to further understand the behaviour of stainless steel plate girders under shear and to develop design expressions capable of predicting the shear resistance of stainless steel plate girders. Chapters 6 and 7 of this thesis utilize the available test data, together with those performed within the scope of this research, to evaluate the current shear design provisions of EN 1993-1-4 (2006), to investigate other design proposals, and focuses on developing two sets of design expressions: one that is in accordance with EN 1993-1-4 (2006) and the other based on the Continuous Strength Method. It is worth noting that the results from Carvalho et al. (1990) experimental study are not considered in this research owing to concerns raised in relation to their reliability (Olsson, 2001).
2.4
NUMERICAL MODELLING
2.4.1
Introduction
The use of finite element (FE) modelling continues to increase owing to the development of advanced FE software packages along with the significant computational power available nowadays. Together with laboratory testing, both researchers and practising engineers are utilizing FE modelling to investigate the structural behaviour of metallic components. Generally, FE models are first generated and validated against a set of laboratory test data where their ability to replicate the test data and accuracy is assessed. Upon the completion of the validation step,
44 parametric studies are carried out to further understand the effect of key parameters on the structural response of the cross-sections under study. Parametric studies may be seen as an accurate and inexpensive way to generate more data, as physical laboratory testing is always governed by various constraints and limitations.
The general purpose finite element analysis package ABAQUS (Hibbitt et al., 2010) has been used for the numerical studies conducted throughout Chapters 3, 4, and 5 of this thesis. Many factors influence the accuracy of the finite element model; hence, the key findings of the comprehensive research on FE modelling of stainless steel structural components by Gardner and Nethercot (2004b) and Ashraf et al. (2006) are utilized in this project. Relevant modelling assumptions, including the used element type, the employed analysis technique, material modelling, geometric imperfections and residual stresses, adopted in the FE studies carried out in this thesis are discussed hereafter.
2.4.2
Element type
The ABAQUS (Hibbitt et al., 2010) library contains a wide range of finite elements for different modelling purposes. Throughout this research, shell elements are used as they are customarily utilized to simulate thin-walled structural components. The employed shell element for the numerical analyses is the four-noded doubly curved general-purpose shell element S4R with reduced integration and finite membrane strains. This element has been shown to be suitable for the modelling of a range of shell thicknesses and has been successfully employed in the modelling of lean duplex stainless steel (Theofanous and Gardner, 2009, 2010) and a number of previous studies such as those reported by Ellobody and Young (2005) and Lecce and Rasmussen (2006).
2.4.3
Analysis technique
There are several factors that influence the behaviour of thin-walled structures such as the material nonlinearity, geometric nonlinearity and the interaction thereof.
CHAPTER 2 – LITERATURE REVIEW
45 Therefore, in all the numerical analyses conducted in the present study, the modified Riks method (Hibbitt et al., 2010) has been adopted, an algorithm that enables effective solutions to be found to unstable problems (e.g., post ultimate response) and adequately traces nonlinear unloading paths.
2.4.4
Material modelling
Numerous material models have been applied to represent the nonlinear stress-strain relationship of stainless steel, with the first stress-strain relationship being described by the Ramberg-Osgood model (Ramberg and Osgood, 1943) as modified by Hill (1944). This model was further enhanced by Mirambell and Real (2000) based on the two-stage Ramberg-Osgood model and further developed by Rasmussen (2003), Gardner and Nethercot (2004a), Gardner and Ashraf (2006) and Abdella (2007). Furthermore, a three-stage full range stress-strain model for stainless steel used in modelling applications involving forming processes has been proposed by Quach et al. (2008). In the present study, the two-stage Ramberg-Osgood model described by Gardner and Ashraf (2006) was employed to represent the stress-strain response of stainless steel, defined by Equations (2.1) and (2.2).
(2.1) σ σ for σ σ 0.002 E σ ε 0.2 n 0.2 0
(2.2) ε σ σ σ σ E σ σ ε ε E σ σ ε t2.0 n 0.2 1.0 0.2 0.2 0.2 t2.0 t1.0 0.2 0.2 ' 0.2,1.0 where E and E0.2 are the Young’s modulus and the tangent modulus at 0.2% offset strain, respectively, σ0.2 and σ1.0 are the proof stresses at 0.2% and 1% offset strains, respectively, εt0.2 and εt1.0 are the total strains at σ0.2 and σ1.0, respectively and n and n’0.2,1.0 are strain hardening exponents. It is worth nothing that these material parameters for the compound Ramberg-Osgood model are determined experimentally. A typical comparison between the measured stress-strain diagram of lean duplex stainless steel (further discussed in Chapter 3) and the two-stage Ramberg-Osgood
46 model as modified by Gardner and Ashraf (2006) is presented in Figure 2.1 in which a good agreement between the two curves can be observed.
Figure 2.1:Typical comparison between test and Ramberg-Osgood stress-strain curves
For incorporation into ABAQUS (Hibbitt et al., 2010), the material model has to be approximated with a multi-linear model defined in terms of true stress and log plastic strain. The relationship between true stress and engineering stress, σtrue and σnom, respectively, is given by Equation (2.3), while the relationship between log plastic strain and engineering strain, plln and εnom, respectively is given by Equation (2.4), where σnom and εnom are the engineering stress and strain respectively and E is the Young’s modulus. A typical example of this conversion is presented in Figure 2.2.
) 1 ( nom nom true (2.3) E ) 1 ln( true nom pl ln (2.4) 0 100 200 300 400 500 600 700 0 0.01 0.02 0.03 0.04 0.05 0.06 Stress (N/m m 2 ) Strain (mm/mm) Test Ramberg-Osgood
CHAPTER 2 – LITERATURE REVIEW
47
Figure 2.2: Typicalconversion of engineering stress-strain to true stress-strain
2.4.5
Geometric imperfections
All structural elements contain initial geometric imperfections, which arise principally during production, fabrication and handling. These imperfections can significantly influence the structural behaviour; hence, it is necessary to account for imperfections in any numerical modelling investigation. This is commonly achieved by first performing a linear eigenvalue buckling analysis to determine the lowest relevant elastic buckling mode - the shape into which a perfect structure would buckle, and subsequently incorporating the obtained shape as the geometric imperfection, with a chosen amplitude, in the nonlinear analysis; this was the approach adopted in the present study. Since buckling mode shapes provide a perturbation pattern only, the incorporation of imperfection amplitude is compulsory. Imperfection amplitudes can be derived from laboratory measurements (outlined in Chapter 3), or predictive models such as the Dawson and Walker model (1972) or its variations (Gardner and Nethercot, 2004b; Cruise and Gardner, 2006). It is worth noting that owing to the absence of global (member) buckling in the investigations carried out in this thesis, only local geometric imperfections were incorporated in the FE models.
0 200 400 600 800 1000 1200 0 0.05 0.1 0.15 0.2 0.25 0.3 0.35 0.4 0.45 0.5 Stre ss (N/m m 2) Strain (mm/mm) Engineering stress-strain True stress-strain
48
2.4.6
Residual stresses
Residual stresses are those that exist within a structural member in its unloaded state. Similarly to initial geometric imperfections, they originate primarily during production and fabrication processes. The general influence of residual stresses on structural members is to cause premature yielding and loss of stiffness, which can significantly deteriorate load carrying capacity. The physical and thermal properties of stainless steel differ from those of carbon steel, hence residual stress patterns and magnitudes arising in structural sections may differ (Gardner and Ng, 2006). A number of studies have involved the examination of residual stresses in cold-formed stainless steel sections (Gardner and Cruise, 2009; Clarin, 2003; Quach et al., 2004; Young and Lui, 2005; Jandera et al., 2008; Schafer et al., 2010) whilst fewer have addressed welded stainless steel sections (Bredenkamp et al., 1992; Lagerqvist and Olsson, 2001). The latter studies focused on welded I-sections, where the residual stresses in austenitic, ferritic, and duplex stainless steels were examined. For welded I-sections, only membrane residual stresses are generally significant and through-thickness bending residual stresses can be typically ignored (Gardner and Cruise, 2009). The residual stress model adopted in the present study is the one proposed by Gardner and Cruise (2009) developed based on the results of the studies by Bredenkamp et al. (1992) and Lagerqvist and Olsson (2001). A description of the implementation of residual stresses in the FE models and their effect on the results is presented in Chapter 3.
2.5
DISCUSSION
The aim of this chapter has been to provide a general summary of the development of structural stainless steel design guidance, the available structural performance data on stainless steel welded I-sections and numerical modelling. Further literature review is to be introduced and examined in more detail within the relevant chapters.
The use of stainless steel in construction has been growing steadily for many years. However, the high cost of stainless steel remains one of the major constraints to more