Panel data analysis of the factors for determining inbound tourism in Japan
12
0
0
Full text
(2) Panel data analysis of the factors for determining inbound tourism in Japan∗ Tomoya Mori §,Masahiro Yabuta §§. Abstract The demand for inbound tourism in Japan has been increasing since 2013. In 2015, the number of inbound tourists reached approximately 20 million. The Japanese government is making various efforts to increase the number of foreign visitors and has set a target of approximately 40 million inbound tourists to be reached by 2020. The aim of this paper is to demonstrate empirically the demand for inbound tourism in Japan by using the gravity model with panel data. According to demand theory, the income factor, as well as the relative prices in origin countries, influence the demand for inbound tourism. Focusing on a visa-permission tourism policy, the paper clarifies that not only income and relative price effects but also travel policy will have a significant effect on increasing inbound tourism in Japan.. Keywords: inbound tourism, demand theory, visa-permission policy, panel data, gravity model. JEL Classification Code: z32, z38. The authors highly appreciate the financial supports from the MEXT-support Program for the Strategic Foundation at Private Universities 2013-2017, Joint Research Grant of Chuo University, and the Grants-in-Aids for Scientific Research(C) (No.17K02127, 2017-2019). § Lecturer, Faculty of Education, Yamaguchi University,1677-1,Yoshida,Yamaguchi, 753-8513, moritomo@yamaguchi-u.ac.jp §§Professor,Faculty of Economics, Chuo University, 742-1,Higashinakano, Hachioji, Tokyo,192-0393, yabuta@tamacc.chuo-u.ac.jp ∗. 1.
(3) 1. Introduction 1-1. Research Background The number of inbound tourists in Japan has been increasing since 2013, despite the “Great East Japan Earthquake” of 2011, while the domestic tourism market in Japan has not noticeably expanded. According to the Japan National Tourism Organization (JNTO), the number of inbound tourists reached approximately 20 million in 2015 and exceeded the number of outbound tourists for the first time in 45 years. In this regard, the Japanese government has introduced several policies to promote inbound tourism. For example, the Japanese government’s Cabinet indicated that the demand for inbound tourism was one of the challenges in the “Basic Policy about Economic and Fiscal Management and Structural Reform 2002” and established the headquarters of the “Visit Japan Campaign” in 2003. The Japanese government has set a target of 40 million inbound tourists to be reached by 2020. The aim of this paper is to understand the demand trends for inbound tourism and demonstrate empirically the factors that influence demand. It is expected that the number of inbound tourists will continuously increase as part of the tourism strategy set by the government in the “Tourism-based Country Promotion Basic Act” enforced in 2007. In this context, it is important to clarify the factors that influence inbound tourism in Japan in order to consider the future of Japan as a tourism-based country. According to the Japan Tourism Agency (2016), “an inbound international visitor refers to foreign travelers entering Japan. This group consists of foreign nationals legally entering Japan minus foreign nationals who are residents of Japan (both [of which are] according to the nationality-based statistics [issued] by the Ministry of Justice), plus those in transit.” 1 The visitors based on this definition include those who visit for purposes other than simply travel, such as business, cultural and artistic activities, and visits to relatives. In order to focus only on the trend of traveling to Japan, this paper considers just international visitors in accordance with the nationalitybased statistics of the Ministry of Justice in terms of the definition of an “inbound” tourist. Figure 1 shows that the number of inbound tourists decreased in 2011, the year of the Great East Japanese Earthquake; however, the number has been increasing since 2013. Prior studies indicate that this growth is related to the quantitative and qualitative monetary easing by Japan’s central bank. As can be seen in Figure 2, the exchange rate of the Japanese currency, the yen, against the U.S. dollar has continued to be weak since 1. Refers to HP in the Japan Travel Agency http://www.mlit.go.jp/kankocho/en/siryou/toukei/in_out.html (accessed June 16, 2016). 2.
(4) 2013. Such currency depreciation makes the cost of travel cheaper in the destination country and thus encourages an increase in inbound tourism. Figure 1:The numbers of inbound tourists 2,500 1,973. Number(ten million). 2,000. 1,500. 1,341 1,036. 1,000 673. 733. 835. 861 679. 836 622. 500. 0. 2006. 2007. 2008. 2009. 2010. 2011. 2012. 2013. 2014. 2015. Source: Author’s own construction based on the statistical data of the Ministry of Justice. Figure 2: The exchange rate of the yen against the U.S. dollar 130.0 120.0 110.0 100.0 90.0. 116.3. 121.0. 117.8 105.9. 103.4 93.6. 97.6 87.8 79.8. 79.8. 80.0 70.0 60.0. 2006 2007 2008 2009 2010 2011 2012 2013 2014 2015. Source: Author’s own construction based on the statistical data of the World Bank. Based on demand theory, tourism economics focus on the elements of price and income as factors that promote demand. Additionally, economic growth in source and destination countries is considered an income factor that promotes demand. Further, tourism policy can encourage inbound tourism to increase. Such policy includes various strategies. This study adopts visa permission as the variable of tourism policy. Visa permission has various kinds of deregulation (the easing of a primary visa, a multiple-entry visa, and a visa waiver). This study considers a visa waiver as visa permission. However, from 2015 we also include the part-easing of a visa restriction regarding China as visa permission because China has a market share of Japanese. 3.
(5) inbound tourism. 2 1-2. Literature Review The Mizuho Research Institute Ltd. (2016) empirically analyzes the demand for inbound tourism based on an econometric methodology. This work attempts to analyze 15 countries (South Korea, China, Taiwan, Hong Kong, Thailand, Singapore, Malaysia, Indonesia, the Philippines, the United Kingdom, France, Germany, the United States, Canada, and Australia) using time-series data from the first quarter of 1995 to the fourth quarter of 2015. The result of this study has shown that the trend of a low yen against the U.S. dollar increases inbound tourism in newly industrialized countries (NICs). Moreover, with regard to Southeast Asia, economic growth is a factor of inbound tourism in Japan. Additionally, inbound tourism from China is not a strong response to the exchange rate; instead, the income factor significantly influences demand. Further, this study has concluded that visa permission has a positive effect on inbound tourism. However, the Mizuho Research Institute Ltd. (2016) cannot consider the total of inbound tourism in Japan because of the nature of the time-series data analysis. In order to achieve a comprehensive analysis, we need to analyze panel data in which crosssectional data is added to time-series data. One typical methodology that is used to analyze international tourism with panel data is the gravity model. According to Morley, Rossello, and Santana-Gallego (2014), the gravity model assumes that “bilateral flows between two countries are directly proportional to the countries’ economic masses and inversely proportional to the distance between them.” Empirical studies using the gravity model adopt real gross domestic product (GDP) or real GDP per capita as the countries’ economic masses. The distance between two countries is regarded as a kind of travel cost. In addition, expenditure at the destination is an important factor for determining the demand for inbound tourism. Normally, in the gravity model, expenditure is calculated with the exchange rate and the relative ratio of prices between a destination country and an origin country. The other variables are population and specific events such as festivals, disasters, and political disturbances. Based on the foregoing, this study attempts to estimate demand for inbound tourism 2. The Japanese government has eased the range of multiple-entry visas since 2015 as follows: (1) multiple-entry visas for short-term business purposes and for cultural and intellectual figures; (2) multiple-entry visas for individual tourists visiting Okinawa or one of three prefectures in Tohoku; and (3) multiple-entry visas for individuals with substantially high incomes (refers to HP in the Japanese Ministry of Foreign Affairs: http://www.mofa.go.jp/press/release/press4e_000576.html (accessed March 30, 2017)). 4.
(6) in Japan using the gravity model with panel data. We use visa permission as the policy variable together with price and income. 2. Methods and Data This research estimates an expression of a linear logarithmic model (1) based on the prior section. (1) 𝑇𝑇𝑇𝑇𝑇𝑇𝑇𝑇𝑖𝑖𝑖𝑖 = 𝛽𝛽0 + 𝛽𝛽1 ln 𝑌𝑌𝑖𝑖𝑖𝑖 + 𝛽𝛽2 ln 𝑌𝑌𝑗𝑗𝑗𝑗 + 𝛽𝛽3 ln 𝑅𝑅𝑅𝑅𝑖𝑖𝑖𝑖 + 𝛽𝛽4 ln 𝑃𝑃𝑃𝑃𝑃𝑃𝑖𝑖𝑖𝑖 + 𝛽𝛽5 ln 𝑃𝑃𝑃𝑃𝑃𝑃𝑗𝑗𝑗𝑗. + 𝛽𝛽6 (𝑉𝑉𝑉𝑉𝑉𝑉𝑉𝑉- 𝑝𝑝𝑝𝑝𝑝𝑝𝑝𝑝𝑝𝑝𝑝𝑝𝑝𝑝𝑝𝑝𝑝𝑝𝑝𝑝 𝑐𝑐𝑐𝑐𝑐𝑐𝑐𝑐𝑐𝑐𝑐𝑐𝑖𝑖 × 𝐴𝐴𝐴𝐴𝐴𝐴𝐴𝐴𝐴𝐴𝑡𝑡 ) + 𝛽𝛽7 𝑉𝑉𝑉𝑉𝑉𝑉𝑉𝑉𝑖𝑖 + 𝛽𝛽8 𝐴𝐴𝐴𝐴𝐴𝐴𝐴𝐴𝐴𝐴𝑡𝑡 + 𝛽𝛽7 𝑦𝑦𝑦𝑦𝑡𝑡 + 𝜇𝜇𝑖𝑖 + 𝜀𝜀𝑖𝑖𝑖𝑖. In the above model, the subscript 𝑖𝑖 is the origin country and 𝑗𝑗 is the destination (Japan). 𝑇𝑇𝑇𝑇𝑇𝑇𝑇𝑇𝑖𝑖𝑖𝑖 is the number of tourists and refers to the variable of tourism demand. 𝑌𝑌𝑖𝑖𝑖𝑖 and 𝑌𝑌𝑗𝑗𝑗𝑗 respectively are the income factors in the origin country and in the destination country. This paper adopts real GDP per capita as the proxy variable.. Income factors in both countries have positive effects on tourism demand. 𝑅𝑅𝑅𝑅𝑖𝑖𝑖𝑖 is the relative price, which means expenditure in the destination country relative to expenditure in the origin country. Relative price is represented as follows (2).. (2) 𝑅𝑅𝑅𝑅𝑖𝑖𝑖𝑖 =. 𝐶𝐶𝐶𝐶𝐶𝐶𝑖𝑖 �𝐸𝐸𝐸𝐸 � 𝑖𝑖 𝐶𝐶𝐶𝐶𝐶𝐶𝑗𝑗 � �𝐸𝐸𝐸𝐸 � �. 𝑗𝑗. 𝐶𝐶𝐶𝐶𝐶𝐶𝑖𝑖 𝐸𝐸𝐸𝐸 =� �𝐶𝐶𝐶𝐶𝐶𝐶 � / � 𝑖𝑖�𝐸𝐸𝐸𝐸 � 𝑗𝑗. 𝑗𝑗. 𝐶𝐶𝐶𝐶𝐶𝐶𝑖𝑖 and 𝐶𝐶𝐶𝐶𝐶𝐶𝑗𝑗 respectively are the consumer price indexes in the origin country, 𝑖𝑖, and the destination country (Japan). 𝐸𝐸𝐸𝐸𝑖𝑖 and 𝐸𝐸𝐸𝐸𝑗𝑗 respectively are the exchange rates. of the domestic currencies in 𝑖𝑖 and 𝑗𝑗 in terms of the U.S. dollar. The relative price has a negative influence on inbound tourism demand. 𝑃𝑃𝑃𝑃𝑃𝑃𝑖𝑖𝑖𝑖 and 𝑃𝑃𝑃𝑃𝑃𝑃𝑗𝑗𝑗𝑗 each represent the. populations in i and j. Culiuc (2014) concludes that the populations in the origin and the destination countries have a negative effect on inbound tourism demand. However, some research finds that population encourages an increase in the number of international tourists (e.g., Hanafiash and Harun 2010; Massidda and Etzo 2012; and so on). 𝑉𝑉𝑉𝑉𝑉𝑉𝑉𝑉- 𝑝𝑝𝑝𝑝𝑝𝑝𝑝𝑝𝑝𝑝𝑝𝑝𝑝𝑝𝑝𝑝𝑝𝑝𝑝𝑝 𝑐𝑐𝑐𝑐𝑐𝑐𝑐𝑐𝑐𝑐𝑐𝑐𝑖𝑖 is the dummy variable, which is 1 if visa restrictions are eased and 0 otherwise. 𝐴𝐴𝐴𝐴𝐴𝐴𝐴𝐴𝐴𝐴𝑡𝑡 is the time dummy variable, which is 1 after visa restrictions are eased and 0 before they are eased. The cross term 𝑉𝑉𝑉𝑉𝑉𝑉𝑉𝑉- 𝑝𝑝𝑝𝑝𝑝𝑝𝑝𝑝𝑝𝑝𝑝𝑝𝑝𝑝𝑝𝑝𝑝𝑝𝑝𝑝 𝑐𝑐𝑐𝑐𝑐𝑐𝑐𝑐𝑐𝑐𝑐𝑐𝑖𝑖 × 𝐴𝐴𝐴𝐴𝐴𝐴𝐴𝐴𝐴𝐴𝑡𝑡 is the difference between a country that eases 5.
(7) visa restrictions and countries that do not ease visa restrictions after a year of visa permission. Thus, the coefficient 𝛽𝛽4 refers to the effect of visa permission. 𝜇𝜇𝑖𝑖 refers to a specific fixed country and the time-invariant effect, such as the distance between two. countries. This investigation attempts to remove 𝜇𝜇𝑖𝑖 using a fixed-effect model. 𝑦𝑦𝑦𝑦𝑡𝑡 is the time dummy that indicates political disturbance or disaster. This estimation uses the. time dummy to represent the Great East Japan Earthquake. 𝜀𝜀𝑖𝑖𝑖𝑖 is the error term. This paper sets a target for 190 countries as the cross-sectional data (see Table 1) and the 10 years from 2006 to 2015 as the time-series data. Table 2 shows the source of the data, and Table 3 presents the basic statistics. We try to estimate the inbound demand model using unbalance panel data because parts of the data are missing. Table 4 shows the visa-permission schedule in Japan since 2006. The Japanese government has eased visa restrictions for Indonesia since December 2014; thus, this paper assumes that visa restrictions for Indonesia eased in 2015. Table 1: A list of countries’ cross-sectional data Asia (39 countries). Afghanistan, Bahrain, Bangladesh, Bhutan, Brunei Darussalam, Cambodia, China, Cyprus, Hong Kong, India, Indonesia, Iran, Iraq, Islamic Rep., Israel, Jordan, Korea, Rep. Kuwait, Lao PDR, Lebanon, Malaysia, Maldives, Mongolia, Myanmar, Nepal, Oman, Pakistan, Philippines, Qatar, Saudi Arabia, Singapore, Sri Lanka, Syrian Arab Republic, Taiwan, Thailand, Timor-Leste, Turkey, United Arab Emirates, Vietnam, Yemen Rep. Europe (50 countries) Albania, Andorra, Armenia, Austria, Azerbaijan, Belarus, Belgium, Bosnia and Herzegovina, Bulgaria, Croatia, Czech Republic, Denmark, Estonia, Finland, France, Georgia, Germany, Greece, Hungary, Iceland, Ireland, Italy, Kazakhstan, Kosovo, Kyrgyz Republic, Latvia, Liechtenstein, Lithuania, Luxembourg, Macedonia FYR, Malta, Moldova, Monaco, Netherlands, Norway, Poland, Portugal, Romania, Russian Federation, San Marino, Slovak Republic, Slovenia, Spain, Sweden, Switzerland, Tajikistan, Turkmenistan, United Kingdom, Ukraine, Uzbekistan Africa (53 countries) Algeria, Angola, Arab Rep., Benin, Botswana, Burkina Faso, Burundi, Cabo Verde, Cameroon, Central African Republic, Chad, Comoros, Congo Dem. Rep., Congo Rep., Côte d'Ivoire, Djibouti, Egypt, Ethiopia, Equatorial Guinea, Eritrea, Gabon, Gambia, Ghana, Guinea, Guinea-Bissau, Kenya, Lesotho, Liberia, Libya, Madagascar, Malawi, Mali, Mauritania, Mauritius, Morocco, Mozambique, Namibia, Niger, Nigeria, Rwanda, Sao Tome and Principe, Senegal, Seychelles, Sierra Leone, South Africa, South Sudan, Sudan, Swaziland, Tanzania, Togo, Tunisia, Uganda, Zambia, Zimbabwe North America (22 countries) Antigua and Barbuda, Bahamas, Barbados, Belize, Canada, Costa Rica, Dominica, Dominican Republic, El. 6.
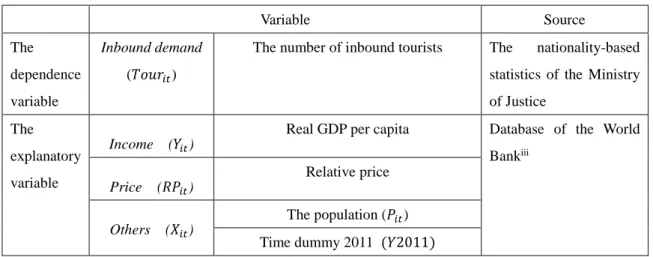
(8) Salvador, Grenada, Guatemala, Haiti, Honduras, Jamaica, Mexico, Nicaragua, Panama, St. Kitts and Nevis, St. Lucia, St. Vincent and the Grenadines, Trinidad and Tobago, United States South America (12 countries) Argentina, Bolivia, Brazil, Chile, Colombia, Ecuador, Guyana, Paraguay, Peru, Suriname, Uruguay, Venezuela Oceania (14 countries) Australia, Fiji, Kiribati, Marshall Islands, Micronesia Fed. Sts., Nauru, New Zealand, Palau, Papua New Guinea, Samoa, Solomon Islands, Tonga, Tuvalu, Vanuatu. Table 2: Information about each variable Variable The. Inbound demand. dependence variable. Source. The number of inbound tourists. The. statistics of the Ministry. (𝑇𝑇𝑇𝑇𝑇𝑇𝑇𝑇𝑖𝑖𝑖𝑖 ). of Justice. The. Real GDP per capita. explanatory variable. Income. (𝑌𝑌𝑖𝑖𝑖𝑖 ). Price. (𝑅𝑅𝑅𝑅𝑖𝑖𝑖𝑖 ). Others. (𝑋𝑋𝑖𝑖𝑖𝑖 ). nationality-based. Database of the World Bankiii. Relative price The population (𝑃𝑃𝑖𝑖𝑖𝑖 ). Time dummy 2011 (𝑌𝑌2011). Table 3: Basic statistics Frequency. Min.. Max.. Average. S.E.. 𝑇𝑇𝑇𝑇𝑇𝑇𝑇𝑇𝑖𝑖𝑖𝑖. 1,862. 1. 3,367,616. 34,724.637. 214,608.8272. 𝑌𝑌𝑖𝑖𝑖𝑖. 1,807. 208.650. 145,221.192. 12746.806. 433.608. 𝑌𝑌𝑗𝑗𝑗𝑗. 1,899. 41,010.788. 44,656.832. 43,407. 1,006.847. 𝑃𝑃𝑃𝑃𝑃𝑃𝑖𝑖𝑖𝑖. 1,886. 9,732. 1,371,220,000. 35810453.661. 136,601,189.534. 𝑃𝑃𝑃𝑃𝑃𝑃𝑗𝑗𝑗𝑗. 1,900. 219,956. 128,070,000. 127,617,090.087. 2,950,407.149. 𝑅𝑅𝑅𝑅𝑖𝑖𝑖𝑖𝑖𝑖. 1,709. 0.479. 7.452. 1.033. 0.271. 𝐴𝐴𝐴𝐴𝐴𝐴𝐴𝐴𝐴𝐴2013. 1,900. 0. 1. 0.300. 0.458. 𝐴𝐴𝐴𝐴𝐴𝐴𝐴𝐴𝐴𝐴2015. 1,900. 0. 1. 0.100. 0,300. 𝑦𝑦𝑦𝑦2011. 1,900. 0. 1. 0.100. 0.300. Table 4: The list of visa permissions Year. Content. 7.
(9) Sep. 2013. Visa permission for Thailand and Malaysia. Dec. 2014. Visa permission for Indonesia under a preregistration system. Jan. 2015. Part easing of the visa restriction in China. 3. Results and Analysis Table 5 shows the results of the estimation. The results of the Wu–Hausman test statistically support the use of the fixed-effect model and not a random-effect model. Thus, we can remove the effect from the fixed-effect term. According to the estimation results, it is statistically significant in all models that the income in the origin countries has a positive effect on inbound tourism demand. However, the income in Japan does not significantly influence such demand. Although real GDP per capita in Japan has not increased significantly in recent times, the demand for inbound tourism has tended to increase. Thus, income in Japan is not statistically correlated with inbound tourism demand. Table 5: The panel analysis results Model 1. Model 2. Model 3. Model 4. 𝐶𝐶. -28.294*** (9.372). -22.933** (9.485). -28.147*** (9.368). -22.956** (9.478). 𝑌𝑌𝑖𝑖𝑖𝑖. 0.747*** (0.268). 0.656*** (0.234). 0.749*** (0.268). 0.655*** (0.234). 𝑌𝑌𝑗𝑗𝑗𝑗. 0.792 (0.743). 0.528 (0.753). 0.796 (0.743). 0.527 (0.756). 𝑃𝑃𝑃𝑃𝑃𝑃𝑖𝑖𝑖𝑖. 1.371*** (0.391). 1.241*** (0.381). 1.359*** (0.396). 1.243*** (0.385). -0.153*** (0.006). -0.149*** (0.006). -0.061*** (0.006). -0.149*** (0.006). -0.053*** (0.020). -0.040** (0.016). -0.061*** (0.023). -0.038*** (0.016)s. 𝑃𝑃𝑃𝑃𝑃𝑃𝑗𝑗𝑗𝑗 𝑅𝑅𝑅𝑅𝑖𝑖𝑖𝑖𝑖𝑖. 𝑅𝑅𝑅𝑅𝑖𝑖𝑖𝑖𝑖𝑖 × 𝐴𝐴𝐴𝐴𝐴𝐴𝐴𝐴. 𝑅𝑅𝑅𝑅𝑖𝑖𝑖𝑖𝑖𝑖 × 𝐸𝐸𝐸𝐸𝐸𝐸𝐸𝐸𝐸𝐸𝐸𝐸. -1.119*** (0.248). -1.121*** (0.249) 0.037 (0.047). -0.008 (0.047). 𝑇𝑇ℎ𝑎𝑎𝑎𝑎𝑎𝑎𝑎𝑎𝑎𝑎𝑎𝑎. 0.916*** (0.045). 0.708*** (0.067). 0.913*** (0.046). 0.708*** (0.067). 𝑀𝑀𝑀𝑀𝑀𝑀𝑀𝑀𝑀𝑀𝑀𝑀𝑀𝑀𝑀𝑀. 0.491*** (0.046). 0.354*** (0.055). 0.490*** (0.046). 0.354*** (0.055). 𝐼𝐼𝐼𝐼𝐼𝐼𝐼𝐼𝐼𝐼𝐼𝐼𝐼𝐼𝐼𝐼𝐼𝐼. 0.424*** (0.057). 0.328*** (0.058). 0.423*** (0.057). 0.328*** (0.058). 𝐶𝐶ℎ𝑖𝑖𝑖𝑖𝑖𝑖. 0.744*** (0.058). 0.417*** (0.098). 0.741*** (0.059). 0.417*** (0.098). 0.270*** (0.037). 0.246*** (0.038). 0.271*** (0.038). 0.246*** (0.038). × 𝐴𝐴𝐴𝐴𝐴𝐴𝐴𝐴𝐴𝐴2013 × 𝐴𝐴𝐴𝐴𝐴𝐴𝐴𝐴𝐴𝐴2013 × 𝐴𝐴𝐴𝐴𝐴𝐴𝐴𝐴𝐴𝐴2015 × 𝐴𝐴𝐴𝐴𝐴𝐴𝐴𝐴𝐴𝐴2015 𝐴𝐴𝐴𝐴𝐴𝐴𝐴𝐴𝐴𝐴2013. 8.
(10) 𝐴𝐴𝐴𝐴𝐴𝐴𝐴𝐴𝐴𝐴2015. 0.344*** (0.039). 0.318*** (0.039). 0.343*** (0.039). 0.318*** (0.039). 𝑦𝑦𝑦𝑦2011. -0.480*** (0.039). -0.463*** (0.038). -0.480***(0.039). -0.463***(0.038). Obs.. 1,594. 1,594. 1,594. 1,594. Modified 𝑅𝑅2. 0.985. 0.985. 0.985. 0.985. Notes: ** denotes significance at 5%. *** denotes significance at 1%. The numbers in parentheses are robust standard errors.. The population in an origin country positively influences inbound tourism demand. The interpretation of this result is that there is a positive coefficient because population growth increases the potential number of tourists coming to Japan. However, the population in a destination country has a negative effect on inbound tourism. In the case of Japan, this is because the Japanese government and travel companies have placed resources in the inbound tourism market at the expense of international tourism demand because demand in the domestic tourism market has been sluggish. The results show that the coefficient of relative price is negative but low. Thus, relative price does not greatly affect inbound tourism demand. However, the cross term with the Asian countries’ dummy and relative price demonstrates that the influence of this cross term is greater compared with other countries. However, the cross term with the European countries’ dummy and relative price is not statistically significant. This means that no difference exists between European countries and other countries regarding relative price. The coefficients of 𝑇𝑇ℎ𝑎𝑎𝑎𝑎𝑎𝑎𝑎𝑎𝑎𝑎𝑎𝑎 × 𝐴𝐴𝐴𝐴𝐴𝐴𝐴𝐴𝐴𝐴2013 , 𝑀𝑀𝑀𝑀𝑀𝑀𝑀𝑀𝑀𝑀𝑀𝑀𝑀𝑀𝑀𝑀 × 𝐴𝐴𝐴𝐴𝐴𝐴𝐴𝐴𝐴𝐴2013 , 𝐼𝐼𝐼𝐼𝐼𝐼𝐼𝐼𝐼𝐼𝐼𝐼𝐼𝐼𝐼𝐼𝐼𝐼 × 𝐴𝐴𝐴𝐴𝐴𝐴𝐴𝐴𝐴𝐴2014 and 𝐶𝐶ℎ𝑖𝑖𝑖𝑖𝑖𝑖 × 𝐴𝐴𝐴𝐴𝐴𝐴𝐴𝐴𝐴𝐴2015 are statistically significant and positive. This finding suggests that the number of inbound tourists is increasing to a greater extent in those countries for which visa permission has been eased compared with those countries for which visa permission has not been eased. Further, the result of the Great East Japan Earthquake demonstrates that inbound tourism demand decreased by 46.3%–48.0% compared with other years. 4. Conclusion This study analyzes inbound tourism demand in Japan using the gravity model with panel data (annual data from 2006 to 2015 for 190 countries). This study’s estimation clarifies that inbound tourism demand is statistically related to the factors of income, price, and tourism policy. The results indicate that income growth in origin countries increases inbound tourism demand in Japan. Moreover, the effect of the relative price variable on such demand is 9.
(11) statistically significant, although the coefficient is low. However, a difference exists between Asian countries and others. The trend of a low yen and high U.S. dollar following the quantitative and qualitative monetary policy in Japan positively influences the value of the relative price. Further, the relative price may experience unstable changes because of trends in the global economy. If the exchange rate of the yen against the U.S. dollar is high, inbound demand may decrease. In order to achieve the goal of 40 million inbound tourists by 2020, the Japanese government must keep the exchange rate stable. Further, this research demonstrates that tourists from Thailand, Malaysia, Indonesia, and China are increasing to a greater extent than those from other countries after the easing of visa restrictions. It is difficult to ease visa restrictions from the national security perspective; however, in order to increase the number of inbound tourists, it is desirable that the Japanese government should relax the visa restrictions for countries where such restrictions have not currently been eased. In the future, we should address a further three points. First, we should use the number of international tourists as the proxy variable of inbound tourism demand. We should also pay attention to the amount of expenditure by foreign tourists as well as their numbers. Consequently, we need to make an estimation by employing the amount of expenditure as a proxy variable. Because the pattern of expenditure differs between each country, such an analysis may introduce another perspective to the study of inbound tourism demand in Japan. Second, this research analyzes all inbound tourists in Japan regardless of the airport entrance point. In reality, foreign tourists visit Japan by using many different routes and travel to various locations within Japan. An estimation of inbound tourism demand that considers each international airport entry point would enable us to understand the concrete structure of inbound tourism more comprehensively. Further, we could employ tourism policy or strategy as the variable. Finally, this study uses a static model with panel data. In a further step, we could develop a dynamic model such as the generalized method of moments (GMM) model of Arellano and Bond (1991). Because a dynamic panel model employs lag variables of the dependent variable, an estimation of a dynamic model can enable us to capture the “repeater” effect and the “word-of-mouth” effect. References Arellano, M., and S. Bond. 1991. “Some Tests of Specification for Panel Data: Monte Carlo Evidence and an Application to Employment Equations.” Review of Economic 10.
(12) Studies 58: 277–297. Culiuc, A. 2014. “Determinants of International Tourism.” IMF Working Paper, No. 82. Hanafiash, M. H., and M. F. Harun. 2010, “Tourism Demand in Malaysia: A Crosssectional Pool Time Series Analysis.” International Journal of Trade, Economics and Finance 1 (1): 80–83. Inbound Navi. 2015. https://inboundnavi.jp/2015-summary-stats (accessed November 9, 2016). International Monetary Fund. 2016. World Economic Outlook Database. https://www.imf.org/external/pubs/ft/weo/2016/01/weodata/index.aspx (accessed November 8, 2016). Japanese Tourism Agency. 2016. http://www.mlit.go.jp/kankocho/shisaku/kokusai/index.html (accessed November 6, 2016). Japan National Tourism Organization. http://www.jnto.go.jp/jpn/about_us/profile/index.html (accessed November 9, 2016).. Massidda, C., and I. Etzo, 2012. “The Determinants of Italian Domestic Tourism: A Panel Data Analysis.” Tourism Management 33: 603–610. Ministry of Justice. National Statistics. http://www.moj.go.jp/housei/toukei/toukei_ichiran_nyukan.html (accessed November 9, 2016). Mizuho Research Institute Ltd. 2016. “The Determinant of Inbound Demand: The More Effect NIEs Countries than China (in Japanese).” Mizuho Insight.http://www.mizuhori.co.jp/publication/research/pdf/insight/jp160219.pdf (accessed November 15, 2016). Morley, C., J. Rossello, and M. Santana-Gallego, 2014. “Gravity Models for Tourism Demand: Theory and Use.” Annals of Tourism Research 48: 1–10. Phakdisoth, L., and D. Kim. 2007. “The Determinants of Inbound Tourism in Laos.” ASEAN Economic Bulletin 24 (2): 225–237. Sinclair, M. T., and M. Stabler. 1997,. The Economics of Tourism. London: Routledge. World Bank Indicator. http://data.worldbank.org/indicator/all (accessed November 8, 2016).. 11.
(13)
Figure


Related documents
Request approval to 1) accept a grant award from, and enter into a grant agreement with, the American Psychological Association Board of Educational Affairs to pursue accreditation
The State of California, Department of Insurance (CDI) has awarded the District Attorney¶s Office (DA) $4,700,955 for the Automobile Insurance Fraud (AIF) Program, $2,121,829 for
Sales location, product type, number of advertising methods used, high-speed Internet connection, land tenure arrangement, and gross farm sales is found to be significantly related
A multiplexer is also called data selector , since is selects one of many inputs and steers the binary information to the output line.. The AND gates and inverters
Combining Properties and Evidence to Support Overall Confor- mance Claims: Safety-critical system development increasingly relies on using a diverse set of verification
If you’re a beer buff, take a guided tour at Deschutes Brewery to learn more about how the craft beer scene got its start in Central Oregon, then visit a few.. of the city’s
Communication apprehension in a first language and self-perceived competence as predictors of communica- tion apprehension in a second language: A study of speakers of English as
Having all your data in one place helps you make sense out of every interaction you’ve had with your contacts - be it through email, a landing page, social media, or otherwise -
