A STUDY ON THE SATISFACTION WITH
SERVICE-ORIENTED WEDDING CATERING PLANNING SYSTEM
HUNG-TENG CHANG
Department of Information Management, Yu Da University of Science and Technology, Taiwan, R.O.C E-mail: [email protected]
ABSTRACT
Due to the change of social atmosphere and the decreasing population, the wedding catering industry in Taiwan is facing increasingly fierce pressure of market competitiveness. Moreover, due to the increased popularity of information technology and the application of service-oriented architecture (SOA) information system to marketing and management procedures, the use of planning system has also become a strategy to attract young consumers and increase consumer willingness. This study selected a certain wedding catering industry operator in the northern Taiwan who commissioned the development of a wedding catering planning system as the research object, and selected the customers who actually used and completed consumer behavior as the subjects, in order to understand whether SOA-based wedding catering planning information system meets the needs of customers. Firstly, this study collected and arranged the studies concerning information system and customer satisfaction. Secondly, this study used the IS Success Model proposed by DeLone and McLean as the basis, took into account the applicability and purpose of this study and referred to the studies and questionnaires of relevant scholars to design the questionnaire of this study. Thirdly, this study distributed questionnaires via mail or interviews to assess the results and complete the arrangement of raw data. Lastly, this study performed statistical analyses on the data according to the research methods and hypotheses. The empirical results of this study are as follows: (1) the subjects’ overall actual assessment on the system met the expected level of this study. Therefore, the developed system was viewed as a successful set of planning system which could effectively meet consumer satisfaction and market needs; (2) system quality affects willingness to use and consumer satisfaction; (3) information system affects willingness to use and user satisfaction; (4) willingness to use and user satisfaction affects net benefits. The aforementioned findings and results can be provided as reference for wedding catering enterprises in Taiwan to introduce relevant systems.
Keywords: Service-Oriented Architecture, Is Success Model, Information Quality, System Quality, User Satisfaction
1. INTRODUCTION
The research motivation is to select the wedding catering information system of a certain chain restaurant in the northern Taiwan as the research object, in order to understand whether SOA-based wedding catering planning information system meets consumers’ needs. This study used the IS Success Model proposed by DeLone and McLean to design the Questionnaire on the Satisfaction with Information System [1], in order to understand whether two factors, information quality and system quality, have an effect on the willingness to use information system and user satisfaction, and whether the willingness to use and user satisfaction can further affect the net benefits of the overall information system. Based on the above, this study
intended to understand whether this SOA-based wedding catering planning information system is successful or its deficiencies, in order to provide suggestions on improvement, as well as to provide a reference model for wedding catering industry to meet the needs of market consumers and create new operating opportunity for wedding catering industry.
2. LITERATURE REVIEW
required components according to the procedures established by enterprises without giving consideration to IT technology as long as they meet the interface requirements, in order to facilitate enterprises’ rapid assembly and reuse and meet the needs of various operations [2-5].
DeLone and McLean arranged hundreds of papers as the basis to propose a model for classification and interaction – IS Success Model. The method for assessing IS success model proposed by the studies where information system effectiveness is used as a dependent variable includes six dimensions – system quality: system quality affects the condition of use of information system and user satisfaction. The use of information system and user satisfaction affects individuals and further affects an organization. Moreover, information quality and system quality affect the condition of use of system and user satisfaction. The conditions of use of system and user satisfaction affect each other and affect individuals to further affect an organization [6].
[image:2.595.307.515.492.626.2]In 2003, DeLone and McLean further proposed the amended IS success model, and used six dimensions, including information quality, system quality, service quality, willingness to use/use, user satisfaction and net benefits to assess whether the information software system is successful, further used the sum of positive and negative effects among condition of use of system, user satisfaction and net benefits of system to assess the effectiveness and eventually regarded system effectiveness as the indicator of success of information system. The associations among the dimensions are shown in Figure 1 [1].
Figure 1: Information System Success Model
Many researchers defined system quality as “assessment on system itself during information processing”. The most frequently used assessment indicators include: response time, reliability, ease of use, integrity, safety, system performance, universality, etc. [7-10].
The assessment on information system is defined
as whether information content can be accurately output [11-12]. Many scholars used their own assessment indicators. The most frequently used assessment indicators include: integrity, accuracy, ease of use, safety, timeliness, system operation capacity, information processing capacity, user friendliness, actual availability, etc. [13].
Huang suggested that service is a benefit or activity provided by an organization to a group. Service quality should possess the following four characteristics: (1) intangibility; (2) indivisibility; (3) versatility; (4) perishability [14]. Service is an intangible product, as well as an instant product provided for customers. It cannot be provided until it is needed. Therefore, service cannot be produced and stored in advance. The assessment indicators include: tangibility, reliability, responsiveness, assurance, empathy, etc. [15].
3. RESEARCH METHOD
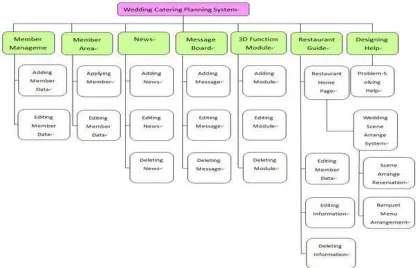
Figure 2 includes the forms of various functions of the wedding catering planning system. The wedding catering planning system was developed under the integrated development environment of Microsoft Visual Studio 2008. The SOA was used to integrate the two heterogeneous service systems developed, including the wedding venue planning system and banquet menu planning system. Moreover, Ajax Control Toolkit was also used. The built-in controls and extenders of this tool could be easily used to establish the webpages rich in AJAX functions for user end.
Figure 2: Wedding Catering Planning System Function Chart
[image:2.595.89.298.548.638.2]dimension of “service quality.” This study used questionnaire survey to investigate the sum of means of 5 major dimensions, including system quality, information quality, and willingness to use, user satisfaction and net benefits, in order to understand whether the wedding catering planning system met the expected level. This study proposed the designed architecture of the IS success model of wedding catering planning system as follows:
Figure 3: Wedding Catering Planning System Research Framework Chart
The research hypotheses were proposed at two phases according to the research framework: Phase 1 Proposing hypotheses for the overall system
[image:3.595.89.291.236.331.2]Method: This study selected 50 users, and used questionnaire survey to investigate whether the sum of means of 5 major dimensions, including system quality, information quality, willingness to use, user satisfaction and net benefits met the expected level. The total score of the sum of means of 5 major dimensions exceeding 75% represented that the system was successful.
Figure 4: Wedding Catering Planning System Satisfaction Hypothesis Chart
Phase 2 Proposing the hypotheses for the factors of the IS success model of the system:
[image:3.595.307.508.408.732.2]For the wedding catering planning system, the research hypotheses were proposed according to the literature review and the research framework, as show in Table 1:
Table 1: Research hypotheses
To enable the sample size of the system software used in the survey to reach the maximum value, this study selected the customers who had registered and used the wedding catering planning system of the chain restaurant membership and completed the participation in the wedding as the subjects. The questionnaires were distributed and completed via mail or interviews.
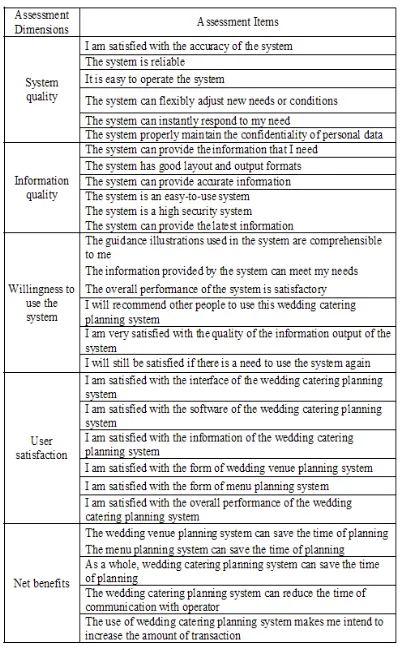
The measurement items of various constructs in the 5 major dimensions of the questionnaire of this study are shown in Table 2:
[image:3.595.86.291.518.625.2]4. RESULTS AND DISCUSSION
This study distributed 125 questionnaires, and 91 questionnaires were returned. There were 78 valid questionnaires, the return rate was 72.5% and the valid return rate was 85.7%4. The analysis results of the subjects are as follows:
4.1 Reliability and validity analysis
(1) Reliability analysis
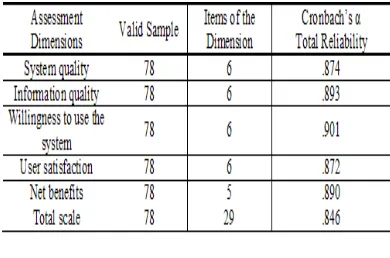
[image:4.595.93.288.298.427.2]Cronbach’s α of various dimensions was greater than 0.8, suggested that the reliability was good [12], as shown in Table 13:
Table 3: Analysis on the Reliability of the Questionnaire
(2) Validity analysis
Various items of each dimension were developed according to relevant studies and theories, and they were revised according to the characteristics and needs of the system to develop the research questionnaire. Therefore, the content validity should be acceptable.
4.2 Descriptive Statistics
(1) Gender: 34.9% of the subjects were male, and 65.1% of them were female, suggesting that the proportion of female users of this system was higher than that of male ones.
(2) Level of education: most of the subjects were college graduates (52.52%), followed by masters (28.62%), junior college graduates (11.02%) and vocational senior high schools ad under (5.96%).
(3) Age: most of the subjects were at the age of 26-30 (42.41%), followed by those at the age of 31-35 (34.95%), and those at the age of 36-40 (14.49%) and those at the age of 21-25 (8.15%). There was not subjects aged 40 and above.
(4) Wedding banquet budget: the wedding banquet budget of most of the subjects was >
NTD 150,000 and < NTD 300,000 (54.30%), followed by < NTD 150,000 (21.85%), > NTD 300,000 and < NTD 450,000 (19.90%) and > NTD 450,000 and < NTD 600,000 (3.94%). There was no subjects whose wedding banquet budget was > NTD 600,000.
Actual amount of consumption of the wedding banquet: the actual amount of consumption of most of the subjects was > NTD 150,000 and < NTD 300,000 (36.16%), followed by > NTD 300,000 and < NTD 450,000 (27.29%), < NTD 150,000 (12.26%), > NTD 450,000 and < NTD 600,000 (12.32%) and > NTD 600,000 (3.87%). Compared with (4), the proportion of subjects who spent > NTD 150,000 and < NTD 300,000 decreased, that of those who spent > NTD 300,000 and < NTD 450,000 and > NTD 450,000 and < NTD 600,000 increased. There was originally no subject whose budge was > NTD 600,000, suggesting that there was a gap between budget and actual consumption.
4.3 Condition of items in each assessment dimension
(1) Analysis on the items of the dimension of system quality: the average score was 3.75-4.28. The average score of “The system can deal with a wide range of conditions (multiple functions)” and “The system operation is stable” was lower (3.75), while that of other items showed that customers gave positive feedback to the system quality.
(2) Analysis on the items of the dimension of information quality: the average score was 3.96-4.40. The average score of “The information provided by the system meets my personal need” was 3.96, which was lower than 4. The reason might be that the current information on wedding banquet changed constantly, and the IT or designer did not immediately update the information. In addition, every person’s request for wedding banquet was different.
(3) Use of System: the average score was 4.00-4.17. The average score of “The system makes me intend to increase the amount of transaction” was 3.85, which was lower than that of other items. The reason might be that the budget and number of guests were fixed which could not significantly increase due to this information system.
2.81-4.32, suggesting that the subjects gave a certain feedback to the satisfaction with the system, and the predetermined objective of the designer was achieved. The average score of “I am satisfied with the 3D simulation of the wedding catering planning system” was 2.81, which was lower than that of other items. The reason might be that users still did not believe in the 3D simulation scene. They still intended to go to the venue to make sure of the actual environment. The reason might also be that some users still suggested that the 3D simulation of the system was not convincing. Such factors still should be investigated. The 3D simulation venue planning design still should be improved, and customized system may be promoted.
(5) Analysis on the items of the dimension of net benefits: the average score was 3.60-4.49. The system indeed could save the time of planning and the time of communication. In addition, it enabled the users to understand the service provided by operators and further improved their satisfaction and increase their actual amount of transaction.
This study calculated the overall average of the items of various dimensions to reflect the satisfaction with various dimensions. The scores from the highest to the lowest were: net benefits (4.20) information quality (4.21) system quality (4.12) willingness to use the system (4.04) user satisfaction (3.86). The overall average was 4.09.
The overall score of H0 exceeded 75%, suggested that the system was successful. The overall average was 4.08 and the overall score exceeded 75% (4), suggesting that the SOA-based wedding catering planning system could satisfy customers and meet the needs of market.
4.4 Analysis on the Current Status of the IS Success Model of the Wedding Catering Planning System.
(1) Significance Analysis where Subjects’ Structures were used as the Factors
This study used 2 statistical methods, independent sample test and one-way ANOVA, to test whether there was any significant difference in the subject populations reflecting different characteristics in the assessment of various dimensions.
(a) When gender was used as the factor, there was no significant difference in the
expression of 5 major dimensions between two subject populations.
(b) When the level of education was used as the factor, there were significant differences in major dimensions among subjects of different levels of education. The significant p value of net benefits was <0.05. The significant p value of 3 dimensions, system quality, information quality and information quality was <0.01, and the difference was more significant. The p value of user satisfaction was <0.001, suggesting that the difference in user satisfaction among subjects of different levels of education was most significant.
(c) The test on “age” variable found that, according to the difference in subjects’ age, only the p value of “user satisfaction” among the 5 major dimensions was <0.05, suggesting that there was a significant difference. There was no significant difference in other 4 dimensions.
(d) In terms of wedding banquet budget, only the p value of “user satisfaction” was <0.05, suggesting that there was a significant difference in “user dimension” due to “wedding banquet budget.” There was no significant difference in other dimensions.
(e) The p value of the assessment results of 5 assessment dimensions by the subjects divided according to the actual amount of consumption was not <0.05, suggesting that there was no significant difference in the 5 major dimensions.
(2) Correlation
Table 4: Correlation Results of Research Hypotheses Using Pearson Correlation Analysis
4.5 Verification of Research Hypotheses
This study used regression analyses, including simple linear regression and multiple regressions, to verify hypotheses. The main objective of regression analysis is to find out a linear combination, to specifically reflect the relationships of more than two variables and to indicate the strength of the relationships among variables and whether there is any statistical significance. This study by enter multiple regression to verify the relationships among the independent variables and dependent variables designed in the research model.
(1) Regression analysis
Analysis where willingness to use was used as a dependent variable and system quality ad information quality were used as the independent variables
As shown in Table 5, information quality and system quality affect willingness to use. “Information quality” has a significant effect on “willingness to use.” The Beta value was 0.384, suggesting that “information quality” affects “willingness to use.” The [H1a] of this study was supported.
[image:6.595.304.506.157.255.2]“System quality” has a significant effect on “willingness to use.” The Beta value was 0.409, suggesting that “system quality” affects “willingness to use.” The [H1b] of this study was supported. In the overall regression analysis, the explanatory power of “information quality” and “system quality” for “willingness to use” the system reached 57.8% (R2=0.578).
Table 5: Regression Analysis on the Variables Affecting Willingness to Use
Note: “*” denotes p value <0.1, “**” denotes p value <0.05, and “***” denotes p value<0.001
(2) Analysis where user satisfaction was used as the dependent variable and system quality and information quality were used as the independent variables
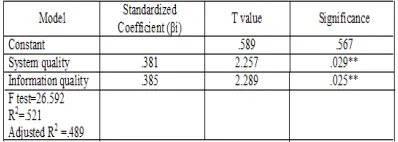
As shown in Table 6, the information quality and system quality of the system affect user satisfaction. “System quality” has a significant effect on “user satisfaction.” The Beta value was 0.381, suggesting that “system quality” affects “user satisfaction.” The [H2a] of this study was supported. “Information quality” has a significant effect on “user satisfaction.” The Beta value was 0.385, suggesting that “information quality” affects “user satisfaction.” The [H2b] of this study was supported. In the overall regression analysis, the explanatory power of “information quality” and “system quality” of “user satisfaction” with the system reached 48.9% (R2=0.489).
Table 6: Regression Analysis on the Variables Affecting User Satisfaction.
Note: “*” denotes p value <0.1, “**” denotes p value <0.05, and “***” denotes p value<0.001 (3) Analysis where user satisfaction was used as the dependent variable and willingness to use was used as the independent variable
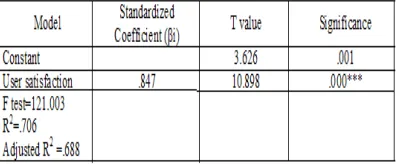
[image:6.595.307.506.568.639.2]significant effect on “user satisfaction.” The Beta value was 0.847, suggesting that “user satisfaction” affects “willingness to use.” The [H3] of this study was supported.
[image:7.595.91.291.259.341.2]In the overall regression analysis, the explanatory power of “user satisfaction” for “willingness to use” reached 68.8% (R2=0.688).
Table 7: Regression Analysis on the Variables Affecting User Satisfaction
Note: “*” denotes p value <0.1, “**” denotes p value <0.05, and “***” denotes p value<0.001 (4) Analysis where net benefits were used as dependent variable and willingness to use and user satisfaction were used as independent variables
As shown in Table 8, willingness to use and user satisfaction affect willingness to use. “Willingness to use” has a significant effect on “net benefits.” The Beta value was 0.341, suggesting that “willingness to use” affects “net benefits.” The [H4] of this study was supported. “User satisfaction” has a significant effect on “net benefits.” The Beta value was 0.481, suggesting that “’user satisfaction” affects “net benefits.” The [H5] of this study was supported. In the overall regression analysis, the explanatory power of “willingness to use” and “user satisfaction” of the “net benefits” of the system reached 58.7% (R2=0.587).
Table 8: Regression Analysis on the Variables Affecting Net Benefits
Note: “*” denotes p value <0.1, “**” denotes p value <0.05, and “***” denotes p value<0.001
(5) Results of the research hypotheses
According to the descriptive statistical analysis on the research hypotheses, Pearson correlation coefficient results, regression analysis results and significance, the analyses on the condition of use of SOA-based wedding catering planning system are as follows:
H0: The sum of means and total score of 5 major dimensions exceeded 75%, suggesting that the wedding catering planning system was successful.
H1a: “System quality” affects “willingness to use.”
H1b: “System quality” affects “user satisfaction.”
H2a: “Information quality” affects “willingness to use.”
H2b: “Information quality” affects “user satisfaction.”
H3: “Willingness to use” is significantly correlated with “user satisfaction.”
H4: “Willingness to use” is significantly correlated with “net benefits.”
H5: “User satisfaction” is significantly correlated with “net benefits.”
5. CONCLUSION
There were significant correlations among the 5 major assessment dimensions of this study, and all of the research hypotheses were supported. The overall score of the wedding catering planning system exceeded 75%, suggesting that the system was successful. The overall average of the entire questionnaire was 4.08, and the overall score exceeded 75% (4), suggesting that the SOA-based wedding catering planning system could satisfy customers and meet the needs of market. It is hoped that, with the analyses performed in this study, a reference model can be provided for wedding catering industry operators to satisfy the consumer needs in the market and create new operating opportunities for wedding catering industry.
REFRENCES:
[1] W.H. DeLone and E.R. McLean, “The DeLone & McLean model of information system: A ten-year update”, Journal of
Management Information System
, V
ol. 19,No. 4, 2003, pp.9-30.
[image:7.595.88.289.600.707.2]Information Management Courses”, Journal
of Convergence Information Technology,
Vol. 6, No. 4, 2011, pp. 298-305.
[3]
M
. R. Brenner and M. R. Unmehhopa, “Service-Oriented Architecture and Web Services Penetration in Next-Generation Networks”, Bell Labs Technical Journal, vol. 12, No. 2, 2007, pp. 147-160.[4] D. Q. Luan, Z. Wu, Z. J. Xia, “Study on SOA-Based Information Sharing System of Service Supply Chain”, International Journal
of Advancements in Computing Technology,
Vol. 5, No. 6, 2013, pp. 954-961.
[5] M. Mohammadi, M. B. Mukhtar, “Service Process Modeling for Demand-driven Supply Chain Based on SOA”, International Journal of Digital Content Technology and its
Applications, Vol. 6, No. 22, 2012, pp. 21-32.
[6] W. H. DeLone and E. R. McLean, “Information systems success: The quest for the dependent variable”, Information Systems
Research, vol.3, No.1, 1992, pp.60-95.
[7] L. F. Pitt, R. T. Watson and C. B. Kavan, “Service Quality: A Measure of Information Systems Effectiveness”, MIS Quarterly, Vol. 19, No. 2, 1995, pp.173-187.
[8] S. Negash, T. Ryan and M. Igbaria, “Quality and Effectiveness in Web-based Customer Support System”, Information and
Management, Vol. 40, No. 8, 2003, pp.
757-768.
[9] L. Kan, “Multidimensional Utility Merging Based Information System Evaluation”,
Journal of Convergence Information
Technology, Vol. 7, No. 18, 2012, pp. 11-19.
[10] F. Chen, “The Study on ERP System Evaluation Based on Fuzzy Analytic Hierarchy Process Method”, International Journal of Digital Content Technology and
its Applications, Vol. 6, No. 22, 2012, pp.
231-238.
[11] P. Bharati and A. Chaudhury, “An empirical investigation of decision-making satisfaction in web-based decision support systems”,
Decision Support Systems, Vol. 37, No. 2,
2004, pp. 187-197.
[12] Z. H. Zhou, “Empirical Study on the Enterprise Informatization Performance Evaluation”, International Journal of
Advancements in Computing Technology,
Vol. 4, No. 21, 2012, pp. 675-682.
[13] J. E Bailey and S. W. Pearson, “Development of a Tool for Measuring and Analyzing Computer User Satisfaction”, Management
Science, Vol. 29, 1983, pp. 530-545.
[14] Q. Huang, “Evaluation Methodology of Search Engines Based on Uncertain Linguistic Information”, International Journal of Digital Content Technology and
its Applications, Vol. 7, No. 3, 2013, pp.
429-435.
[15] S. Hamilton and N. L. Chervany, “Evaluating Information System Effectiveness-Part 1: Comparing Evaluation Approaches”, MIS