TRANSIENT STABILITY ENHANCEMENT OF TNEB 400 kV
TRANSMISSION NETWORK WITH SVC
1Er.S.SUJATHA, 2Dr.R.ANITHA, 3Dr.P.SELVAN, 4Er.S.SELVAKUMAR
1
Assistant Engineer,TNEB, Karur, Tamilnadu, India 2
Professor and Head of EEE, Institute of Road and Transport Technology, Erode, Tamilnadu, India 3
Professor and Head of EEE, Erode Sengunthar Engineering College, Erode, Tamilnadu, India 4
Design and Engineering, ABB, Global Industries, Chennai, Tamilnadu, India E-mail: [email protected]
ABSTRACT
Modeling of the TNEB 400 kV transmission network with SVC using ETAP simulation software is presented in this paper. The system is analyzed under severe disturbance to study the transient behavior by simulating three phase to ground fault at various buses. To enhance the transient stability of the system, SVC are inserted and tested to show the effect of the same on the transient stability under severe disturbances. The study compares the results and effectiveness of SVC for enhancing the transient stability of the system through the critical clearing time using ETAP software. The fault clearing time is increased up to the critical clearing time to test the robustness of the system and the effectiveness of the SVC. Simulation is performed to study the transient behavior of the system. Results show that coordinated modification of exciters, installation of FACTS devices to enhances the stability of the grid to great extent
Keywords:Power Quality, SVC, Exciter, FACTS, TNEB 400 Kv Transmission Network, Transient Stability
1. INTRODUCTION
Enhancement of transient stability during major faults or outage of equipment is prime concern in widely interconnected power systems in countries like India. Issue is more emphasis after two consecutive block outs in the last year which made one tenth of the world population in dark for two days [30]. This paper deals complete simulation model of 400 kV Tamil Nadu network with an installed capacity of more than 17,000 MW with a peak demand of 12,500 MW. Model of steam, gas and hydro turbine generators which are directly evacuated at 400 kV is considered for simulation.
Modern power systems are very widely interconnected, because of its operating economy and reliability through mutual assistance.
However this large scale interconnection over vide area results in angular and voltage stability problems. Traditionally angular stability was the only constraint however voltage stability also becomes more vulnerable due to modernization and over loading of transmission lines. Set of non linear differential equation and set of algebraic equation represents the mathematical model for a power system to simulate transient stability. Numerical techniques are needed to solve this non
analysis {Load Flow and Short Circuit} are preformed to verify the steady state behavior during grid planning and generation transmission expansion. Transient stability is not considered in the planning stage to study the dynamic behavior of the power system due to non availability of simulation model, insufficient input data, non availability of robust software etc., Major block outs on July 30 and 31st 2012 in northern grid of india change the conventional mindsets and emphasis transient stability as a part of grid planning [30].
with proposals to enhance the transient stability of 400 kV substation in the Tamilnadu transmission network.
2. CRITICAL CLEARING TIME
Critical clearing time is the principal criterion for the assessment of transient stability. Fault should be cleared well within the critical clearing time to maintain the transient stability of the power system. Critical clearing time is not sufficient criterion to evaluate the transient stability when considering various scenarios of severe fault occurrence in the power system. The oscillation of generators is basically measured with respect to infinite bus / grid which are represented as slack bus. The oscillation level of the generator depends on the disturbance severity and its time duration. If the generator oscillation goes beyond 180 degrees, the generator loses its synchronism and will not be able to regain the steady state. That is, the generator will not be synchronous with rest of the system. Hence, 180 degrees is standardized as the transient stability limit.
2.1. Modelling of SVC
SVCs, with an auxiliary injection of a suitable signal, can considerably improve the dynamic stability performance of a power system [1 ]& [2] presented a fundamental analysis of the application of SVC for enhancing the power system stability. Also, the enhancement of low frequency oscillation damping via SVC has been analyzed [3].
[image:2.595.305.506.92.266.2] [image:2.595.311.501.140.230.2]The SVC enhances the system damping of local as well as inter-area oscillation modes. Reference [4] studied the nonlinear model interaction in stressed power systems with multiple SVC voltage support. It is observed that SVC controller can significantly influence nonlinear system behavior especially under high-stress operating conditions and increased SVC gains [6]. SVC model shown in Figure 2.1 used to improve the transient stability of the TNEB 400 kV transmission network considered, has been modeled in ETAP. SVC is modeled using ETAP Software.
Figure 2.1.Modeling of SVC
2.2. TNEB 400kV Transmission Network
Tamil Nadu 400 kV transmission network and nearby interconnected substations are considered for the purpose of identifying the critical clearing time at all 400 kV buses to ensure rapid fault clearance and thereby maintaining the transient stability. The system model includes the representation of thirty four 400 kV buses, eleven generators, eleven generators step up transformers etc. Transmission network (only 400 kV) of TNEB is modeled using ETAP. Transmission line parameters of various conductors (Moose and Zeebra) are used as per manufacturer’s standard. Line length and type of conductor are considered as per information available in the Power Grid and Ministry of Power website.
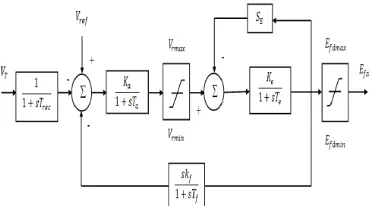
The generators directly connected to TNEB 400 kV transmission network are modeled along with the generator step up transformers. The generator, automatic voltage regulator, turbine governor and transformer data are given in the tables 2.1, 2.2, 2.3 and 2.4 respectively.
The block diagrams of type1 AVR and turbine governor are depicted in Figures 2.2 and 2.3 respectively and fig 2.3 describes the TNEB 400 k V transmission network respectively.
[image:2.595.311.497.602.705.2]Figure 2.3 Block diagram of turbine governor
Table I. Generator data in TNEB 400 kV transmission
network
Generator
name
Rated
MVA
Rated
Voltag
e
(kV) P
Schedul
e
MW Qmi
n
Qma
x
Neyveli-1 247 11 163 0 130.0
Neyveli-Ext 295 11 225 0 156.6
0
Kudamkula 1111.1 21 850 0 484.3
Tuticorin-ST4
555.56 21 450 0 242.1
7
Tuticorin 555.56 21 450 0 242.1
7
Ind-Bharath 666.67 21 600 0 290.6
0
Coastal Ene 666.67 21 510 0 290.6
0
Mettur 555.56 21 450 0 242.1
7
Chennai JV 733.33 21 637.5 0 319.6
4 North
Chennai
666.67 21 510 0 290.6
0 North
Chennai
ABAN
666.67 21 510 0 290.6
0
Table II.Turbine governor data in TNEB 400 kV transmission network
Variable Description Data
σ Droop 0.04
Pmax Maximum power limit 1.1
Pmin Minimum power limit 0
Cmax Rate of valve opening 0.1
Cmin Rate of valve closing - 1
K1 + K2
Power extraction at HP
turbine 0.276
K 3 + K 4
Power extraction at IP
turbine 0.324
K 5 + K 6
Power extraction at LP
turbine 0.4
T1 Phase compensation 1 0.1
T2 Phase compensation 2 0.03
T3 Servo time Constant 0.4
Thp
HP section Time constant in
s 0.26
Trh
Reheat section Time
constant in s 10
Tlp
LP section Time constant in
s 999
Tip
IP section Time constant
[image:3.595.88.536.92.614.2](including re-heater) in s 0.5
Figure.2.4 One line diagram of 400 kV Tamilnadu grid
3. SIMULATION RESULTS
A salient feature of the paper is identification of CCT with the help of ETAP which shows the stability of the system from the relative angle {Swing curve} graph and Relation between Critical clearing time and the devices {AVR. Governor, SVC}.
synchronism depends on the fault clearing time. The time to clear the fault is slowly increased up to the critical clearing time with the help of SVC The effect of SVC on the transient stability of the power system is analyzed by creating three phase to ground fault at various buses using ETAP through the critical clearing time. By placing the SVC at various buses independently, the fault clearing time is increased up to the critical clearing time. Critical clearing time for the various buses with SVC at the 400 kV substations, are tabulated in annexture-I and compared with critical clearing time without SVC. The ETAP software was then used to simulate the 400 kV TNEB Grid yield validated results.
To simulate the 400 kV Tamilnadu grid ,models have been developed for each element and implemented in the dedicated power system simulation tool ETAP which provides the ability to simulate load flow study, short circuit study and Transient events in the same software environment. The ETAP simulation tool therefore has a dedicated model for induction generators which take into account the current displacement in the rotor, the torque slip and short circuit test curves. Also models of synchronous machines, transformers, bus bars, grid models, Transmission lines etc are provided.
The swing curves of generators for a three phase fault at different substation with different scenario is presented here.Fig shows the simulation result for 400kV bus outage and the fault occur at 3 sec and also find the system performance with the presence of exciter, governor, and PSS and without those.
[image:4.595.296.516.72.399.2]The swing curve of the generators inclusion of Exciter, Governor, and PSS the critical clearing time is increased by 206 ms is represented in the Fig 9. This will be certainly helpful to maintain the stability, when the backup protection isolates the fault due to primary relay failure.
Figure 3.1 Swing curves of generators with inclusion of exciter,governor,PSS
Figure 3.2 Swing curves of generators with inclusion of exciter and PSS
Figure 3.3 Swing curves of generators with inclusion of static exciter
[image:4.595.308.513.451.569.2]Changing the droop constant from 5% to 4% the critical clearing time of the 400 k V tamilnadu grid is increased by 168 ms. If the fault clearing time exceeds the 168 ms the oscillation of the generators exceeds 180 degree is shown in the Fig 12.
Figure 3.4 Swing curves of the generators for changing the droop constant
[image:4.595.92.288.590.683.2]Figure 3.5 Swing curve of generators without using Exciter,Governor,PSS
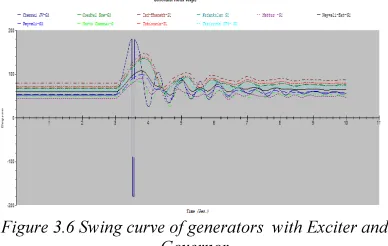
The swing curves of generators in Neyveli, Neyveli Ext, Tuticorin, North Chennai, Mettur for Bus outage fault at Alamanthi 400 k V substation without Exciter and Governor are shown in Fig 14.The critical clearing time of this case is 171 ms. If fault clearing time exceeds 171 ms , the oscillations of generators exceeds 180 degrees shown
Figure 3.6 Swing curve of generators with Exciter and Governor
In the system with dc excitation the fault cleared is not within the time, but if we used the static system the CCT Is increased. An occurrence of three phase fault on the bus and clearance of the fault within a short period of time (upto 100 ms) does not represent a large risk to the power system in terms of transient stability. For this reason, it is necessary to ensure that generators operating in the electric power system have a critical clearing time higher than 100 ms. The comparison of the CCT is listed in the table 1 in annexure.
The critical clearing time of the 400 kV tamilnadu grid is improved while using SVC. Impact of SVC on the transient stability is analyzed with the help of critical clearing time. Critical clearing time at Madurai 400 kV substation without SVC is 136 ms. Considering the relay delay time(40 ms)and circuit breaker opening time (30 ms)in the Madurai substation, the relay and circuit breaker fails to isolate the fault during N-1contingency(i.e during struck breaker operation-after struck breaker, all other breaker should open
However ,with SVC installation at various buses, the critical clearing time is increased from 136 ms to around 179 ms. This increased cushion of 43ms(>1.5 cycle)will maintain the stability for three phase fault at Madurai even N-1 contingency
4. DISCUSSION AND CONCLUSION
In this paper simulation of 400 kV Tamilnadu transmission network has been presented. A 400 kV Tamilnadu transmission network model has been built to simulate the influence on the transient stability of power system with the presence of SVC. The critical clearing time of the system for various contingencies was found and tabulated. From that result the average critical clearing time of the system is high when the SVC is present. Hydro generators are not directly evacuated to 400 kV transmission network, hence the hydro turbines are not modeled in this paper and also the bus outage contingency is only taken in to account. In future the system performance can be analyzed with auto reclosure.
REFRENCES:
[1] Byerly, R. T. D., Poznaniak, T. and Taylor, E. R. “Static Reactive Compensation for Power Transmission System”, IEEE Transaction. PAS-101, pp. 3998–4005, 1982.
[2] Hammad, A. E. “Analysis of Power System Stability Enhancement by Static VAR Compensators”, IEEE Trans.PWRS, Vol. 1, No. 4, pp. 222–227, 1986.
[3] Padiyar, K.R. and Varma, R.K. “Damping Torque Analysis of Static VAR System Controllers”, IEEE Transactions on Power Systems, Vol. 6, No. 2. pp. 458-465, 1991. [4] Messina, A. R. and Barocio, E. “Nonlinear
Analysis of Interarea Oscillations: Effect of SVC Voltage Support”, Electric Power Systems Research, Vol. 64, No. 1,pp. 17–26, 2003. [5] Abido,M. A. “ Analysis and Assessment of
STATCOM –Based Damping Stabilizers for Power System Stability Enhancement”, Electric Power System Research,Vol.73,No.2 ,pp.177-185,2005.
[image:5.595.92.286.363.486.2]Non-linear H α Stabilizer”,Electric Power Syatems esearch,Vol.73,No.1,pp.45-52,2005. [8] Anderson,G. “Dynamics and Control of
Systems”,Zurich,Switzerland:EEH-Power Systems Laboratory ETH,2004.
[9] Begovic,M.”Defense Plan Against Extreme Contingencies”,CIGRETF-Summary for Electra, C2.02.24,2007.
[10] Van Custem,T.and Vournas,C.”Voltage Stability of Electri Power Systems”, Norwell,MA:Kluwer,1998.
[11] Sauer,P.W.and Pai,M. A.” Power System Dynamics and Stability”,Prentice Hall,1998. [12] Taylor,C.W.”Power System Voltage Stability”,
MC Graw Hill,New York,1994.
[13] Van Custem,T. and Mailhot ,R.”Validation of fast voltage stability analysis method on the Hydro Quebee System”, IEEE Transaction Power System,Vol.12,pp.282-292,1997.
[14] Van Custem,T. and Mailhot ,R. Validation of fast voltage stability analysis methods “, Proc.IEEE ,Vol.88,pp.208-227,2000.
[15] P.Kundur and .C.Dandeno,”Implementation of synchronous machine models into power system stability programs,” IEEE Trans,Vol.PAS-102,pp 2047-2054,July 1983.
[16] IEEE Committee Report,”Proposed Excitation system Definitions for synchronous machine,” IEEE Trans Vol.PAS-88,pp 1248-1258,August 1969.
[17] IEEE Committee Report,”Excitation system models for power system stability studies,” IEEE Trans ,Vol.PAS-100,pp 494-509,February 1981.
[18] W.A.Lewis,”A Basic Analysis of Synchronous machines-Part-I, AIEE Trans,Vol.77 , pp. 436-456, 1958.
[19] I,M,Canay,” Extended Synchronous Machine model for the calculation of Transient Processes and stability ,” Electrical Machines & Electro mechanics, Vol-I,pp.137-150,1977.
[20] C.Concordia and S.Ihara,” Load representation in Power System Stability Studies,” IEEE Trans,Vol.PAS,101, pp.969-977,April-1982. [21] D.S.Brereton,D.G.Lewis and C.C.Young,”
Representation of Induction motor Load during Power System Stability Studies, AIEEE Trans,Vol-76,Part-III,pp 451-460,August.1957.
[22] EPRI Report of Project RP 849-1,”Determining Load Characterristics for Transient Performance,” EPRI EL- 850,Prepared by General Electric Company, March.1981. [23] P.Kundur,M.Elein, G.J.Rogers, and
M.S.Zywno,” Application of Power System Stabilizers for Enhancement of overall System Stability,” IEEE Trans, Vol.PWRS-4,No-2, pp.614-626, May 1989.
[24] Zhou,E.Z.”Application of Static Var Compensators to Increase Power System damping”,IEEE Transactions on Power Systems,Vol.8,No.2,pp .655-661,1993.
[25] Yong Hua Song and Allan ohns,T.”Flexible AC
Transmission Systems(FACTS)”,
London,UK:IEE Press,1999.
[26] www.cea.nic.in\reports\planning\power_scenari o.pdf.
[27] Wang,Y.,Mohler,R.,Spee,R.andMittelstadt,W.” Variable Structure FACTS Controllers for Power System Transient Stability”, IEEE Trans,PWRS,Vol.7,pp307-313,1992.
[28] Van Custem,T.and Vournas,C.”Voltage Stability of Electric Power Systems”, Norwell,MA:Kluwer,1998.
[29] P.Kundur,”Power System Stability and Control’’,McGraw-Hill,Inc.
ANNEXURE- I
Critical Clearing Time of 400 kV TNEB transmission network for various contingencies using ETAP
ID
WO exciter,gov ernor,pss,S
VC
with exciter,gover
nor,pss
with exciter, governor
with exciter & pss
with exciter static
with governor
droop change(4)
Using SVC
Alamanthi 166 206 171 169 169 168 234
Arasur 224 343 279 260 260 245 281
Melakuttaiyur 298 321 322 315 314 305 356
Sholinganallur 399 514 499 474 474 420 636
Pondicherry 378 577 581 499 499 426 699
Trichy 207 260 261 246 246 225 277
Karaikudi 141 167 167 161 161 151 188
Madurai 136 163 164 157 157 146 179
Kayathar 136 157 157 153 152 145 186
TM-Wind 139 161 160 155 155 147 194
Thirunelveli 129 147 147 144 143 137 168
SVC-4 224 236 236 232 232 229 259
Singarpet 173 207 208 197 197 187 238
Pugalur 158 192 192 183 183 170 246
Udumalpet 168 203 203 183 192 182 239
Karamadai 324 444 447 396 396 365 469
Muvattupuzha 216 262 262 248 248 234 284
N_Thichur 219 269 270 252 252 238 297
Trivandrum 342 465 467 433 432 381 488