MEASUREMENT AND EVALUATION OF THE
COORDINATION DEVELOPMENT OF PREE SYSTEM IN
HEILONGJIANG PROVINCE, CHINA
1,2ZI TANG
1
School of Tourism and Cuisine, Harbin University of Commerce, Harbin 150076, China
2School of Environment, Beijing Normal University, Beijing 100875, China
E-mail: [email protected]
ABSTRACT
The coordination development of population-resource-environment-economy (PREE) system is viewed as
an important way to realize regional sustainable development. This paper aims to establish the coordinate assessment methods for studying PREE system by principal component analysis, regression analysis and models concerning coordination development. On the basis of the case study on Heilongjiang Province, the paper quantitatively assessed the index of integrated development and the degree of coordination development of each subsystem. The result indicated that the index of integrated development and the degree of coordination development of each subsystem had an increasing tendency in different degrees in general, while showed obvious stage and fluctuant characteristic from 1997 to 2010. Resource has become the bottleneck for the coordination development of between population, resource, environment and economy in Heilongjiang Province.
Keywords: Sustainable Development, Coordination Degree, Population-Resource-Environment-Economy
(PREE), Heilongjiang Province
1. INTRODUCTION
A series of acute contradiction among excessive population, scanty resource, destructible environment and unbalanced economic development has been the severe challenge for human subsistence and development. Harmonious development of population, resource and environment and economy is the inevitable way to achieve sustainable development, which would obtain the better economic development by less resources consumption and environmental cost [1]. However, there is noticeable negative correlation between natural resource and economic development [2]. The relationship between the economic growth and the environment pollution is often described by the Environmental Kuznets Curve [3]. In the analysis the interaction between
economy and environment, the idea of
environmental carrying capacity [4], the viewpoint of ecological economy [5], and the thought of sustainable development [6] are reflected and applied.
In the background of rapid economic and social development in China, the interactions among
population, resource, environment and economy are becoming much intense and complicated, which have aroused government’s and people’s particular attention. For the related study in state level, for example, Liu et al (2006) evaluated the regional urbanization and eco-environment coupling in China by Grey associative analysis [7]. Wu and Niu (2012) analyzed the coupling status between population and resource-environment in China during 1985-2004 by principal component analysis method and coordinated development degree model [8].
of SD–GIS to model and evaluate the urban economy-resource-environment system in Chongqing City [12]. He and Weng (2012) evaluated the quality of resource environment and the urban economic development in 6 cities in Poyang Lake Area by using principal component weighting method and fuzzy subjection function method [13].
This study takes Heilongjiang Province in China as a case study. Affected by history, geography, nature and other factors, the development level of Heilongjiang Province’s social economy is relatively backward compared to the central and eastern areas in China. A series of severe resource and environmental problems are restricting sustainable development of society- economy and ecological security in Heilongjiang Province [14-15]. Therefore, it is meaningful to assess development state of population, resource and environment and economy system in Heilongjiang Province. Through the construction of the comprehensive appraisement indicators system of population, resource, environment and economy, this paper evaluated the development index of each subsystem from 1997 to 2010 by using the method of principal component analysis. Based on the results, some development countermeasures are put forward in a scientific way. The research results can contribute to guide the construction of ecological province in Heilongjiang Province, to promote more harmonious development of population, resource and environment and economy system, and to guide the healthy development of regional sustainable development.
2. STUDY AREA
Heilongjiang Province, geographically ranging from 121°11′E to 135°05′E and from 43°25′N to 53°33′N, is located in Northeast China. Its total land area is 473000 sq. km., accounting for 4.9% of entire land area in China (Figure 1). The climate is the mid temperate continental monsoon climate.
The average annual temperature ranges from -4℃
to 5℃. The average annual rainfall is 400–650 mm and 80% of rainfall occurs between May and September. There are about 100-160 frost-free
days and 2000-3000℃ accumulated temperature
(above 10℃). The population is 38.33 million in 2010, accounting for the national total population 2.86%. Heilongjiang Province is rich in cultivated land resources, forest resources, oil resources and coal resources. Some areas’ ecological
[image:2.612.328.513.137.320.2]environment is fragile because of the complexity of the province's geographical environment and natural conditions, which is suffering from resources and environment pressures.
Figure 1: The Sketch Map For Location of Heilongjiang Province In China
3. METHODOLOGY
3.1 Establishment of Index System
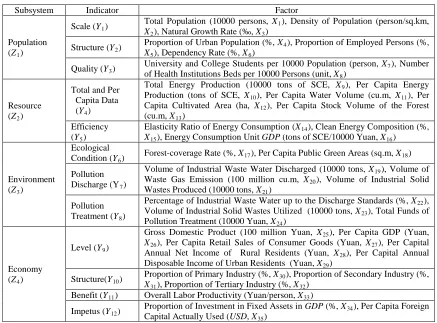
On the basis of the principles of representative, integrality and availability, this paper establishes an indicator system including such subsystem as population, resource, environment and economy to measure and evaluate the coordinative degree of Heilongjiang Province. The indicator system comprises 4 subsystems, 12 indicators, and the underlying 35 factors to represent the development level among population, resource, environment and economy (Table 1). The statistical data utilized in the analyzing process from 1997 to 2010 are derived from the corresponding
Heilongjiang Statistics Yearbook (1998-2011) [16]. There are 490 samples. All the statistical analyses are performed using SPSS statistical software, version 20.
3.2 Data Standardization
Due to different dimensions of the indicators, the original data need to be standardized by the following method (Z-score) [17]:
ij ij ij ij
S X X
ZX = − (1)
Where:
ij
ZX is the standardized value, Xij is the
value of original data,
ij
original data,
ij
S is the standard deviation value of original data, i=1997,1998,…, 2010, j=1, 2,…, 35.
3.3 Principle component analysis
Principal component analysis is used to reduce dimension of population subsystem (Z1), resource
subsystem (Z2), environment subsystem (Z3), and
economy subsystem (Z4). Further the synthesized
score (∑F) are determined to reflect the
comprehensive assessment value of the four groups, and also is the integrated development
index of population, resource, environment and economy subsystem.
3.4 Regression Analysis
Regression Analysis is presented to make linear, polynomial regression, and curve simulation for the synthesized score of population subsystem
(∑FZi1), resource subsystem (∑FZi2),
environment subsystem (∑FZi3), and economy
subsystem (∑FZi4). Then the fitting curve
[image:3.612.91.528.265.588.2]equations are chose in term of residual square sum and statistic distribution rule of error.
Table 1: The Indicator System of PREE System In Heilongjiang Province
Subsystem Indicator Factor
Population (Z1)
Scale (Y1)
Total Population (10000 persons, X1), Density of Population (person/sq.km, X2), Natural Growth Rate (‰, X3)
Structure (Y2)
Proportion of Urban Population (%, X4), Proportion of Employed Persons (%, X5), Dependency Rate (%, X6)
Quality (Y3)
University and College Students per 10000 Population (person, X7), Number of Health Institutions Beds per 10000 Persons (unit, X8)
Resource (Z2)
Total and Per Capita Data (Y4)
Total Energy Production (10000 tons of SCE, X9), Per Capita Energy Production (tons of SCE, X10), Per Capita Water Volume (cu.m, X11), Per Capita Cultivated Area (ha, X12), Per Capita Stock Volume of the Forest (cu.m, X13)
Efficiency (Y5)
Elasticity Ratio of Energy Consumption (X14), Clean Energy Composition (%, X15), Energy Consumption Unit GDP (tons of SCE/10000 Yuan, X16)
Environment (Z3)
Ecological Condition (Y6)
Forest-coverage Rate (%, X17), Per Capita Public Green Areas (sq.m, X18)
Pollution Discharge (Y7)
Volume of Industrial Waste Water Discharged (10000 tons, X19), Volume of Waste Gas Emission (100 million cu.m, X20), Volume of Industrial Solid Wastes Produced (10000 tons, X21)
Pollution Treatment (Y8)
Percentage of Industrial Waste Water up to the Discharge Standards (%, X22), Volume of Industrial Solid Wastes Utilized (10000 tons, X23), Total Funds of Pollution Treatment (10000 Yuan, X24)
Economy (Z4)
Level (Y9)
Gross Domestic Product (100 million Yuan, X25), Per Capita GDP (Yuan, X26), Per Capita Retail Sales of Consumer Goods (Yuan, X27), Per Capital Annual Net Income of Rural Residents (Yuan, X28), Per Capital Annual Disposable Incomeof Urban Residents (Yuan, X29)
Structure(Y10)
Proportion of Primary Industry (%, X30), Proportion of Secondary Industry (%, X31), Proportion of Tertiary Industry (%, X32)
Benefit (Y11) Overall Labor Productivity (Yuan/person, X33)
Impetus (Y12)
Proportion of Investment in Fixed Assets in GDP (%, X34), Per Capita Foreign Capital Actually Used (USD, X35)
3.5 Calculation of Static Coordination Degree 3.5.1 Two systems
Equations (2)-(3) are introduced to calculate the coordination coefficient of two systems.
{
}
{
( ), ( )}
max
) ( ), ( min ) , (
i j c j i c
i j c j i c j
i
Cs =
(2)
( )
− − ′
=exp ( 2 )2
s x x j
i
c
(3)
Where, Cs(i,j) is the static coordination
coefficient between i system and j system, c
( )
i j is the coordination coefficient of i system to j system,) (j i
c is the coordination coefficient of j system to
i system,
x
is the actual value of syntheticaldevelopment level of i system,
x
′
is thecoordination value of synthetical development of j
system to i system, 2
3.5.2 Three systems
Equations (4)-(5) are introduced to calculate the coordination coefficient of three systems.
) , ( ) , ( ) , ( ) , ( ) , / ( ) , ( ) , / ( ) , ( ) , / ( ) , , ( j i C k i C k j C j i C j i k c k i C k i j c k j C k j i c k j i
Cs + +
× + × + × = (4)
− − ′′
=exp ( 2 )2
) , / ( s x x k j i
c
(5)
Where, Cs(i,j,k) is the coordination coefficient
between i system, j system and k system,
)
,
/
(
i
j
k
c
is the coordination degree of i system toj system and k system.
3.5.3 Four systems
Similarly, equation (6) is introduced to calculate the coordination coefficient of four systems.
) , , ( ) , , ( ) , , ( ) , , ( ) , , ( ) , , / ( ) , , ( ) , , / ( ) , , ( ) , , ( ) , , ( ) , , ( ) , , ( ) , , / ( ) . , ( ) , , / ( ) , , , ( k j i C l j i C l k i C l k j C k j i C k j i l c l j i C l j i k c k j i C l j i C l k i C l k j C l k i C l k i j c l k j C l k j i c l k j i Cs + + + × + × + + + + × + × = (6)
3.6 Calculation of dynamic coordination degree
Equation (7) is introduced to calculate the dynamic coordination degree of two systems.
∑
− = − = 1 0 ) ( 1 ) ( T i sd C t i
T t
C , 0< Cd(t)≤t (7)
Where,
C
d(
t
)
is the dynamic coordination degreeof two systems, C (t−T+1)
s , Cs(t−T+2) ,
…, Cs(t−1) , Cs(t) are the static coordination
degree at each moment in the period of (t−T)−t.
Given
t
2>t
1(in any different time), if ( )2
t
Cd ≥
) (t1
Cd , it shows that the system has been in the
track of coordinated development.
Based on consulting a large number of domestic and foreign documents concerning this subject, the paper defines 0.85 as boundary of system maladjustment and coordination. The criterions of coordination degree are as follows: 0-0.50, serious maladjustment; 0.51-0.85, maladjustment;
0.86-0.95, coordination; 0.95-1.00, extreme
coordination.
4. RESULTS
4.1 Evaluation of Integrated Development Index of Each Subsystem
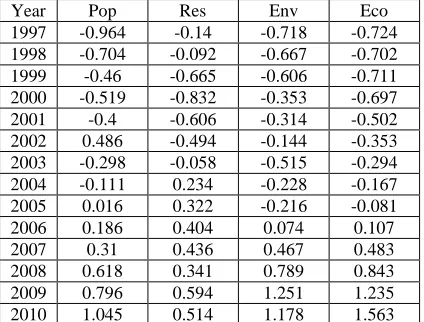
Principal component analysis is used to calculate the synthesized scores of each subsystem by virtue of SPSS statistical software. As shown in Table 2, the integrated development index of each subsystem was all under 0 before 2001 and all above 0 after 2006, which showed that the
[image:4.612.317.529.164.325.2]comprehensive development level has a significant improvement from 1997 to 2010.
Table 2: The Integrated Development Index Of Population, Resource, Environment And Economy Subsystem In Heilongjiang Province From 1997 To 2010
Year Pop Res Env Eco
1997 -0.964 -0.14 -0.718 -0.724
1998 -0.704 -0.092 -0.667 -0.702
1999 -0.46 -0.665 -0.606 -0.711
2000 -0.519 -0.832 -0.353 -0.697
2001 -0.4 -0.606 -0.314 -0.502
2002 0.486 -0.494 -0.144 -0.353
2003 -0.298 -0.058 -0.515 -0.294
2004 -0.111 0.234 -0.228 -0.167
2005 0.016 0.322 -0.216 -0.081
2006 0.186 0.404 0.074 0.107
2007 0.31 0.436 0.467 0.483
2008 0.618 0.341 0.789 0.843
2009 0.796 0.594 1.251 1.235
2010 1.045 0.514 1.178 1.563
Note: Pop-Population, Res-Resource, Env- Environment, Eco- Economy
The integrated development index of population subsystem was negative before 2001, positive after 2005 with rapidly ascending speed, from -0.964 in 1997 to 1.045 in 2010. The main influencing factors are the greatly enhanced medical treatment level, the continuing increase in population numbers, and the advantage of age structure.
The integrated development index of resource subsystem was negative before 2003 and positive after 2004. Due to the change of total energy production, energy consumption per unit GDP, and clean energy composition, resource subsystem inclined to fluctuation.
The integrated development index of environment subsystem was negative before 2005 and positive after 2006. The large-scale forestation and returning farmland to forests had raised the forest coverage rate and per capita public greenbelt area, which improved Heilongjiang Province’s environmental condition. However, it is not so optimistic that increasing industrial wastes and relatively few investment in environmental protection.
The integrated development index of economy subsystem was negative before 2005, but was positive after 2006, which was increased from -0.72 in 1997 to 1.56 in 2010. This is mainly caused by the growth of economy, enhancement of overall
labor productivity, adjustment in economic
4.2 Analysis of Coordination Degree
It substitutes the fitting curve equations with the comprehensive scores of four subsystems to get the
coordinate value of the comprehensive
development. Then the coordinate degree of PREE
system and each subsystem from 1997 to 2010 were obtained using equations (2)-(7). The results are shown in Figure 2 to Figure 4.
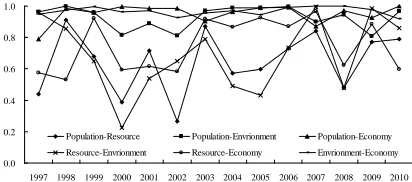
4.2.1 Analysis of coordination degree of two subsystems
It can be seen from Figure 2 that the coordination degree of environment-economy had the best specificity and its average value was 0.97; the next best was that of population-economy and its average value was 0.95; the worst was that of population-resource and its average value was 0.65 among the coordination relation of resource, environment, population-economy, environment, resource-economy, environment-economy from 1997 to 2010. The coordination degree of population-environment, population-economy, and environment-economy showed relatively smooth change and was basically in the state of coordination and extreme coordination. The coordination degree of population-resource, resource-environment, and resource-economy showed relatively great change and was basically in
the state of maladjustment- coordination-
maladjustment. It indicated that the abundant natural resources of Heilongjiang Province has not formed the advantage in the development process of society and economy, and has become the bottleneck factor for the coordination development of between population, resource, environment and economy in Heilongjiang Province.
0.0 0.2 0.4 0.6 0.8 1.0
[image:5.612.318.524.247.333.2]1997 1998 1999 2000 2001 2002 2003 2004 2005 2006 2007 2008 2009 2010 Population-Resource Population-Envrionment Population-Economy Resource-Envrionment Resource-Economy Envrionment-Economy
Figure 2: Coordination Degree Of Two Subsystems In Heilongjiang Province From 1997 To 2010
4.2.2 Analysis of coordination degree of three subsystems
It can be seen from Figure 3 that the coordination degree of population –environment -economy was in the state of coordination from
1997 to 2010 beside in 2002 and its average value was 0.94. The coordination degree of resource-environment- economy was in the state of coordination from 1997 to 2010 beside in 2010 and its average value was 0.90. The coordination degree
of population -resource -environment, and
population -resource -economy were relatively low and was in the state of serious maladjustment in some years. It indicated that the population pressure on the resources and environment was building up, and also restricted the economic development to a certain extent.
0.0 0.2 0.4 0.6 0.8 1.0
[image:5.612.94.300.539.630.2]1997 1998 1999 2000 2001 2002 2003 2004 2005 2006 2007 2008 2009 2010 Population-Resource-Envrionment Population-Resource-Economy Population-Envrionment-Economy Resource-Envrionment-Economy
Figure 3: Coordination Degree Of Three Subsystems In Heilongjiang Province From 1997 To 2010
4.2.3 Analysis of coordination degree of PREE system
From the static coordination degree point view, the coordination development between population, resource, environment and economy was in a quite good status but showed obvious fluctuation since 1997 (Figure 4). The ratio of the highest static coordination degree (0.998) and the lowest (0.773) was 1.29. The static coordination degree of the overall system showed a trend of decrease and was in the state of maladjustment from 1997 to 2002, which reached the lowest in 2002. That of the overall system was in the state of coordination from 2003 to 2008, which reached the highest in 2008. That of the overall system was in the state of maladjustment since 2009.
From the dynamic coordination degree point view, the coordination development between population, resource, environment and economy showed relatively smooth change and was basically in the state of coordination. But it showed a trend of decrease and was in the state of maladjustment since 2009. Compared with the static coordination degree, the dynamic coordination degree has the obviously characteristics of smooth and lag. This requires that in the prolonged process of development the sytems of population, resource, environment and economy should meet the
principle of harmonious development and
0.6 0.7 0.8 0.9 1.0
[image:6.612.94.299.73.196.2]1997 1998 1999 2000 2001 2002 2003 2004 2005 2006 2007 2008 2009 2010 Static Coordination Degree Dynamic Coordination Degree
Figure 4: Coordination Degree Of PREE System In Heilongjiang Province From 1997 To 2010
5. CONCLUSIONS
For integrated development index, each
subsystem had an increasing tendency in different degrees in general from 1997 to 2010, while showed obvious stage and fluctuant characteristic, especially resource subsystem. The result indicated that the population quality, environment protection and economy development have made remarkable progress, but the comprehensive utilization efficiency of resources still is very low.
For the coordination degree of two subsystems, environment subsystem, population-economy subsystem, and environment-population-economy subsystem was in the status of coordination and extreme coordination; while population-resource subsystem, resource-environment subsystem, and resource-economy subsystem was in the fluctuant
status of maladjustment, coordination and
maladjustment. For the coordination degree of three subsystems, population -environment -economy subsystem was in the good state of coordination, while population-resource- environment subsystem, and population-resource- economy subsystem were relatively low and was in the state of serious maladjustment in some years.
For the coordination degree of PREE system, the static coordination degree was in a quite good status but showed obvious fluctuation. The dynamic coordination degree showed relatively smooth change but showed a trend of maladjustment.
The conclusions indicated that the development level of PREE system will be influenced with the constraints of resource and environment subsystem, although the economy and population subsystem develop in good status. The resource of Heilongjiang Province hasn’t form the advantage, which has become the bottleneck for the
harmonious development of PREE system. In
summary, the degradation of resource and environment system is closely related to economic
development and other human activities. If the resource and environment system are beyond theirs capacity, it would inevitably restrict the economic development, which must be paid enough attention to the non-coordinated development of each subsystem.
ACKNOWLEDGMENTS
This research is funded by project of humanities and social sciences of the Ministry of Education of the People's Republic of China (12YJCZH295), the project of humanities and social sciences of Education Department of Heilongjiang Province (12512078), and project of philosophy and social sciences for research and planning of Heilongjiang Province (12D051).
REFRENCES:
[1] W.G. Wang, “Theory and Method of
Coordinated Development”, Beijing, China: China Finance and Economy Press, 2000.
[2] J.D. Sachs, and A.M. Warner, “Natural
resource and economic development: The curse
of natural resources”, European Economic
Review, No. 45, 2001, pp. 827-838.
[3] G.M. Grossman, and A.B. Krueger, “Economic
growth and the environment’, Quarterly
Journal of Economics, Vol. 110, No. 2, 1995, pp. 353-377.
[4] N. Sayre, “The genesis, history and limits of
carrying capacity”, Annals of the American
Association of Geographers, Vol. 98, No.1, 2008, pp.120-134.
[5] P. Berck, A. Levy, and K. Chowdhury, “An analysis of the world’s environment and population dynamics with varying carrying capacity, concerns and skepticism”, Ecological Economics, No. 73, 2012, pp.103-112.
[6] S. Marsiglio, “On the relationship between
population change and sustainable
development”, Research in Economics, No. 65, 2011, pp. 353-364.
[7] Y.B. Liu, R.D. Li, and X.F. Song, “Grey
associative analysis of regional urbanization and eco-environment coupling in China”, Acta Geographica Sinica, No. 2, 2006, pp. 237-247.
[8] W.H. Wu, and S.W. Niu, “Evolutional analysis
of coupling between population and
resource-environment in China”, Procedia
[9] P.Y. Zhang., F Su, H. Li, and Q. Sang, “Coordination degree of urban population, economy, space, and environment in Shenyang Since 1990”, China Population, Resources and Environment, Vol.18, No.2, 2008, pp.115-119.
[10] M. Yue, and H.L. Li, “Dynamic Study of
Sustainable Development of PREE Sysem in Eastern Gansu Loess Plateau: A case study of
Qingyang City in Gansu”, Economic
Geography, Vol.29, No. 1, 2009, pp.124-129.
[11] G.L. Hu, and X. Zhu, “Comprehensive
evaluation of population, resources, environment and economic system of Xinjiang: Based on the principal component analysis”,
Ecological Economy, No. 6, 2009, pp. 67-69. [12] D.J. Guan, W.J. Gao, W.C. Su, H.F. Li, and K.
Hokao, “Modeling and dynamic assessment of urban economy-resource-environment system with a coupled system dynamics-geographic
information system model”, Ecological
Indicators, No. 11, 2011, pp. 1333-1344.
[13] Y.Q. He, and Y.J. Weng, “Assesment of
Harmonious Development between Resource, Environment and Urban Economy in Poyang Lake Area”, Resources Science, Vol.34, No.3, 2012, pp. 502-509.
[14] S. Li, W. Qiu, and Q.L. Zhao, “Quantitative relationship between environmental quality and
economic development of Heilongjiang
province”, Journal of Harbin Institute of Technology, Vol.38, No. 11, 2006, pp.1986-1988.
[15] L. Li, “An empirical study on Environmental Kuznets Curve in Heilongjiang Province”, Commercial Research, No. 6, 2009, pp. 69-71. [16] Statistics Bureau of Heilongjiang Province, and
National Statistics Bureau of Survey Office in Heilongjiang Province, Heilongjiang Statistical Yearbook (1998-2011), Beijing, China: China Statistics publishing house, 1998-2011.
[17] W. Guan, and Z. Tang, “Study on change in