BIROn - Birkbeck Institutional Research Online
Hough, Mike and Jacobson, Jessica and Millie, A. (2003) The decision to
imprison: sentencing and the prison population. Project Report. Prison
Reform Trust, London, UK.
Downloaded from:
Usage Guidelines:
Please refer to usage guidelines at or alternatively
The Decision to Imprison:
Sentencing and the Prison Population
This study addresses one of the central problems facing contemporary penal policy. Prisons are overcrowded, budgets are stretched to the limit.The adult prison
population of England and Wales has grown from 36,000 in 1991 to 62,000 in 2003 – an increase of 71%.
Neither rising crime nor rising numbers of offenders before the courts can explain the increase. Both have fallen. Rather, the study shows that sentencers have become tougher, in response to legislation, guideline judgements and political and media pressure.
This report suggests that the best way of bringing down the prison population is to issue guidance to sentencers to use imprisonment less often, and where it is used, to pass shorter sentences. Providing a wider range of tougher community penalties will have little impact on the problem, as sentencers are already broadly satisfied with the existing options.
The authors identify a need to improve public awareness of community penalties. It advocates greater use of fines, to free up probation resources and defer the time when the ‘last resort’ of imprisonment has to be used. But above all, it argues that there needs to be clear and consistent political leadership in stressing the need to reduce prison numbers.
£10.00 Prison Reform Trust, 15 Northburgh Street,
London EC1V 0JR Registered Charity No 1035525
Company Limited by Guarantee No. 2906362 Registered in England
Mike Hough
Jessica Jacobson
Andrew Millie
P R I S O N
T R U S T
P R I S O N
T R U S T
9 780946 209668ISBN 0 94620 966 9
The Decision
to Imprison:
The work of the Prison Reform Trust is aimed at creating a just, humane and effective penal system. We do this by inquiring into the workings of the system; informing prisoners, staff and the wider public; and by influencing Parliament, Government and officials towards reform.
© 2003: the authors and Prison Reform Trust
All rights reserved. No part of this publication may be reproduced or transmitted, in any form or by any means, electronic, mechanical, photocopying, recording or otherwise without the prior permission of the copyright owners.
First published in 2003 by Prison Reform Trust 15 Northburgh Street, London EC1V 0JR www.prisonreformtrust.org.uk
ISBN: 0 946209 66 9
Cover photos by Don Barker and Jason Shanai
The Decision
to Imprison
Sentencing and
the Prison Population
v
Acknowledgements vii
Foreword viii
Summary ix
1. Introduction 1
Background to the study 1
Aims of the study 3
Methods 4
Outline of the report 5
2. Accounting for the growth in the prison population 7
The prison population 7
Convictions 10
Custody rates 12
Sentence length 13
Changes in procedure 16
The use of non-custodial penalties 20
Summary 21
3. Understanding the growth in the prison population 23
Has sentencing become more severe? 23
Has offending increased in seriousness? 28
Other factors 32
The rise in the prison population: an overview 33
4. Sentencing decisions 35
Prison as a last resort 35
Borderline/cusp cases 36
The ‘unavoidability’ of custody 38
The narratives of sentencing 39
vi
5. Alternatives to custody 45
Sentencers’ views of the Probation Service 45
Do sentencers want feedback on cases? 46
Does current provision need to be redesigned? 47
Are more non-custodial options needed? 49
The sentencer-defendant contract 50
6. The political and social context 53
Pressures from ‘the centre’ 53
Pressures from the media and the public 53
Responding to the pressures 55
7. Conclusions: Reducing the prison population 59
Changing the legal and legislative framework 59
Extending and improving non-custodial penalties 60
The climate of opinion about crime and punishment 62
The political will to restrict prison numbers 64
vii
We would like to thank our funders, the Esmée Fairbairn Foundation, who funded the study as part of their Rethinking Crime and Punishment initiative. Without their generosity this study would not have been possible.
A large number of people were very generous with their time. We are grateful to those who helped to get the study off the ground, providing access to our respondents: Sid Brighton, Sally Dickinson, Penny Hewitt, Rachel Lipscomb, Lord Justice Judge and Lord Justice Woolf. We would like to thank all the judges, recorders, district judges and magistrates who took part in the study. They and their staff met the considerable demands we placed on them with forbearance and good humour; but we are especially grateful to them for the spirit of openness with which they approached the study.
Thanks are due to several people who helped us when we were analysing our findings and drafting this report. We would like to thank Rob Allen, Andrew Ashworth, Pat Dowdeswell, Carol Hedderman, Paul Kiff, Rod Morgan, Julian Roberts and Jackie Tombs for reading and commenting on earlier drafts. We would also like to thank Pat Dowdeswell for her help in guiding us through sentencing and prison statistics, and in sharing her own analyses with us. We are grateful to Carrie Buttars and Siân Turner for help with data entry and transcription.
We would like to thank Christine Stewart, formerly Head of Sentencing Policy at the Home Office, for helping the Prison Reform Trust to initiate the study.The study was mounted as a joint enterprise in which the Criminal Policy Research Unit took responsibility for carrying out and reporting the research, and PRT disseminated the results. We are grateful to Geoff Dobson, Kimmett Edgar, Lucy de Lancey, Juliet Lyon, Diana Ruthven and Enver Solomon at PRT.The Trust’s staff were consistently constructive and supportive, but at the same time, never failed to respect our independence as researchers.
Mike Hough Jessica Jacobson Andrew Millie
July 2003
Mike Hough is Professor of Social Policy and Director of the Criminal Policy Research Unit at South Bank University, where Dr Andrew Millie is a Research Fellow. Dr Jessica Jacobson is an independent consultant.
viii
Fifteen years ago when I was Home Secretary the prison population of England and Wales hovered at around the 50,000 mark.Today it is 74,000 and we are told by the Home Office that on present trends it will be over 91,000 by the year 2009. We are well ahead of the rest of western Europe in our readiness to imprison our fellow citizens. ‘Ahead’ is not quite the right word.The huge expense of this operation is obvious when each new prison place costs £100,000.The usefulness of prisons, even well run prisons, must be questioned when 58% of those so punished re-offend within two years. But our prisons are by no means well run when they are overcrowded as they are today. On the contrary, the gallant efforts which the Prison Service makes to rehabilitate prisoners and set them straight are nullified when the resources of the service are dissipated in shunting prisoners hundred of miles round England and Wales in search of accommodation.
How has this happened and why does it continue? Mike Hough, Jessica Jacobson and Andrew Millie analyse a complicated question in detail but with great clarity. Part, but only part, of the problem lies with the laws on sentencing which Parliament provides.The actual decisions are of course taken by judges and magistrates as they respond, not just to the merits of each case, but to the pressures which they perceive from public opinion and the media.
We in the Prison Reform Trust and other charities in this field take up the continuous challenge of setting out the facts to the public and in particular to those who have the
responsibility of passing sentences. We try to deal in facts rather than prejudices, believing that the present trends documented by the Home Office, instead of making us safer, continue to weaken our society.The work done by Mike Hough and colleagues gets behind the headlines to those facts and I am sure that their analysis will be widely studied and welcomed.
Lord Hurd of Westwell
President, Prison Reform Trust
ix
This study addresses one of the central problems facing contemporary penal policy.The prison population in England and Wales has been rising steeply and progressively. Prisons are overcrowded, budgets are stretched to the limit. Despite this, there has been remarkably little debate about the reasons for this increase, and whether ways can be found of putting a stop to it.This study is intended to go some way to filling the gap.
Key findings
•
The adult prison population of England and Wales has grown from 36,000 in 1991 to 62,000 in 2003 – an increase of 71%.•
There are two main reasons why the prison population has grown. Sentencers are now imposing longer prison sentences for serious crimes, and they are more likely toimprison offenders who 10 years ago would have received a community penalty or even a fine.
•
Tougher sentencing practice has come about through the interplay of several factors: an increasingly punitive climate of political and media debate about punishment; legislative changes and new guideline judgements; and sentencers’ perceptions of changes in patterns of offending.•
The statistics do not lend support to sentencers’ beliefs that offenders are becoming more persistent, and committing more serious crimes; however more research is needed on this topic.•
Sentencers consistently say that they send people to prison only as the absolute last resort – either because the offence is so serious that no other sentence is possible; or because the offender’s past convictions or failure to respond to past sentences rule out community options.•
Personal mitigation (relating to an offender’s condition, circumstances, response to prosecution, and good character) plays a crucial part in cases that result in non-custodial sentences, but are on the borderline with custody.•
Sentencers are not sending people to prison for lack of satisfactory or appropriate community options; they say that they impose community penalties whenever the facts of a case merit it.•
While sentencers are generally satisfied with the quality and range of community sentences, and with the management and enforcement of these sentences, there are widespread concerns that the Probation Service is under-funded.•
Community sentences that carry the provision for review, such as Drug Treatment and Testing Orders, are favoured by sentencers.•
Sentencers say that they are able to resist pressures to ‘get tough’ from the media and the public, and that it is critically important to do so. At the same time, they feel they have a duty to ensure their sentencing decisions reflect and reinforce the norms of wider society.x
Key conclusions
The best way of bringing down the prison population is to issue guidance to sentencers to use imprisonment less often, and where it is used, to pass shorter sentences. Providing a wider range of tougher and more demanding community penalties will probably result in ‘net-widening’ – where the new sentences are used with offenders who would previously have been fined, or served a conventional community penalty.There is a need to improve
sentencers’ and the public’s awareness of community penalties and their benefits.The courts should make more use of fines, freeing up probation resources and deferring the time when the ‘last resort’ of imprisonment has to be used. But above all, there needs to be clear, consistent, political leadership in stressing the need to end the uncontrolled rise in the prison population.
The study
At a time when crime has been falling, the prison population in England and Wales has been rising steeply.Today, England and Wales have the highest per capita prison rate in the European Union. Prisons are overcrowded, budgets are stretched to the limit. Despite this, there has been remarkably little debate about the reasons for this increase, and whether ways can be found of putting a stop to it.
Whether to restrict prison numbers is a contentious and thus a political decision. While the case for doing so may be strong, the issue is not explored by this study. Rather, the starting point of the research is the assumption that politicians may wish to curb the use of imprisonment in this country and that if so, they need to know the best ways of doing so. Thus, the study’s main aims were to look at what might discourage the use of custody by sentencers, and what might encourage the use of non-custodial alternatives, thereby reversing the rise in the prison population.To this end, the study explored the process by which
sentencing decisions are made by judges and magistrates – particularly in relation to cases that are on the borderline between custody and community sentences.
As a preliminary, the study analysed Home Office statistics on convictions and sentencing, and reviewed other relevant academic and policy research.
The core of the study comprised interviews with sentencers. Eleven focus groups were organised for a total of 80 magistrates.Those who took part also completed a detailed questionnaire that asked about sentencing decisions and explored views on non-custodial penalties. One-to-one interviews were carried out with 48 Crown Court judges, recorders and district judges. Interviewees were asked to provide details of four cases which lay on the ‘cusp’ between custody and community penalties. Five members of the senior judiciary were also interviewed.
Explaining the rise in the prison population
courts increased from 5% to 16%. Use of custody by the Crown Court rose from 46% to 64%.
The average length of sentence passed by magistrates’ courts was slightly lower in 2001 than it was ten years before. Over the same period the average length of sentences passed by the Crown Court has increased.There has been greater use of long sentences at the expense of middle-range sentences. Within offence categories, sentence length has increased, particularly in relation to convictions for sexual offences and burglary.
Other factors relevant to the prison population include a large increase in the number of defendants found guilty of drugs offences. Some procedural changes have pushed up the prison population, including changes in committal practice and in parole and automatic release.There was a decline in the use of fines, which may have contributed to the prison population since offenders who receive community penalties (rather than fines) early in their criminal careers exhaust the alternatives to prison more rapidly.
Tougher sentences
The increases in custody rates and sentence length strongly suggest that sentencers have become more severe.This greater severity undoubtedly reflects, in part, a more punitive legislative and legal framework of sentencing. Legislation, guideline judgements and sentence guidelines have all had an inflationary effect on sentences passed. At the same time, the climate of political and media debate about crime and sentencing has become more punitive, and is also likely to have influenced sentencing practice.
The five members of the senior judiciary who took part in the study were unanimous in saying that sentencing practice had become more severe, and that this was at least in part a response to political and media pressure on judges and magistrates. Crown Court judges and recorders also tended to refer to external pressures on them to pass tougher sentencing. District judges and magistrates were less likely to talk in terms of sentencing becoming more severe. Magistrates in particular tended to say that sentencing practice had remained
unchanged, but that there had been a shift in the nature of cases coming before them.
Whether or not they responded to pressure to pass tougher sentences, almost all of those interviewed were aware of these pressures. Several referred to ‘mixed messages’ coming from politicians and the senior judiciary, with calls for tougher sentences contradicting calls on sentencers to use prison less.
Perceptions of offending
Sentencers, and magistrates in particular, were more inclined to cite changing patterns of offending, rather than changing sentencing practice, as the underlying cause of the rise in the prison population. While there has been no significant shift in the ‘offence mix’ of cases coming before the courts, it is possible that statistics on convictions mask some changes in offending behaviour that impact on sentencing.
These changes may be of two main kinds: offenders may be more prolific, and offences within offence categories may be more serious.There is very little statistical support for this, but the views of sentencers were strongly held, and may have some plausibility, given, for example,
xii
increases in problematic drug use and in binge drinking. But it may also be that their views have been shaped by the increasingly punitive climate.
Certainly, sentencers’perceptionsof changing patterns of offending, whatever the extent to which these perceptions are based on actual changes in offending behaviour, are a factor in sentencing practice.The perceptions are thus real in their consequences: if sentencers regard offending behaviour as more serious than hitherto, one might expect them to pass heavier sentences than hitherto.
Sentencing decisions
Sentencers who took part in the study were asked how they had made decisions in cases on the ‘cusp’ between custodial and non-custodial sentences. It emerged that where a decision was made to impose custody, this was usually based on considerations of the seriousness of the offence, and/or the criminal history of the offender. (The latter played a particularly important part in magistrates’ courts.) Hence the use of custody as a ‘last resort’ had two meanings for sentencers: first, it could refer to the nature of the offence itself; secondly, it could refer to the history of the offender, who might be convicted for a relatively minor offence but was deemed to have run out of options because of the number of past convictions.
In contrast, a wider range of factors were of greatest significance in cusp cases resulting in non-custodial sentences. Issues relating to the present circumstances and condition of the offender were viewed as particularly important in such cases. So too were the offender’s response to prosecution (for example, in terms of a show of remorse or willingness to co-operate with the courts) and his or her status as being ‘of previous good character’.This emphasis on personal mitigation makes the sentencing process a highly subjective one, in which the sentencer has to make assessments about the attitudes, intentions and capabilities of the offender; assessments which feed judgements about responsibility and culpability.
Sentencers did not identify a lack of satisfactory community options as a factor tipping
decisions towards custody in cusp cases. According to the analysis of the cusp cases described by the sentencers, only in two of 150 cases that went to custody was a lack of community options cited as a key factor in the sentencing decision.The sentencers stressed that they pass community sentences whenever the facts of a given case make a non-custodial sentence an option.
Community penalties
For the most part, sentencers expressed their satisfaction with the range and content of community sentences available to them.There was strong support for the DTTO, which was felt to be a demanding and potentially constructive sentence. Some sentencers were equally enthusiastic about curfew orders, while others had mixed feelings about these. Many were poorly informed about them.
Some sentencers were poorly informed about the full range of community penalties and about their benefits. Most recognised that the general public were ill-informed about most community penalties.This suggests a need to improve awareness of community penalties both amongst sentencers and amongst the wider public.
Conclusions
Whether the growth of the prison population should be contained is a political decision that falls beyond the boundaries of this study. But if there is some political will to do so, then success in reducing prison numbers will depend on changes both to sentencing practice and to the context in which sentencing is carried out.
One approach that has been tried by successive governments is to provide sentencers with a wider and more attractive range of community penalties.This may go some way to reducing prison numbers. However sentencers in this study did not say that they were using prison for want of adequate non-custodial options.The enhancement of community penalties could simply result in ‘net-widening’ – where the new sentences are used with offenders who would previously have been fined, or served a conventional community penalty.
Encouraging the use of fines could prove a sensible option.This would relieve pressure on the probation service; in terms of outcomes it could at best deflect some offenders entirely from further offending without resort to imprisonment or community penalties; and at worst it could defer the point in their criminal career where prison becomes inevitable.
The analysis presented here suggests that policies to restrict prison numbers should involve three levels of intervention:
•
Adjustment to the legal and legislative framework of sentencing, so as to bring down custody rates and sentence lengths.•
Softening of the climate of political and public opinion on crime and punishment, so that sentencers feel at liberty to make more sparing use of custody, and greater use of the alternatives to custody.•
Improving understanding of the range of non-custodial penalties – including the fine – both among sentencers and the wider public.However, none of these interventions is likely to meet with much success unless there is clear political will to stop the uncontrolled growth in prison numbers, and visible, consistent, political leadership in stressing the need to do so.
1 This study restricts itself to sentencing in England and Wales because Scotland and Northern Ireland have separate criminal justice systems.
2 The White Paper identifies the size and cost of the prison population as features of the current sentencing system under the heading ‘What is not working’
1
This study addresses one of the central problems facing contemporary penal policy. At a time when crime has been falling, the prison population in England and Wales1has been rising
steeply and progressively. Prisons are overcrowded, budgets are stretched to the limit. Despite this, there has been remarkably little debate about the reasons for this increase, and whether ways can be found of putting a stop to it.This study is intended to go some way to filling the gap.
It should be said at the outset that there are several policy options open to a government faced with a rising prison population. Seeking to halt or reverse that rise is not the only option. Other approaches can be adopted: for example, the American criminal justice system has over the last two decades financed and built prisons on an unprecedented scale. In this country too, there has been heavy investment in prison building – though not at the rate of the United States.
This study did notset out to answer the question whether increased investment in prisons makes sense as a crime control strategy. Rather, it was premised on the idea that politicians actually want to curb the prison population, and it aims to examine the most effective ways that changes in sentencing can contribute to this. Politicians have expressed concern about rising prison numbers, for example in the White Paper,Justice for All2 (The Stationery Office,
2002). So too have senior officials in the Prison Service and senior members of the judiciary. The financial burden on society of maintaining such a large prison population is heavy: in 2001, the cost per prisoner was £35,939 (Home Office, 2003); and the cost of providing a single new prison place is around £100,000. Finding effective ways of stabilising or reducing the prison population thus seemed a sensible research objective.
There is plenty of research evidence that bears on the question whether restricting prison numbers is a better policy option than investing in more prisons.The consensus amongst criminologists is that crime rates are less responsive to changes in the severityof punishment than they are to the likelihoodof punishment (see von Hirsch et al., 1999, for a review). Certainly prison does not out-perform community penalties in terms of reconviction rates (Prime, 2002).The benefits achieved by prisons in keeping offenders out of circulation – or their ‘incapacitation effects’ – are also reckoned to be marginal (Goldblatt and Lewis, 1998). However it is not proposed to review this evidence any further here. Although the study is premised on the idea that unchecked growth of the prison population represents a poor investment of finite resources, it is accepted that decisions about the value of extending the use of imprisonment are contentious ones, and thus, properly, political ones. However those politicians who advocate greater use of imprisonment as a crime control strategy – or who are not concerned by rising prison numbers – will find little of use to them in this report.
Background to the study
In 1991, the average daily prison population in England and Wales was 45,897. By 2 May 2003, the prison population had increased by more than half to a total of 73,012.The number of adults in prison (that is, excluding offenders aged 15 to 20) increased at a similar rate from a
Introduction
3Sources: 1991 (Home Office 2003); 2003 (HM Prisons, 2003 www.hmprisonservice.gov.uk/statistics).
4 The Esmée Fairbairn Foundation have funded comparable Scottish research as part of their Rethinking Crime and Punishment Initiative which will be published in 2004.
5 Problems are associated with lack of oversight, lack of purposeful activity and with having to move people from prison to prison.These are exacerbated by staff shortages and sickness rates. See also Levenson (2002).
2 Chapter One
daily average of 36,246 in 1991 to 61,971 on 2 May 2003.3 This rate of increase has been
unprecedented, although it follows a general upward trend since the 1940s (Home Office, 2003). It has occurred against a backdrop of gradually declining crime rates since the mid-1990s, according both to recorded crime figures and to the crime counts derived from the British Crime Survey (see Simmons and colleagues, 2002).
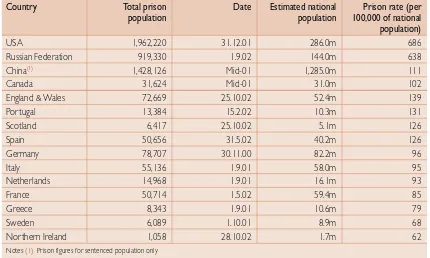
By October 2002 England and Wales had the highest prison rate in western Europe, at 139 prisoners per 100,000 of population.This compared with a rate of 85 in France and 96 in Germany. Only Portugal, Scotland4and Spain, of western European countries, had comparable
rates: at 131, 126 and 126 respectively.The prison rate of the United States, in contrast, was much higher, at 686 per 100,000 population.Table 1.1 provides a comparison of prison rates across a selection of European and other countries.
[image:17.595.69.499.365.623.2]Attempts have been made to compare different countries’ use of imprisonment in relation to their crime rates, rather than their overall populations. Such a league table would show Britain in a slightly more favorable light, as its crime rates are relatively high. But the problems in deriving genuinely comparable statistics on this basis are considerable. Research reported in Tonry and Frase (2001) suggested that variations in the imprisonment rate in different countries are to be explained not by variations in crime rates but through differences in sentencing policy and practice.
Table 1.1. Prison rates: International comparisons
Country Total prison Date Estimated national Prison rate (per
population population 100,000 of national
population)
USA 1,962,220 31.12.01 286.0m 686
Russian Federation 919,330 1.9.02 144.0m 638
China(1) 1,428,126 Mid-01 1,285.0m 111
Canada 31,624 Mid-01 31.0m 102
England & Wales 72,669 25.10.02 52.4m 139
Portugal 13,384 15.2.02 10.3m 131
Scotland 6,417 25.10.02 5.1m 126
Spain 50,656 31.5.02 40.2m 126
Germany 78,707 30.11.00 82.2m 96
Italy 55,136 1.9.01 58.0m 95
Netherlands 14,968 1.9.01 16.1m 93
France 50,714 1.5.02 59.4m 85
Greece 8,343 1.9.01 10.6m 79
Sweden 6,089 1.10.01 8.9m 68
Northern Ireland 1,058 28.10.02 1.7m 62
Notes (1) Prison figures for sentenced population only
Source: Walmsley (2003)
The size of the prison population creates a range of problems for the Prison Service.
Rehabilitation becomes an increasingly difficult aim to achieve as the prison population grows, since efforts to carry out educative and therapeutic work with offenders are hampered by the inevitable problems of overcrowding and the excessive burdens made on prison staff.5
6 19 December 2002.
7 The generic term used in this report for magistrates, district judges, recorders, Crown Court judges and senior judges.
The Decision to Imprison
11,204 prisoners were held two to a cell designed for one (Home Office, 2003). In response to this problem, the Government announced in late 2002 that funding was being made available to provide additional prison places, including through the construction of two new prisons in Ashford and Peterborough (Home Office, 2002b).
It has frequently been observed that short (i.e. less than 12 months) custodial sentences bring little benefit either to the offender or wider society. Offenders who receive sentences of under 12 months serve half or less of the period in prison, and do not have the opportunity to undertake prison-based programmes. On release, adult offenders do not receive support or supervision from the Probation Service. Lord Woolf argued in his judgement in the burglary case of McInerney and Keating6that the shortness of these sentences was a factor
which justified the greater use of community penalties. Short sentences also impose a particular logistical and administrative burden on the Prison Service.The Review of the Sentencing Framework(Home Office, 2001) emphasises the inadequacies of short sentences; likewise the Home Secretary has observed that:
Short custodial sentences provide little or no opportunity to change the behaviour and problems which put offenders there in the first place and they can have a long term adverse effect on family cohesion, on employment and on training prospects – all of which are key to the rehabilitation of offenders.(Blunkett, 2001)
Aims of the study
The project’s starting point was that the rise in imprisonment has triggered very considerable expenditure, whilst yielding few benefits in terms of crime reduction.Thus, the main aim was to look at what might discourage the use of custody by sentencers,7 and what might
encourage the use of non-custodial alternatives, thereby reversing the rise in the prison population.To this extent the study was conducted to an agenda.The study was mounted in partnership with the Prison Reform Trust (PRT). Getting the research off the ground was a collaborative enterprise, as was the dissemination of the results. However, to ensure its integrity, the research was carried out completely independently both of PRT and other bodies. It was agreed from the outset that the Trust would have no control over the content of any reports on the study. And whilst the report draws on Home Office and Prison Service statistics, and whilst government departments were kept informed of the work, the research team were in no sense accountable to them for the use we have made of these figures.
The study had five subsidiary aims:
•
To explain the recent rise in the prison population;•
To identify the factors that tip a sentencing decision towards or away from the use of custody;•
To consider whether new or amended non-custodial penalties would help reduce sentencers’ reliance on custody;•
To explore the impact of the social and political climate on sentencing decisions; and•
To produce recommendations on how to change sentencing practice so as to reduce the prison population.4 Chapter One
The study pursued its aims through two broad lines of enquiry. It reviewed patterns and trends in adult sentencing in magistrates’ courts and in the Crown Court, and it explored sentencers’ decision processes – particularly in relation to cases that are on the borderline between custody and community sentences.
By combining these two levels of analysis – that is, of general sentencing practice and specific sentencing decisions – the study set out to produce a rounded view of the many and complex issues that bear on sentencing and the use of custody.The focus of this study is on the sentencing of adult offenders only. However, many of the issues explored and conclusions drawn have direct relevance also to the sentencing of young offenders.
Methods
The study involved:
•
The analysis of Home Office statistics over the past decade on criminal convictions, sentencing, and the prison population;•
A review of academic and policy research on sentencing – for the most part, UK-based research;•
Focus groups with magistrates, supplemented by questionnaires distributed to participants, covering:– Their understanding of why the prison population has increased;
– The social and political factors that impinge on sentencing decisions;
– The nature of the decision-making process;
– Their views on the range and quality of existing non-custodial penalties, and gaps in current provision; and
– The factors that had determined whether or not to sentence offenders to custody in specific borderline cases they had dealt with.
•
One-to-one, semi-structured interviews with Crown Court judges, recorders and district judges covering the same topics as the magistrates’ focus groups and questionnaires;•
One-to-one, semi-structured interviews with senior judges addressing the question of why the prison population has risen and their views on sentencing practice in general.The focus groups and interviews with sentencers were carried out in six parts of England and Wales, selected to provide a regional spread and a range of urban and rural areas:
East Midlands Greater London North and East North West South West South Wales
8 Of the eleven magistrates’ benches, five were high users of imprisonment while four were low custody users.Their respective committal rates disproved the notion that there might be a simple correlation between low use of committals and high use of immediate imprisonment (and vice versa).
The Decision to Imprison
[image:20.595.104.527.149.354.2]bench (except in one case, in which it was not possible to arrange a group within the study’s time-frame). A total of 80 magistrates took part in the 11 focus groups, and 69 questionnaires were returned by the participants.Table 1.2 provides details of the magistrates’ benches involved in the focus groups.8
Table 1.2. Choice of magistrates’ courts(1)
Total Sentenced at the magistrates’ court Committed to
proceeded Crown Court
against for trial (%)
Total Immediate High or
custody (%) low custody user
North West A 1,653 783 18 High 8
South Wales A 1,327 538 16 High 15
North and East A 995 510 15 High 13
South West A 1,975 855 14 High 19
Greater London A 703 369 14 High 17
East Midlands A 671 372 13 High 15
North and East B 1,152 617 10 Low 13
South West B 663 365 9 Low 13
Notes(1) All indictable offences, persons aged 21 and over - 1999 figures
Figures provided by Home Office Research Development and Statistics Directorate
One-to-one interviews were held with Crown Court judges, recorders and district judges based in each of the fieldwork regions. For the most part, the sentencers were contacted through local Crown Court centres and magistrates’ courts. A total of 48 interviews were held: 17 with Crown Court judges, 12 with recorders and 14 with district judges. (Among the district judges, four were also recorders, but for the purposes of analysis, these sentencers are included in the district judge category.) Additionally, five members of the senior judiciary were interviewed in London.
As noted above, the magistrates’ questionnaires and the one-to-one interviews incorporated questions about how the respondents had made specific sentencing decisions.This has
allowed the study insight into the key factors that tend to determine whether or not custodial sentences are passed; previous studies of sentencing have rarely focused on actual sentencing decisions, instead focusing more on hypothetical cases – exceptions being Flood-Page and Mackie (1998) and Parker, Sumner and Jarvis (1989).
Outline of the report
Chapter 2 of the report examines the statistics on sentencing and on the prison population, aiming to account for the growth in the prison population over the past 10 years. In particular, it looks at changes in custody rates and the length of prison sentences.The chapter presents a great deal of statistical material, much of which is hard for the non-specialist to grasp. It reaches the conclusion that the increase in the prison population is largely a function of sentencers’ greater use of custodial sentences and their use of longer prison terms. Readers who do not need convincing of this conclusion should pass quickly to Chapter 3.
6 Chapter One
Chapter 3 considers the possible root causes of the changes in sentencing practice that have led to the rise in the prison population. It draws both on the existing research literature and on the views of sentencers interviewed for this study. More specifically, the chapter tests the arguments that the growth in the prison population has been brought about by greater severity on the part of sentencers and that it is a result of changes in patterns of offending.
9 ‘Adults’ includes all those aged 21 and over.
10Source: Prison Statistics England and Wales Table 1.9 (Home Office, 2003).
7
Accounting for the growth in the
prison population
2
The focus of this report is on changes in the adult prison population.9The aim of this chapter
is to account for the 71% rise in the adult prison population that occurred between 1991 and 2003. It examines trends in numbers of convictions, remand rates, convictions, custody rates, committal practice and release policy. Also included is an examination of changes in the use of non-custodial penalties.
The prison population
There are two factors that determine the size of the prison population. First there is the ‘flow’ of sentenced offenders going into prison.This is a product only of the number of offenders appearing in court, and the proportion of these who get remanded or sentenced to
imprisonment.Then there is the ‘stock’ of prisoners – the prison population on any one day – which is a product of the flow into prison, coupled with the length of time actually served. Adults make up the vast majority of the overall prison population (84%), partly because they are more likely than young offenders to attract custodial sentences, and partly because when they do, they serve longer sentences.
Table 2.1 shows the make-up of the total sentenced prison population in 2001.The top half of the table shows receptions, or the flow of offenders into prison. Theft and motoring offences are the largest offence groups. The bottom half of the table shows the population, or the stock of offenders in prison, on 30 June 2002. Here the proportionate contribution of offences of violence, robbery and sexual offences is larger, because these categories can attract long sentences. Figures are for prisoners of all ages but they exclude those on remand.
While the vast majority of prisoners are male, the adult female prison population has grown much more rapidly over the past decade. Between 1991 and 2001 the adult male sentenced population rose from 28,606 to 42,998, an increase of 50%. Over the same period, the equivalent female population rose by 143% from 1,033 to 2,508.10
8 Chapter Two
Table 2.1. Make-up of the prison population (all ages), 2001
Violence Sexual Burglary Robbery Theft Fraud Drug Motoring Other Total(1)
against offences and and offences offences offences
person handling forgery
Receptions into prison 2001
Male 12,757 2,353 9,633 3,778 19,463 2451 6,513 14,838 9,972 81,758
% 15 3 12 5 23 3 8 18 12 100
Female 878 19 256 282 2873 537 1,009 383 857 7,094
% 12 0 4 4 40 7 14 5 12 100
Sentenced prison population 30 June 2001
Male 11,198 5,039 8,361 6,561 4,150 893 7,936 2,630 3,678 50,446
% 22 10 17 13 8 2 16 5 7 100
Female 439 25 154 252 434 127 1,132 – 273(2) 2,836
% 15 1 5 9 15 4 40 – 10(2) 100
Notes (1)Totals exclude those held for offence not recorded and in default of payment of a fine
(2)Includes motoring offences
[image:23.595.73.498.343.525.2]Source: Prison Statistics England and Wales 2001 Tables 1.7a, 3.8 and 4.5 (Home Office, 2003).
Table 2.2. Prison(1)and general populations (all ages) of England and Wales –
ethnic breakdown
Percentage (on 30 June) White Black South Asian Chinese
and other 1991
Male – prison population 84 10 3 2
Female – prison population 70 24 2 4
Male – general population 94 2 3 1
Female – general population 94 2 3 1
2001
Male – prison population 79 13 3 4
Female – prison population 73 21 1 4
Male – general population 93 2 3 2
Female – general population 94 2 3 1
Notes(1) Figures relate to prisoners of all ages.
Source: Prison Statistics England and Wales 1991 Table 1.13 and 2001 Figure 6.2 (Home Office 1993; 2003). General population figures are census-based, and cover all ages.
The Decision to Imprison
Table 2.3:Average adult (21 and over) prison population(1) (2)
Year Average % change on Year Average % change on
1991 1991
1991(3) 36,246 – 1997 49,732 +37
1992(3) 36,775 +2 1998 53,302 +47
1993(3) 36,130 - <1 1999 52,937 +46
1994(3) 39,712 +10 2000 52,912 +46
1995(3) 41,768 +15 2001 54,376 +50
1996 44,992 +24
Notes(1)Average adult sentenced population in custody plus average adult population on remand (excludes all non-criminal prisoners).
(2) Includes all remand prisoners in Prison Service establishments aged 21 and over.
(3) Excludes remand prisoners in police cells (Remand prisoners were not kept in police cells from 1996 onwards).
Source: Prison Statistics England and Wales 2001,Tables 1.4 and 2.1. (Home Office 2003).
One possible factor in the increase in the prison population is a greater use of remand.The adult remand population grew by more than a third from 1991 to 1994. However, these changes predated the largest rises in the total adult prison population.The level of remand has since stabilised and in 2001 it stood at a rate lower than the 1994 figure at 8,890 (Home Office, 2003:42).These figures are shown in Table 2.4.
Table 2.4:Average population of adult (21 and over) remand prisoners in custody(1) (2)
Year Average % change on Year Average % change on
1991 1991
1991 6,665 – 1997 9,153 +37
1992 6,824 +2 1998 9,631 +45
1993 7,943 +19 1999 9,590 +44
1994 9,235 +39 2000 8,667 +30
1995 8,517 +28 2001 8,890 +33
1996 8,672 +30
Notes(1) All remand prisoners in Prison Service establishments aged 21 and over
(2) Excludes remand prisoners in police cells (Remand prisoners were not kept in police cells from 1996 onwards).
Source: Prison Statistics England and Wales 2001,Table 2.1 (Home Office, 2003).
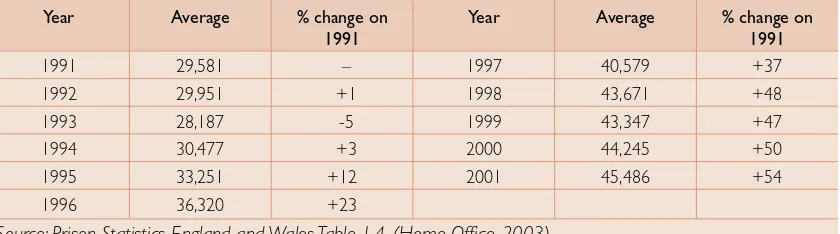
From 1991 to 2001 there was a 54% increase in the average sentencedpopulation (Table 2.5). This amounts to nearly 16,000 people.The average remand population increased by a third or 2,000 people over the same period. Thus while the remand population is much larger than it was a decade ago, in terms of total prison numbers, the rise in the sentencedprison
population has had far more impact.This is why the current study focuses on decisions relating to sentencing rather than remand.
[image:24.595.101.525.372.512.2]Table 2.5:Average population of adult (21 and over) sentenced prisoners in custody
Year Average % change on Year Average % change on
1991 1991
1991 29,581 – 1997 40,579 +37
1992 29,951 +1 1998 43,671 +48
1993 28,187 -5 1999 43,347 +47
1994 30,477 +3 2000 44,245 +50
1995 33,251 +12 2001 45,486 +54
1996 36,320 +23
Source: Prison Statistics England and Wales Table 1.4. (Home Office, 2003)
Convictions
The most obvious explanation for the increase in the sentenced prison population is that the courts are dealing with more offenders. However, this has not been the case for the last decade. Although there have been data collection problems in some areas for many years (Home Office, 2002a, appendix 2), the general trend in the number of convictions has been downward. For 1991 the recorded adult total was 1.2 million (Home Office, 1992:101). By 2001 the figure was down 11% to just under 1.1 million (Home Office, 2002a:45). Over the same period the number of adults found guilty of indictable offences fell by 1% from 220,000 to 217,400 (Home Office, 1992:100; 2002a:44).
While the number of convictions is down, it is possible that the distribution of offences has altered in such a way as to drive up the prison population.This would happen, for example, if the overall downward trend masked a rise in cases involving serious crimes.To test for this, Table 2.6 compares the offence mix of courts’ workloads in 1991 and 2001.
The breakdown of convictions has not altered in a way that suggests a direct relationship to the increased use of custody. For example, the number of convictions for violence against the person,11sexual offences and burglary has fallen substantially.The one notable exception is a
very large increase in the number of convictions for drugs offences (see also Corkery, 2002). A sizeable proportion of these will have been given custodial sentences (see below).There has also been a rise in robbery, although this offence represented just one per cent of all those found guilty for indictable offences in both 1991 and 2001.
11Some of this will reflect a charging standard for assault introduced on 31 August 1994 which moved some offences to summary common assault.
12Correspondence with Home Office Offending and Criminal Justice Group (April 2003).
[image:26.595.99.525.89.299.2]The Decision to Imprison
Table 2.6.Adults (21 and over) found guilty at all courts – by offence group
Offence group Indictable offences 1991 2001 % change 1991 (%) 2001 (%)
Violence against the person 32,600 22,100 -32 15 10
Sexual offences 4,700 3,000 -36 2 1
Burglary 22,300 13,500 -40 10 6
Robbery 2,300 2,600 +13 1 1
Theft and handling 87,500 86,100 -2 40 40
Fraud and forgery 16,900 14,700 -13 8 7
Criminal damage 6,300 6,000 -5 3 3
Drugs offences 17,200 33,000 +92 8 15
Other offences 21,800 30,500 +40 10 14
Motoring offences 8,400 5,800 -31 4 3
Total 220,000 217,400 -1 100% 100%
Indictable offences 220,000 217,400 -1 18 20
Summary offences 996,600 868,300 -13 82 80
All offences 1,216,700 1,085,800 -11 100% 100%
Notes (1)There were shortfalls in the number of offenders found guilty in 1994, 1996, 1999, 2000 and 2001 (see Home Office, 2002a: Appendix 2).
Source: Criminal Statistics England and Wales 1991 and 2001 (Home Office, 1992,Table 5.9 and Home Office, 2002a,Table 5.7).
While the total number of those found guilty has fallen, within offence groups it is possible that changes in the seriousness of offending may have made custody more likely.There are two possibilities here. Firstly, there may have been an increase in the more serious offences within an offence group(e.g. more murders within ‘violence against the person’). However, analysis of statistics by the Home Office has not found much evidence of this.12The second
possibility is that serious offences within an offence typeare now more serious (e.g. a ‘typical’ actual bodily harm is now more serious).This unfortunately cannot be tested by looking at the statistics, but is an issue that was explored in discussions with sentencers (see Chapter 3).
The rise in the prison population cannot be explained by greater use of remand. Similarly, it is not the result of more convictions or of changes in the broad offence breakdown of those found guilty – though the very large increase in those found guilty of drugs offences has had some impact. If these elements cannot explain the bulk of the rise in the prison population, this suggests that the key sentencing factors must be one or both of the following:
a) increased custody rate at the courts
b) increased length of sentences passed by the courts.
Some other factors may have also played a part, however – particularly changes in committal practice and in the proportion of sentences actually served, arising from changes in practice in relation to parole, automatic conditional release and other forms of early release.The chapter will return to these issues once it has considered changes in custody rates and sentence lengths.
12 Chapter Two
Custody rates
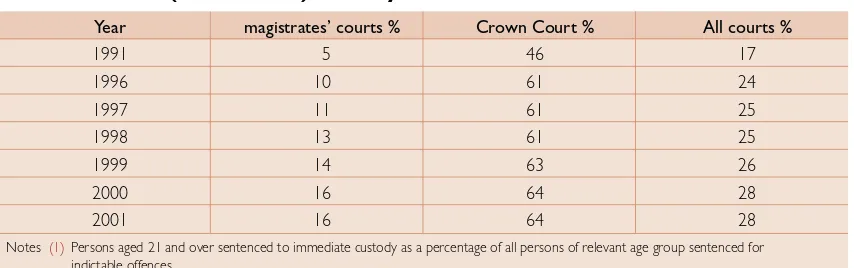
[image:27.595.72.499.151.285.2]The custody rate at court is simply the proportion of those found guilty who are given a custodial sentence.The rates recorded for adults by both magistrates’ courts and the Crown Court are shown in Table 2.7.
Table 2.7.Adult (21 and over) custody rate at the courts(1)
Year magistrates’ courts % Crown Court % All courts %
1991 5 46 17
1996 10 61 24
1997 11 61 25
1998 13 61 25
1999 14 63 26
2000 16 64 28
2001 16 64 28
Notes (1)Persons aged 21 and over sentenced to immediate custody as a percentage of all persons of relevant age group sentenced for indictable offences.
Source: Criminal Statistics England and Wales 2001 Table 7.13 (Home Office, 2002a)
The overall adult custody rate in 2001 was approaching twice the 1991 level at 28%. Over the same period the custody rate for magistrates’ courts increased more than three times from 5% to 16%. Use of custody by Crown Courts similarly rose from 46% to 64%.Table 2.8 shows how this increased reliance on imprisonment is broken down by offence group.
The Decision to Imprison
Table 2.8.Adult (21 and over) custody rate at the courts by offence group – 1991 and 2001(1)
Magistrates’ courts The Crown Court
Offence group 1991 2001 1991 2001
Male Female Male Female Male Female Male Female
% % % % % % % %
Violence against the person(2) 5 2 19 10 47 20 61 34 Sexual offences 4 – 25 17(3) 69 43(3) 77 39(3)
Burglary 15 9 40 27 56 27 79 60
Robbery * * * * 88 60 92 79
Theft and handling 6 2 23 14 36 19 59 40
Fraud and forgery 6 2 18 9 42 23 57 34
Criminal damage 5 4 8 5 36 13 43 28
Drugs offences 2 1 4 4 55 39 73 60
Other offences 4 2 10 6 41 21 53 33
Motoring offences 2 1 10 4 49 8(3) 62 42(3)
Total indictable offences 6 2 17 11 48 23 66 45
Notes(1)Up to 1992 includes partly suspended sentences given for principal offences; the full length (i.e. the suspended and the unsuspended part) is included.
(2)A charging standard for assault was introduced in 1994 which led to increased use of the summary offence of common assault.
(3) Based on less than 100 females sentenced.
Source: Criminal Statistics England and Wales Tables 7.15 and 7.16 (Home Office, 2002a).
Breaking down the broad offence groups into narrower categories, more specific patterns emerged. Using figures for all offenders, irrespective of age, there have been the following increases in custody rates:
1991 2001
Burglary in a dwelling: 37% 60%
Burglary not in a dwelling: 21% 37%
Wounding Section 20 – Grievous Bodily Harm: 28% 54% Wounding Section 47- Actual Bodily Harm: 10% 27% Driving whilst disqualified (magistrates’ courts): 18% 47% (Figures provided by Home Office RDS)
Sentence length
As discussed above, the ‘flow’ of sentenced offenders going into prison is a product only of the number of offenders appearing in court, and the proportion of these who get remanded or imprisoned.The ‘stock’ of prisoners – the prison population on any one day – is a product of the flow into prison, coupled with the length of time actually served. Sentence length is a key determinant of the size of the prison population.
However, identifying trends in sentence length is not straightforward.The rapid rise in the proportion of offenders sent to prison means that those who previously might have been given a community penalty are now serving short prison sentences, typically for six months or less.This has the effect of masking any increases in other sentence length categories.The average length of adult sentences fell between 1991 and 2001 (Home Office, 2003:93). In 1991 the average length was 19 months. By 1994 this had fallen to 15.7 and by 2001 it was
13Figures exclude those sentenced to life imprisonment.
14Assuming that the lifer serves about 13 years, and that the average sentence in magistrates courts is about three months.
15Population at June 30. (Prison Statistics England and Wales, 2001,Table 5.1 – Home Office, 2003:100).The increase in the late 1990s has been influenced by the Crime (Sentences) Act 1997 which stipulates an automatic life sentence for a second serious violent or sexual assault.
14 Chapter Two
15.4 months.13In order to identify trends within different sentence length categories Figure 2.1
[image:29.595.71.498.109.403.2]puts adult sentences into three groups by length.
Figure 2.1. Receptions into prison: adults (21 and over) under sentence by sentence length – indexed to 1991 figures
The number of receptions has increased over the past decade for all three sentence length groups. As expected, the rise in prisoners with short sentences is by far the steepest, showing an increase of 139%, from just over 19,000 adults in 1991 to over 46,000 in 2001. Over the same period, those with sentences of 12 months to less than four years increased by 13% from over 15,000 to just over 17,000, while those with four years to life rose by 62% from nearly 4,000 to over 6,000 (see Home Office, 2003:28).
It would be a misreading of Figure 2.1 to suggest that the rise in the prison population can be attributed largely to increases in short sentences. Even if the number of short sentence prisoners increased quickly, they may make a smaller contribution to the total prison population than those serving long sentences. A typical lifer will occupy a prison cell for the same amount of time as a hundred short sentence offenders sentenced in magistrates courts.14Thus the rise of 62% in sentences of four years or more will have had a very
significant impact on the overall population.
Long sentences are almost certainly getting even longer. As discussed above, the difficulty in identifying the trend is that changes in the custody rate tend to increase the proportion of short-sentence prisoners.There has certainly been greater use of life sentences from 1995 onwards (Home Office, 2003:100). By 2001 the number of adults in prison under life sentence was 67% higher than in 1991, an increase from 2,750 to over 4,500.15The best way
of examining trends in sentence length is to look within offence groups, where one can assume a degree of homogeneity over time, at the breakdown of sentence length (Table 2.9).
0 50 100 150 200 250
1991 1992 1993 1994 1995 1996 Year
1997 1998 1999 2000 2001
Source: Prison Statistics England and Wales 2001, Table 1.12 (Home Office, 2003)
Less than 12 months
12 months and less than 4yrs
The Decision to Imprison
Table 2.9 needs careful interpretation.The offence groups where short sentences have
become proportionately more significant are ones where the courts have become more likely to impose custodial rather than community penalties. For example, the growth of short sentences for theft and handling will reflect the fact that offenders who previously would have been given fines or community penalties are now getting prison sentences.This offence group did not attract long sentences in either 1991 or 2001.
For those offence groups that show no real change, such as violence against the person, the rise in custody rate has probably interacted with an increase in average sentence length, to cancel out any overall change. In other words, the courts are passing short sentences on a new population of offenders for minor assaults – depressing average sentence lengths – whilst they are increasing the prison terms awarded for more serious violence – increasing average sentence length.
[image:30.595.101.527.399.669.2]Long sentences have clearly become longer in cases of rape and other sexual offences.The proportion getting middle-range sentences has shrunk while the proportion getting long sentences has grown.There is a similar pattern for burglary, except that the shift has been from short sentences to middle-range ones, while in others there has been a shift in the pattern.There is also a rise in life sentences given for robbery, though short sentences have also grown, almost certainly reflecting a rise in the custody rate. When all offence types are combined, the largest increase has been in long sentences at the expense of middle-range offences.
Table 2.9. Proportional changes in use of long or short sentences in terms of offence group (adults 21 and over) – 30 June 1991 to 30 June 2001(1) (2)
Sentence Violence Rape Other Burglary Robbery Theft Drugs Other Offences Total
length against sexual and offences offences not
the offences forgery recorded
person
Up to and inc. 3mths +1 – – – +1 +7 – +14 -2 +2
> 3mths to 6mths +1 – – -1 – +9 -1 +5 – +1
> 6mths to 12mths – – – -5 – +1 -2 -5 – -3
> 12mths to 18mths – – -1 -9 – -7 -2 -2 +1 -4
> 18mths to 3yrs -1 -3 -1 -1 – -7 +2 -6 +1 -3
> 3yrs to 4yrs +1 -4 – +10 +4 -1 +7 -1 +2 +3
> 4yrs to 5yrs +1 -8 – +5 +3 – +2 -2 -1 +2
> 5yrs to 10yrs -1 +1 +2 +1 -8 -2 -8 -4 -2 –
> 10yrs but < life -1 +8 +2 -1 -2 – +2 – -1 +1
Life -1 +6 – – +2 – – – +1 +1
Longer or No Longer Longer Longer Gener- Shorter No Shorter No
Gener-shorter overall ally overall overall ally
sentences? change shorter change change longer
Notes(1) Where sentence length has become longer or shorter, positive changes are in bold.
(2) Total 1991=29,004; total 2001=44,487 – Where the proportional change was less than 1%.
Source: Prison Statistics England and Wales 1991 Tables 4.1 and 5.1; 2001 Table 4.1 (Home Office, 1993; 2003)
16 Chapter Two
Sentence length by type of court
Figure 2.2 shows how the length of sentence imposed at each venue has altered over time for male offenders guilty of indictable offences.The average length of custodial sentence given by magistrates’ courts showed an increase in the early 1990s, especially for 1993 and 1994. In terms of sentence length this may not appear to be a large change (from 2.6 months, for adult male offenders in 1991, to 3.2 months in 1993). However, the high volume of cases that magistrates deal with may mean that this would have had a significant impact on the total prison population. By 1997 the average male sentence length given by magistrates’ courts was back down to 1991 levels, and even fell slightly below this for 2000 and 2001. While
[image:31.595.73.494.252.505.2]magistrates’ courts were sending more people to prison, the length of sentence was in fact slightly lower in 2001 than it was 10 years before.
Figure 2.2. Average length of sentence given by the Crown Court and by magistrates’ courts for all adult males (21 and over) – all indictable offences
The average length of custodial sentence given by the Crown Court has generally been increasing across the whole period, but especially from 1995 to 2001.The average sentence given to adult males has increased by a third from 20.5 months in 1991 to 26 months in 2001. Such a large increase in Crown Court sentence length will have been a major factor in
increasing the prison population.
Changes in procedure
While the main causes behind the rise in the prison population are identified as changes in the two types of courts’ custody rates and in sentence length, other factors have also had some impact. Important changes relate to committal procedure, and to the way in which practice relating to parole and automatic release have affected the proportion of sentences served in prison.
Source: Criminal Statistics England and Wales 2001, Tables 7.15 and 7.16 (Home Office 2002).
Notes (1) Up to 30 September 1992, includes partly suspended sentences given for principal offences; the full length (i.e. the suspended and the unsuspended part) of such sentences is included.
(2) A charging standard for assault was introduced on 31 August 1994, which led to theincreased use of the summary offence common assault.
(3) Excludes life sentences.
0 5 10 15 20 25 30
1991 1992 1993 1994 1995 1996 1997 1998 1999 2000 2001
The Crown Court
Magistrates’ Courts
20.5 21.2 21.6 21.8
20.6 22.0
20.6
24.2 24.1 24.2 26.0
16Section 49 of the Criminal Procedure and Investigations Act 1996 (with provisions for committal for sentence contained in section 51 of the Crime (Sentences) Act 1997), Home Office (1997).
The Decision to Imprison
Committal practice
The Crown Court deals with a much smaller number of cases than magistrates’ courts, but these are the more serious ones, where use of custody is frequent. Figure 2.2 showed that the Crown Court has been giving increasingly longer sentences. Earlier research has also shown that the Crown Court imposes heavier sentences than magistrates’ courts, even when they are hearing equivalent cases (Hedderman and Moxon, 1992).Thus, a shift in the number or type of cases dealt with at either venue could affect the prison population. Figure 2.3 shows how committal procedure has changed between 1991 and 2001.
Between 1991 and 1997 the number of defendants appearing at the Crown Court for trial ranged from 66,000 to 75,000 and followed no particular pattern.The same can be said for those committed for sentence after summary conviction, which ranged from 2,600 to 5,000. However, the situation changed in 1998 resulting in fewer defendants appearing for trial, but a threefold increase in those being sent from magistrates’ courts for sentence (see Figure 2.3). This was a response to the plea before venueprocedure introduced on 1 October 1997.16
[image:32.595.102.524.389.623.2]Previously, magistrates had to decide on mode of trial without knowing how a defendant intended to plead. From October 1997 defendants charged with offences triable either way had to indicate a plea beforethe mode of trial decision was taken (Home Office, 1997).The result was an increase in the number of defendants committed to the Crown Court for sentence (see also Ayres and colleagues, 2000).
Figure 2.3. Adult defendants (21 and over) committed to trial or sentence at Crown Court
17
Source: Crime Statistics England and Wales 2001, Table 6.7. (Home Office 2002).
Notes (1) Includes “other defendants” i.e. companies, public bodies etc.
0 10 20 30 40 50 60 70 80
1991 1992 1993 1994 1995 1996 1997 1998 1999 2000 2001
Appearing for trial Appearing for sentence after summary conviction
74.3 74.9 69.6 65.9 68.9 71.8 64.0 71.3 59.9 60.3 59.9 4.8 5.0
3.0 2.6 2.8 4.3
15.0 13.9 12.6 3.2
Source: Figures supplied by Home Office Research, Development and Statistics Directorate.
Notes (1) Population at June 30 of each year. Figures are for the type of court originally awarding a custodial sentence: further sentencing may have been awarded at a different court.
(2) The receptions data for 1991 to 1992 include estimates for cases where the type of court is not recorded. 1991 and 1992 are subject to a wider margin of error because the numbers of cases where the type of court is not recorded is particularly high.
(p) = provisional.
0 5 10 15 20 25 30 35 40 45
1991(2) 1992(2) 1993 1994 1995 1996 1997 1998 1999 2000 2001 2002(p)
Appearing for trial Appearing for sentence after summary conviction
26.6 26.7 27.2 25.5
32.7 30.1
39.5
36.9 38.1 37.6 38.8 40.3
1.5 1.9 1.9 2.8 2.9
3.6 4.1
7.8 6.2
8.1 3.4 4.1
The Crown Court
Magistrates’ Courts
18 Chapter Two
The total number of adult defendants at the Crown Court was actually less in 2001 than in 1991, falling from 79,100 to 72,500. However, it is not the workload that is of interest so much as the numbers being convicted at each venue. Although the number of adults convicted of indictable offences has remained fairly stable (see Table 2.6 above), the number appearing at the Crown Court for sentence has increased.This is likely to have resulted in the imposition of heavier sentences for these individuals than if they had stayed within the magistrates’ court.
[image:33.595.73.496.201.464.2]The make-up of the prison population in terms of the sentencing venue is shown in Figure 2.4.
Figure 2.4. Adult population (21 and over) in prison by sentencing
While both magistrates’ courts and the Crown Court have been sending more people to custody, it is clear from Figure 2.4 that during the 1990s the rise in the prison population was largely down to Crown Court decisions. From 2000 to 2001 there has been a fall in prisoner numbers resulting from Crown Court decisions, and a rise resulting from magistrates’ courts decisions.
Release policy and practice
Decisions affecting prisoners’ release dates can obviously affect the size of the prison
17This came into force 1 October 1992.
18Quoted in Hood and Shute (2000:4).
19Practice Statement (Crime: Sentencing) [1992] 1 WLR
20Despite a slight dip in 1994, the average length of Crown Court sentences continued to rise through to 1997.
[image:34.595.100.529.97.332.2]The Decision to Imprison 19
Table 2.10. Average length of sentence, in months(1)– all adult males
(21 and over) 1991 and 2001
Adult males 1991 2001
average length Percentage of average length Percentage of of sentence sentence served of sentence sentence served
under sentence under sentence
Up to and including 3 mths 2 42 2.1 39
> 3 mths to 6 mths 5.3 43 4.8 39
> 6 mths but < 12 mths
10.2 41 8.7 37
12 mths 12 38
> 12 mths to 18 mths 16.6 42 16.4 41
> 18 mths to 3 yrs 28 42 28.3 43
> 3 yrs but < 4 yrs
45.7 49 42.3 43
4 yrs 48 54
> 4 yrs to 5 yrs 58.1 49 57.5 55
> 5 yrs to 10 yrs 84.6 53 85.4 53
> 10 yrs but < life 177.2 49 158.2 55
All lengths of sentence less than life 18.4 46 16.3 46
Notes(1) Excludes time served on remand.
Source: Prison Statistics England and Wales 1991 Table 4.15; 2001 Table 4.11 (Home Office, 1993; 2003).
Changes in release policy have contributed to this shift. Firstly, a decision by the Carlisle Review Committee (Carlisle, 1988) led to a risk-based release policy for parole which was then incorporated into the Criminal Justice Act 1991.17As Hood and Shute (2000:4) have
noted, the Carlisle Committee had hoped that this would cause more long-term prisoners to be released earlier. However, by 1993 the Parole Board recognised that this would actually lead to a lower paroling rate (Parole Board, 1994:para 138).18
The Criminal Justice Act 1991 brought about further changes in parole which could have led to longer time served.The most notable change was in the timing of parole eligibility and eligibility for conditional release. Prisoners serving four years or more became eligible for parole at half their sentence, rather than at a third as before (Discretionary Conditional Release). For those serving less than four years, Automatic Conditional Release was introduced at half the sentence (rather than possible parole at a third), to be followed by probation supervision until three-quarters. Coinciding with the implementation of the Act in October 1992, Lord Chief Justice Taylor issued a Practice Statement19which acknowledged
that “…sentences on the ‘old’ scale would under the ‘new’ Act result in many prisoners actually serving longer in custody than hitherto”. He recommended “a new approach” with Crown Court sentencers taking the “actual period likely to be served” into account and taking into account the risk of increasing sentence length following the Act. However, despite this, the average length of sentence given by the Crown Court continued to rise from 199220(see