1142
BAG-OF-SHAPES DESCRIPTOR USING SHAPE
ASSOCIATION BASED ON FREEMAN CHAIN CODE
1EMA RACHMAWATI, 2IPING SUPRIANA, 3MASAYU L. KHODRA 1,2,3
School of Electrical Engineering and Informatics, Institut Teknologi Bandung, Indonesia 1
[email protected], [email protected], [email protected]
ABSTRACT
A novel bag-of-shapes descriptor constructed using shape association is presented in this paper. We believe that shape association has significant impact in constructing better shape representation of object, for the purpose of object recognition. In our proposed model, shape association is represented in the set of representative prototypes, which is generated through K-medoids clustering based on association likelihoods. The association likelihood is obtained through pairwise distance computation using Needleman-Wunsch algorithm, as the shape is represented in sequence of code of Freeman Chain Code. We evaluate our method on a set of 32 fruit subcategories captured in multi viewpoint. We show that our approach can reliably classify the shape of multi-class fruit with average accuracy of 82.96 % using nearest neighbor classifier.
Keywords: Bag-of-Shapes, Freeman Chain Code, Shape Association, K-medoids clustering, Needleman-Wunsch Algorithm, Nearest Neighbor Classifier
1. INTRODUCTION
Representing the shape of object in digital images has been recognized as a difficult task, whereas shape is undoubtedly as an important visual feature. According to this, there were many shape representation approaches developed so far [1][2][3][4]. Meanwhile, it is widely known that to represent an object contour we can use the chain code representation. Chain code as a structural based shape representation, has advantages in handling occlusion problem and allowing partial matching [1]. Chain code is an approach that is widely used to represent digital curves in image analysis, by describing the movement along a digital curve using 8-connectivity or 4-connectivity neighborhood. There were many application which use chain code representation to represent the boundary of geometric shapes, namely [5]–[7] to name a few. Azmi and Nasien [5] used chain code to extract feature of English character. Park et al. [6] also used chain code to represent contour of the object in their application as well. Also, the chain code was used in [7] for a real application in a car plates recognition system.
On the other hand, the concept of representing categories using ideal examples or prototypes rather than a set of formal logical rules, has been stated long time ago[8]. For example, a Mercedes is more likely prototype for the category of car; a less likely choice might be a bicycle. Furthermore, the use of
object associations based on evidence of cognitive science, in which generally the problem of recognition is not centered on ‘What is that?‘, but more likely ‘Similar to what?’ [9].
In this article, we adopt the successful idea of object association on the classical shape representation, in the form of chain code representation. We proposed a novel bag-of-shapes descriptor using shape association which is constructed based on Freeman Chain Code [10]. We apply k-medoids clustering [11] to get some prototypes/exemplars of each object class. Beforehand, from the chain code representation of object contour, we calculate a likelihood association using Needleman-Wunsch algorithm. From the experiment on the multiclass fruit dataset, we successfully show that the proposed descriptor has significant effect in improving the recognition result.
The remainder of the article is organized as follows. In Section 2, we briefly explained some works related to our work. Detail explanation of our proposed model can be seen in Section 3. The dataset and experimental evaluation can be seen in Section 4 while conclusion described in Section 5.
2. RELATED WORKS
1143 give the proper name to the objects in the image [12]. Giving a name to every possible object instance in the image is seemed to be difficult, this requires object categories used in the naming process. On the other hand, using object association in object recognition is more beneficial than using object naming, in which there is no need to segment the object into a pre-defined category. Instead, to infer the identity of each instance of the object, we only need to use its nearest neighbor (nearest neighbor) instance. Lately, some of the system shows that the simple approach using KNN can demonstrate excellent performance [13].
Belongie et al. [14] and Zhang and Malik [15] has applied the object association in their research. Belongie et al. [14] created shape context descriptor and implement it in object recognition problem. They applied chi-square [16] to calculate the distance between two closest points in two different shapes. Further, the k-medoids clustering is used to select some prototypes/exemplars from each class, as the representation of each class. The shape context descriptor also used by Zhang and Malik [15] as the shape representation in the object recognition problem. For the purpose of getting some shape representation, they also applied K-medoids for choosing prototypes in each object class. In order to get an approximation of the distance of two shapes, they just sum over the shape context distance.
On the other hand, for the purpose of object recognition based on chain code representation, Iivarinen and Visa construct a chain code histogram (CCH) [17]. CCH is the simplest technique used in matching chain code representation. The CCH is defined as / , where is the number of chain code with i-direction, and N is the number of links. The CCH reflects the probabilities of different directions present in a contour. Though it is said that CCH is translation and scale invariant, but it is only invariant to a rotation of 90° [1]. Also, it did not consider the direction distribution in a chain code sequence [18]. Furthermore, the CCH also suffer from the noise sensitivity problem [1]. Some approaches has been taken to overcome the limitation of CCH, namely CCDV [19], CCRE [20] to name a few. In general, those three approaches successfully able to improve the weakness of CCH by conducting some modification in the construction of chain code.
In contrast with the way used in CCH [17] in utilizing the chain code representation for the shape
contour, CCDV [19] and CCRE [20] improve the power of CCH by adding particular functionality based on statistical, distribution, and spatial property of chain code. The order difference of each chain code is used as the distribution feature in CCDV [19]. They define the order variance by proposing a new distance definition in chain code sequence. The order of each direction code in its sequence is defined as its distance to the first code, hence the first chain code distance is zero. Further, in the chain code histogram of a particular shape contour, they add this particular order variance. Meanwhile, the authors in CCRE [20] introduce a relativity histogram in addition to the chain code histogram. They adopted the transition probability of Markov chain in the construction of relativity histogram. Though these methods proved to achieve higher performance compared to CCH, however, these methods still suffered from the limitation of chain code. The same object, might reflect many different shapes depend on the camera viewpoint in the acquiring process. This condition might generate different chain code sequences, hence, might be recognized as different object.
Although in this article we also exploit the chain code representation to represent the shape contour, our work is different from the work in [17], [19], [20]. The authors in [17] only consider the probabilities of different directions present in a contour. In [19], [20], the authors improved the weakness of applying the chain code by adding some modification in the construction of chain code histogram. In contrast with their work, we do not construct nor modify the chain code histogram. Instead, we extract the shape association of shape contour using their chain code representation.
1144
Figure 1: Illustration of bag-of-shapes descriptor construction
3. BAG-OF-SHAPES USING SHAPE
ASSOCIATION
In this section we describe the construction of shape descriptor, which is bag-of-shapes descriptor using shape association. The abstraction of our proposed descriptor can be seen in Figure 1. In general, the process of constructing the bag-of-shapes is as follows:
(a) Chain code construction,
(b) Shape association construction in each fruit subcategory,
(c) K-medoids clustering on the result of (b), and extraction of k-cluster medoids and use them as the bag-of-shapes descriptor. A more detail explanation is given in Section 3.1, 3.2, and 3.3.
3.1 Chain Code Construction
As we only need the contour of fruit object, we only use the cropped images version of the dataset, which contain the foreground object only [22]. Canny edge detection [23] was applied to those cropped color images to detect boundary of fruit object. This process yielded edge binary map.
Further, we conduct thinning process on edge binary map using a thinning algorithm [24]. Then we traced the contour [25] of one-thick pixel to construct shape representation in the form of chain code. An 8-connectivity Freeman Chain Code [10]
is used to represent the contour of object because of its simple and compact form of data representation and its suitability for fast processing. Further we use the chain code for representing the shape of fruit object. The process of chain code construction explained above is depicted in Figure 2.
[image:3.612.379.453.463.690.2]1145 3.2 Shape Association Construction
After we get the chain code of each fruit object contour, we compute the pairwise shape similarity using chain code string as shape representation. This process is conducted for each fruit subcategories.
Here, we give the definition of bag-of-shapes descriptor using shape association. A shape descriptor of an image I, , can be defined as a vector with k-dimension, according to bag-of-shapes as depicted in (1),
, , , … ,
(1)where is the shape association likelihood between shape in I and the nth shape, . The shape association between an image I and a certain shape S, is measured using Needleman-Wunsch algorithm.
Basically, in Freeman Chain Code, each object contour was represented as a sequence over a finite alphabet [10]. Hence, the Needleman-Wunsch global alignment algorithm [26] was used to estimate the similarity between two sequences. Readers can refer to our article in [27] to further study the implementation example of this algorithm.
In applying Needleman-Wunsch algorithm to our model, we conduct a modification in the substitution cost (or scoring function) over each pair of possible sequence alphabet, e.g., the cost of substituting alphabet ‘0’ with alphabet ‘1’. Because each alphabet in the chain code sequence having particular meaning, hence, in this paper, we did not use the common scoring function already defined in Bioinformatics domain [28], [29]. Instead, we define our scoring function, according to the characteristics of each alphabet of the chain code itself. As each code contains its particular direction, hence, we adopt the scoring function (σ) of [27] as can be seen in (2),
, w , 1
"#
, w , $1
(2)
where % is ith alphabet of string of chain code n,
& , is the cost for matching each pair of alphabet
as can be seen in (3), where , | 0, . . 7.
w ,
+ , -,
. | $ |1 ,
4 , | $ | 0 4
1 $| $ | $ 44 , | $ | 1 4
(3)
We normalize the shape association score in the range 0 – 1. If the score close to 1, it means the two sequences is similar, and vice versa.
3.3 K-Medoids Clustering in the Bag-of-Shapes Descriptor Construction
Technically, the shape association construction in Section 3.2 will produce a matrix containing pairwise-similarity value for each fruit category. In order to get the fruit prototypes, further, we apply K-medoids clustering [11] to select k-representative prototypes for each fruit category. K-medoids minimizes the sum of dissimilarities between points as member of a cluster and the center of that cluster. In contrast to the means algorithm, k-medoids chooses k-datapoint as centers of clusters.
[image:4.612.316.522.441.580.2]The k-prototypes are used as shape representative for each fruit category. Hence, the dimension of feature vector will be 2 3 dimension, with k is number of prototypes used in the k-medoids clustering and n is the number of fruit categories.
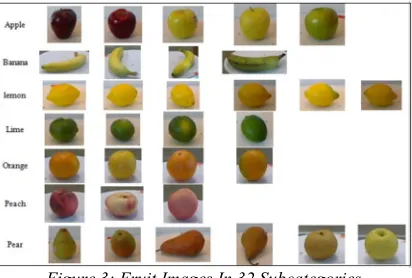
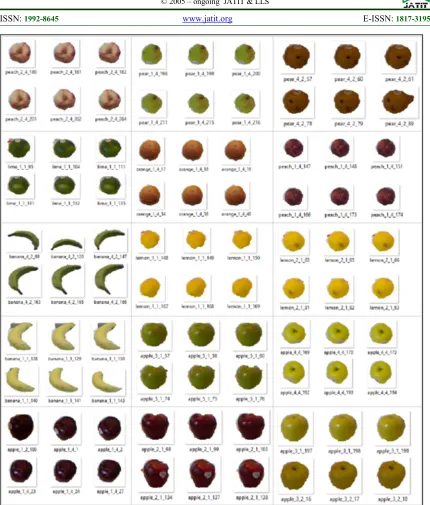
Figure 3: Fruit Images In 32 Subcategories
4. EXPERIMENTAL EVALUATION
1146 4.1 Data
The fruit object of RGBD Object Dataset [22] is used in this experiment. The fruit images in the dataset is color images with a single fruit object on each image, captured in multi-view point. There are 7 fruit categories, namely apple, banana, lemon, lime, orange, peach, and pear. Each category consists of some fruit subcategories, giving total 32 fruit subcategories namely Apple_1, Apple_2, Apple_3, Apple_4, Apple_5, Banana_1, Banana_2, Banana_3, Banana_4, Lemon_1, Lemon_2, Lemon_3, Lemon_4, Lemon_5, Lemon_6, Lime_1, Lime_2, Lime_3, Lime_4, Orange_1, Orange_2, Orange_3, Orange_4, Peach_1, Peach_2, Peach_3, Pear_1, Pear_2, Pear_3, Pear_4, Pear_5, and Pear_6. Each fruit subcategories consists of 400-700 images approximately, giving total images of 21284 images. Figure 3 shows the sample of fruit subcategories.
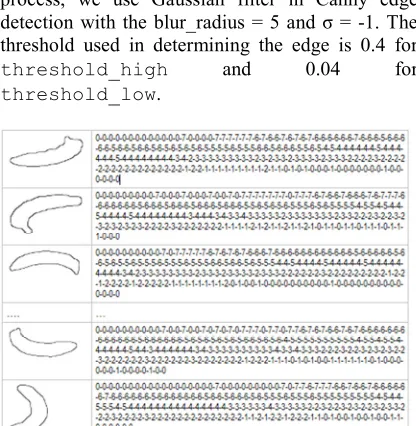
4.2 Chain Code Construction
We conduct edge detection process to extract the contour of the object. In the edge detection process, we use Gaussian filter in Canny edge detection with the blur_radius = 5 and σ = -1. The threshold used in determining the edge is 0.4 for
threshold_high and 0.04 for
threshold_low.
[image:5.612.317.519.89.240.2]Figure 4: Chain code string of some images of banana_1
Figure 5: Chain code string of some images of apple_1
Further, we conduct thinning process [24] to the detected edge in order to get one-pixel thickness. This is needed in the chain code construction, in which we trace the one-pixel thickness contour using contour tracing method [25] and further represent the chain code in the form of 8-connectivity neighborhood Freeman Chain Code. Figure 4 and Figure 5 show some results of chain code string of some images of banana_1 and apple_1, respectively.
4.3 Shape Association for Each Subcategory In the fruit dataset of RGBD Object dataset [22], the fruit is located in roundtable and captured in 3 (three) viewpoints, namely 30°, 45°, and 60° from the horizon. This condition necessitates the use of multiple prototypes for each fruit instance to capture all the variations. For that purpose, in this work we use the method of K-medoids clustering [11] to select a set of representative prototypes from each fruit subcategory.
Beforehand, we apply the Needleman-Wunsch algorithm [26], [30] in the pairwise similarity calculation on each fruit subcategory, in order to get the shape association. Further, the shape association in the form of pairwise similarity matrix is used as the input for selecting prototypes in medoids clustering. In the experiment we used k-medoids implementation of ELKI [31].
[image:5.612.90.298.368.581.2]1147
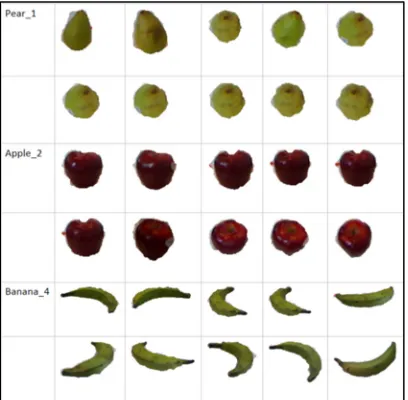
Figure 6: Sample of 5 prototypes of some fruit subcategory as the result of shape association step
4.4 Fruit Classification Result
[image:6.612.91.295.410.610.2]We use nearest neighbor classifier, with 10-fold cross validation for the fruit classification. For this purpose, the feature vector is constructed from the result of shape association step (Subsection 4.3). Each prototype is used as attribute in the feature vector. For example, if we use 5 prototypes for each fruit subcategory, hence the feature vector will have 5 x 32 = 160 dimension, as we used 32 fruit subcategories in the experiment.
Figure 7: Samples of 10 prototypes of some fruit subcategories as the result of shape association step
The performance of classification was measured in terms of accuracy, TPR (True Positive Rate), and FPR (False Positive Rate), as described in (4), (5), and (6). We use TPR and FPR along with accuracy in order to emphasize that our fruit classification system did not get into accuracy paradox problem.
45567458 9: ; 9 ; <: ; <9: ; 9 (4)
9:= 9: ; <9: (5)
<:= <: ; 9<: (6)
with TP (True Positive) is the number of images correctly classified as belonging to the positive class (correctly classified), TN (True Negative) is the number of images correctly classified as belonging to the negative class (correctly rejected), FP (False Positive) is the number of images incorrectly classified as belonging to the class (incorrectly classified), and FN (False Negative) is the number of images which were not classified as belonging to the positive class but should have been (incorrectly rejected).
Table 1: The accuracy (acc) of proposed descriptor in fruit classification using different number of prototypes
(k). Accuracy value is in percentage (%)
K 5 10 15 20 25 30
acc 75.53 78.16 81.31 82.28 82.65 82.96
As depicted in Table 1, the accuracy of fruit classification is increasing in accordance to the increasing number of prototypes. It suits our presumption that if the system could provide a suitable number of shape prototypes, the classification rate might be increased. This aspect is very importance in the classification system based on shape feature, as the same object will establish different shapes if the camera viewpoint used in capturing the object is different.
The accuracy of fruit classification in using 30 prototypes for each fruit subcategories achieves 82.96 %, along with TPR = 0.827 and FPR = 0.006. Based on those values and equation in (4), (5), and (6), it can be inferred that the value of True Negative (TN) and False Negative (FN) from our experiment is very small. Hence, the accuracy paradox can be avoided.
1148 dimensions (attributes) the data should be reduced to is 75 %.
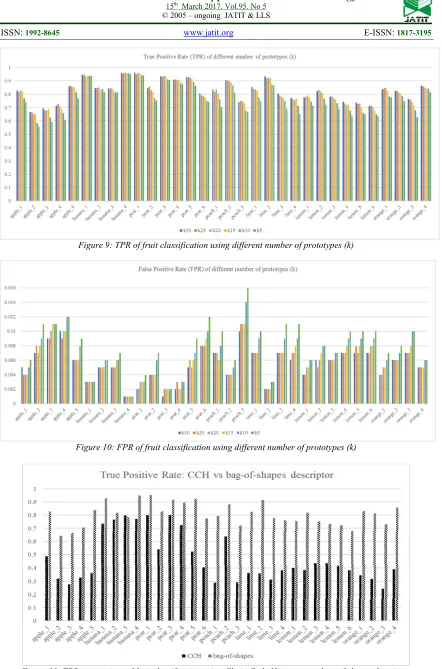
We show in Figure 9 that generally, apple_2
get the lowest TPR, namely 0.666 for k = 30. This is due to the shape contour of prototypes of apple_2 have many similarities with prototype of other fruit objects, such as apple_3, apple_5,
orange_1, orange_2. Hence, the FN (False
Negative) is higher, resulting in the low value of TPR. Also, in constructing the prototypes, the k-medoids is applied to each fruit subcategory and is not paying attention to other fruit subcategory characteristic. On the other hand, the highest TPR is achieved by pear_1, namely 0.963 for k = 30. The prototypes of pear_1 which is yielded from the shape association step (Subsection 4.3) is having high discriminative power, hence the FN is very low.
Meanwhile, the FPR value is ranging from 0.001 to 0.016, for all k values, as depicted in Figure 10. For k = 30, the highest FPR is achieved
by apple_3, namely 0.009, while the lowest FPR
is achieved by banana_4, namely 0.001. Generally, the prototypes of apple_3 is rather similar to the prototypes of other fruit object due to the similarity in the shape contour. Whereas the prototypes of banana_4 is very discriminative, as they represent many variations in shape contour of
banana_4.
4.5 Comparative Analysis
[image:7.612.315.522.482.721.2]Furthermore, we compare the accuracy of our method in fruit classification with chain code histogram (CCH) [17], as can be seen in Table 2. We use CCH as comparison since CCH is commonly used as shape descriptor of chain code based shape representation. We construct 8-bin CCH in this experiment.
Table 2: Performance comparison of Chain Code Histogram [17] and our work
Method Accuracy TPR FPR
Chain Code Histogram [17]
47.36 0.474 0.017
This work 82.96 0.83 0.005
Our proposed bag-of-shapes descriptor performance is better than CCH (1-NN, 10-fold cross validation), in term of accuracy, namely 82.96 %, while the CCH only achieved 47.355 %. To achieve 82.96 % accuracy, we use k (prototypes) = 30. The low accuracy of CCH is due to CCH only calculate the distribution of chain code alphabet
along the shape contour. As the same fruit object might establish different shape contour - as the effect of different viewpoint in capturing object by the camera-, the same fruit object will generate different CCH. In the classification process, it might be classified as different fruit object.
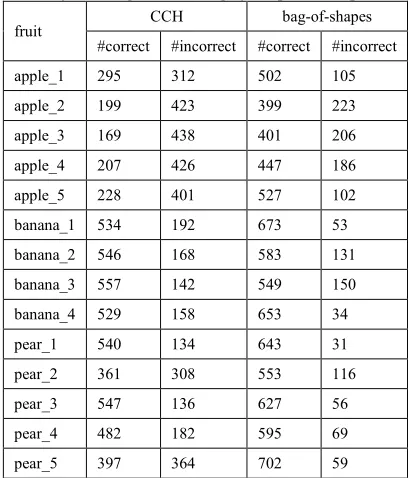
We give the TPR and FPR comparison of CCH and bag-of-shapes descriptor in fruit classification for each fruit subcategory, as can be seen in Figure 11 and Figure 12, respectively. As depicted in Figure 11, the number of images correctly classified is increasing with the use of bag-of shapes descriptor. In Table 3, we give the number of correctly and incorrectly classified fruit images, in the fruit classification using CCH or bag-of-shapes descriptor. In general, the number of correctly classified fruit images is increasing about 50 % by using bag-of-shapes descriptor.
Meanwhile, besides there are images that can be identified either using the CCH and the bag-of-shapes, there are also a number of images that can only be identified just by using CCH or bag-of shapes only. Table 4 shows the details. It can be seen that the use of bag-of-shapes descriptor able to increase the number of images which are correctly classified, significantly. Some examples of images that can be well identified by the bag-of-shapes descriptor but was not identified by CCH can be seen in Figure 15.
Table 3: Number of images correctly and incorrectly classified using CCH or bag-of-shapes descriptor.
fruit CCH bag-of-shapes
#correct #incorrect #correct #incorrect
apple_1 295 312 502 105
apple_2 199 423 399 223
apple_3 169 438 401 206
apple_4 207 426 447 186
apple_5 228 401 527 102
banana_1 534 192 673 53
banana_2 546 168 583 131
banana_3 557 142 549 150
banana_4 529 158 653 34
pear_1 540 134 643 31
pear_2 361 308 553 116
pear_3 547 136 627 56
pear_4 482 182 595 69
[image:7.612.94.293.593.639.2]1149
fruit CCH bag-of-shapes
#correct #incorrect #correct #incorrect
pear_6 297 438 571 164
peach_1 195 479 535 139
peach_2 448 256 622 82
peach_3 205 496 506 195
lime_1 228 402 520 110
lime_2 230 410 586 54
lime_3 188 414 469 133
lime_4 245 397 489 153
lemon_1 238 355 448 145
lemon_2 257 409 545 121
lemon_3 267 347 463 151
lemon_4 262 340 441 161
lemon_5 273 381 473 181
lemon_6 236 382 418 200
orange_1 245 465 590 120
orange_2 226 487 580 133
orange_3 174 533 516 191
orange_4 274 430 603 101
Table 4: Number of images correctly classified. The number of images correctly classified only by using CCH, only by using bag-of-shapes, and both approach can be seen in the column ‘CCH’, ‘bag-of-shapes’, and ‘both’, respectively
fruit
subcategory CCH
bag-of-shapes both
apple_1 31 238 264
apple_2 42 242 157
apple_3 46 278 123
apple_4 48 288 159
apple_5 16 315 212
banana_1 22 161 512
banana_2 77 114 469
banana_3 96 88 461
banana_4 20 144 509
pear_1 5 108 535
pear_2 25 217 336
pear_3 18 98 529
pear_4 25 138 457
pear_7 13 318 384
pear_8 34 308 263
peach_1 17 357 178
peach_2 28 202 420
peach_3 27 328 178
fruit
subcategory CCH
bag-of-shapes both
lime_1 31 323 197
lime_2 13 369 217
lime_3 25 306 163
lime_4 34 278 211
lemon_1 25 235 213
lemon_2 18 306 239
lemon_3 30 226 237
lemon_4 38 217 224
lemon_5 40 240 233
lemon_6 53 235 183
orange_1 31 376 214
orange_2 35 389 191
orange_3 30 372 144
orange_4 20 349 254
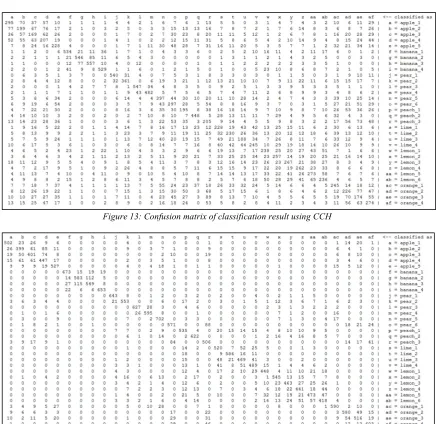
Furthermore, the use of bag-of-shapes descriptor also able to reduce misclassification on the banana category. It can be seen in the confusion matrix in Figure 14, all images of banana subcategory (banana_1, banana_2, banana_3, and banana_4) can be correctly classified. The misclassification on the banana still revolves around banana category also. In contrast to the use of CCH, there is still banana images misclassified into category other than banana, as shown in Figure 13.
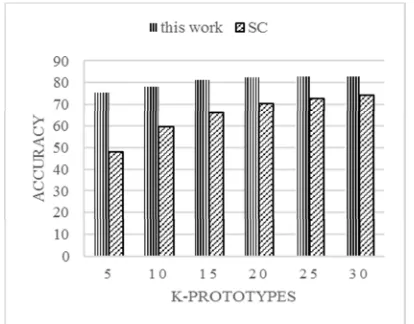
Among others, the shape context [14] is very popular shape descriptor and commonly used for object recognition. In comparing with shape context, we also apply the k-medoids clustering to the pairwise similarity calculation of the shape context value. For our experiment, we use the shape context implementation of BoofCV [33]. Accuracy comparison of our proposed bag-of-shapes descriptor and shape context is presented in Table 5. It can be inferred from Table 5 that our proposed bag-of-shapes descriptor is better than shape context. This comparison is also depicted in Figure 8 to show clarity.
Table 5: Accuracy comparison of this work and shape context (SC) [14] using different number of prototype (k).
All value is in percentage (%)
k 5 10 15 20 25 30
SC 47.84 59.55 66.00 70.54 72.63 74.41
[image:8.612.118.275.446.732.2]1150 Meanwhile, we use Hu’s moment in comparison as this method is used in the [34] as shape representation in fruit recognition and our work use the same dataset as in [34]. The accuracy in [34] is 72.04 %, slightly worse than accuracy in our proposed method, namely 82.96 %.
Figure 8: Accuracy (%) comparison of this work and shape context (SC) using different number of prototype
5. CONCLUSION AND FUTURE WORKS
We proposed a novel bag-of-shape descriptor using shape association, based on Freeman Chain Code. For the computation of shape association, we apply Needleman-Wunsch algorithm as commonly used in solving the sequence alignment problem. From the experiment on fruit dataset, our proposed method achieves better classification accuracy compared to conventional chain code based shape descriptor technique, namely Chain Code Histogram. Besides that, our proposed shape descriptor also surpassed the accuracy of shape descriptor already applied in multi-view fruit object recognition. Furthermore, we also show that selecting some shape prototypes for each fruit subcategory is an important process in the fruit recognition problem. As we may know that each shape will have a particular shape representation especially in chain code representation, hence it become necessary to have some representative shape representation of a particular fruit class. In our experiment, we successfully show that the application of k-medoids clustering on the likelihood association on chain code representation of fruit shape, can capture the diversity of shape variations of single fruit object.
Along with its success, in the resulting set of prototype we still find some prototypes which did not reflect the diversity of view of fruit object, such
as in apple, lemon, and orange category, which produce low True Positive Rate. This condition is due to the chain code representation sometimes contains small noise, since the construction of chain code sometimes suffer from staircase-effect. We plan to improve this limitation, by applying the discrete contour evolution (DCE) technique to the shape contour in the chain code construction step in the future works. We also plan to use some threshold to refine the prototypes as the result of medoids clustering, by reducing the centroid (of k-medoids) which only have few members, in order to get the more appropriate prototypes of each fruit subcategory.
ACKNOWLEDGEMENT
We would like to thank Ministry of Research Technology and Higher Education of the Republic of Indonesia (Kementerian Riset Teknologi dan Pendidikan Tinggi Republik Indonesia) for the financial support in conducting this research.
REFERENCES
[1] D. Zhang and G. Lu, “Review of shape representation and description techniques,” Pattern Recognit., vol. 37, no. 1, pp. 1–19, 2004.
[2] F. Berrada, D. Aboutajdine, S. E. Ouatik, and a. Lachkar, “Review of 2D shape descriptors based on the curvature scale space approach,” in International Conference on Multimedia Computing and Systems -Proceedings, 2011, no. 1, pp. 1–6. [3] Y. Mingqiang, K. K. Idiyo, and R. Joseph,
“A Survey of Shape Feature Extraction Techniques,” Pattern Recognition, Peng-Yeng Yin 43-90, pp. 43–90, 2008.
[4] I. K. Kazmi, L. You, and J. J. Zhang, “A Survey of 2D and 3D Shape Descriptors,” 2013 10th Int. Conf. Comput. Graph. Imaging Vis., pp. 1–10, Aug. 2013.
[5] A. N. Azmi and D. Nasien, “Feature vector of binary image using Freeman Chain Code (FCC) representation based on structural classifier,” Int. J. Adv. Soft Comput. its Appl., vol. 6, no. 2, pp. 1–19, 2014.
1151 [7] N. A. Jusoh and J. Mohamad Zain,
“Malaysian Car Plates Recognition Using Freeman Chain Codes and Characters’ Features,” in Software Engineering and Computer Systems: Second International Conference, ICSECS 2011, Kuantan, Pahang, Malaysia, June 27-29, 2011, Proceedings, Part I, J. Mohamad Zain, W. M. bt Wan Mohd, and E. El-Qawasmeh, Eds. Berlin, Heidelberg: Springer Berlin Heidelberg, 2011, pp. 581–591.
[8] E. Rosch, C. B. Mervis, W. D. Gray, D. M. Johnson, and P. Boyes-Braem, “Basic objects in natural categories,” Cogn. Psychol., vol. 8, no. 3, pp. 382–439, 1976. [9] M. Bar, “The proactive brain: using
analogies and associations to generate predictions,” Trends Cogn. Sci., vol. 11, no. 7, pp. 280–289, 2007.
[10] H. Freeman, “On the Encoding of Arbitrary Geometric Configurations,” IEEE Trans. Electron. Comput., vol. EC-10, no. 2, pp. 260–268, Jun. 1961.
[11] L. Kaufman and P. J. Rousseeuw, “Clustering by Means of Medoids,” in Statistical Data Analysis Based on the L1-Norm and Related Methods, 1987.
[12] T. Malisiewicz and A. A. Efros, “Recognition by association via learning per-exemplar distances,” 26th IEEE Conf. Comput. Vis. Pattern Recognition, CVPR, 2008.
[13] J. Hays and A. A. Efros, “Scene Completion Using Millions of Photographs,” vol. 1, no. 212, pp. 1–7, 2007.
[14] S. Belongie, J. Malik, and J. Puzicha, “Shape matching and object recognition using shape contexts,” Pattern Anal. Mach. Intell. IEEE Trans., vol. 24, no. 4, pp. 509– 522, Apr. 2002.
[15] H. Zhang and J. Malik, “Learning a Discriminative Classifier Using Shape Context Distances,” in IEEE Computer Society Conference on Computer Vision and Pattern Recognition, 2003, p. I-242-I-247.
[16] Y. Yang and J. O. Pedersen, “A comparative study on feature selection in text categorization,” Mach. Learn. Work. Then Conf., pp. 412–420, 1997.
[17] J. Iivarinen and A. Visa, “Shape recognition of irregular objects,” Intell. Robot. Comput. Vis. XV ALGORITHMS, Tech. Act. VISION, Mater. Handl. PROC.
SPIE 2904, vol. 2904, pp. 25--32, 1996. [18] J. Sun and H. Xu, “Contour-Shape
recognition and retrieval based on chain code,” in CIS 2009 - 2009 International Conference on Computational Intelligence and Security, 2009, vol. 1, pp. 349–352. [19] J. Sun and X. Wu, “Chain Code
Distribution-Based Image Retrieval,” in Proceedings of the 2006 International Conference on Intelligent Information Hiding and Multimedia, 2006, pp. 139–142. [20] J. Sun and X. Wu, “Shape Retrieval Based on the Relativity of Chain Codes,” in Multimedia Content Analysis and Mining: International Workshop, MCAM 2007, Weihai, China, June 30-July 1, 2007. Proceedings, N. Sebe, Y. Liu, Y. Zhuang, and T. S. Huang, Eds. Berlin, Heidelberg: Springer Berlin Heidelberg, 2007, pp. 76– 84.
[21] S. Li, A. Lum, G. Brahm, I. Ben Nachum, M. Sharma, O. Shmuilovich, and J. Warrington, “A Bag-of-shapes descriptor for medical imaging,” in 2016 IEEE International Conference on Image Processing (ICIP), 2016, pp. 2316–2320. [22] K. Lai, L. Bo, X. Ren, and D. Fox, “A
large-scale hierarchical multi-view RGB-D object dataset,” in ICRA, 2011, pp. 1817– 1824.
[23] J. Canny, “A Computational Approach to Edge Detection,” IEEE Trans. Pattern Anal. Mach. Intell., vol. PAMI-8, no. 6, pp. 679–698, 1986.
[24] R. M. Haralick, T. Zhang, and C. Suen, “A fast parallel algorithm for thinning digital patterns,” Commun. ACM, vol. 27, no. 3, pp. 236–239, 1984.
[25] F. Chang, C.-J. Chen, and C.-J. Lu, “A linear-time component-labeling algorithm using contour tracing technique,” Comput. Vis. Image Underst., vol. 93, no. 2, pp. 206–220, 2004.
[26] G. Navarro, “A guided tour to approximate string matching,” ACM Comput. Surv., vol. 33, no. 1, pp. 31–88, 2001.
[27] E. Rachmawati, M. L. Khodra, and I. Supriana, “Shape based Recognition Using Freeman Chain Code and Modified Needleman-Wunsch,” in The 8th 2016 International Conference on Information Technology and Electrical Engineering (ICITEE), 2016, pp. 461–466.
1152 Atlas of protein sequence and structure, 1978, pp. 345–352.
[29] S. Henikoff and J. G. Henikoff, “Amino acid substitution matrices from protein blocks.,” Proc. Natl. Acad. Sci. U. S. A., vol. 89, no. 22, pp. 10915–10919, 1992. [30] Sam Chapman, “SimMetrics: A Java library
of similarity and distance metrics.” 2009. [31] E. Schubert, A. Koos, T. Emrich, A. Züfle,
K. A. Schmid, and A. Zimek, “A Framework for Clustering Uncertain Data,” PVLDB, vol. 8, no. 12, pp. 1976–1979, 2015.
[32] D. Fradkin and D. Madigan, “Experiments with random projections for machine learning,” in Proceedings of the ninth ACM SIGKDD international conference on Knowledge discovery and data mining, 2003, pp. 517–522.
[33] P. Abeles, “BoofCV.” 2012.
1153
Figure 9: TPR of fruit classification using different number of prototypes (k)
[image:12.612.90.532.46.715.2]Figure 10: FPR of fruit classification using different number of prototypes (k)
1154
[image:13.612.90.520.56.269.2]Figure 12: FPR comparison of fruit classification using Chain Code Histogram vs bag-of-shapes descriptor
Figure 13: Confusion matrix of classification result using CCH
[image:13.612.89.530.281.705.2]1155