DAILY STREAMFLOW PREDICTION ON TIME SERIES
FORECASTING
1
AHMAD FIRDAUS KHAIR, 2 MOHD KHALID AWANG, 3 ZAHRATUL AMANI ZAKARAIA,
4
MUNIRAH MAZLAN
1,2,3
Universiti Sultan Zainal Abidin, Faculty of Informatics and Computing, Terengganu, Malaysia
E-mail: [email protected], 2 [email protected], [email protected],
4
ABSTRACT
Time series forecasting is a process that used present or past data to develop models for future prediction or trends. Stream flow prediction is considered as a challenging research activity because of its irregularity and unpredictable behavior. Researches have put their efforts and strategies in upgrading and improving the accuracy of streamflow analysis prediction. In this paper, time series forecasting using WEKA is used, analyzed and compared based on the following three algorithms, which are SMO Regression, Linear Regression and Multilayer Perception. The result shows that the SMO Regression algorithm provides better ability to predict more accurately compared to other algorithms.
Keywords: Streamflow forecasting, SMO Regression, Linear Regression and Multilayer Perception
1. INTRODUCTION
Streamflow can be defined as water flowing and rate of volume water source. It is also known as the major element water cycles on the earth where the water flows through streams, rivers, and other channels. Streamflow is an important component of living systems and bulk of average used for daily life. The living systems actually depend on the water to live and without it is difficult to keep living. For example, streamflow can be used for irrigates the crops, food resources, prevent the earth from drought and other more. However, the streamflow problem can lead to disaster, loss, and pollution. The flood is the example of a natural disaster, where it happened directly or indirectly that cause a huge impact loss to public [1]. An early decision making helps to prevent and reduce this problem, as the streamflow water level can be managed and controlled.
Time series forecasting is commonly known as a process of utilizing models in order to obtain the prediction of the output result for future trends and event. The future data result is generated according to the previous variable data event of a streamflow water level. It is proven that this forecast method has abilities to produce a better result based on many applications such as business, finance, medical and others [1] [2]. This forecasting method also used in the hydrological forecasting
which successfully help to predict the accurate result [3] [4]. Therefore, in order to find the most accurate prediction of streamflow, variety models method and algorithms have been proposed in the previous studies.
This paper discusses the streamflow water level prediction using Time Series Forecasting which used to analyze and observe the result based on the 5 days data forecast with algorithms and metrics applied. The next section discusses on the literature review about streamflow prediction. Then it is followed by the research methodology; using WEKA forecast tools to predict the streamflow water level. The result and discussion of this study is presented in the following section. Finally the conclusions are outlined in the last section.
.
2. RELATED WORK
This section summarizes some of the previous researches that focused on streamflow prediction or forecasting. The previous studies have shown that there are various methods and algorithms have been applied, including machine learning and statistical analysis.
explained that this model learned the temporal pattern and data parameters very well in order to control the reservoir release water decisions. Pandhiani et al [3] explain the hybrid model approach for monthly time series forecasting river flow. This research determines the practicality and feasibility in measuring method of MAE, MSE, and R to predict the monthly river flow data. However, [5] uses the ANN to compare AR in a forecast the daily river flow. The analysis of 1-day ahead forecasts result show that ANN using linear regression and discrete wavelet has the capability for understanding streamflow data behavior and solving a specific problem.
This study in [6] used the Least Squares Support Vector algorithms as a method to forecast the future streamflow discharge with using the data set of past stream flow and gage height. This method used an algorithm used to predict volume water discharge in a large amount of data with inefficiently. Qingwei et al [7] utilize the techniques of genetic programing, use in the Evolutionary Modeling to forecast the minimal data sets. This time series forecasting uses the GP to obtain quick and flexible means that create model between input and output to predict and estimate the fluctuation China streamflow with easy use and cost effective. Chiew et al[8], has been used an approach of statistical seasonal to improve streamflow forecasting in multiple sites. It helps to maximize available data extraction and provide good parametric structure to facilitate streamflow data learning. It clearly states that many methods and techniques have been widely accepted by various studies to uncover the future data trend.
3. RESEARCH METHODOLOGY
3.1 Research Framework
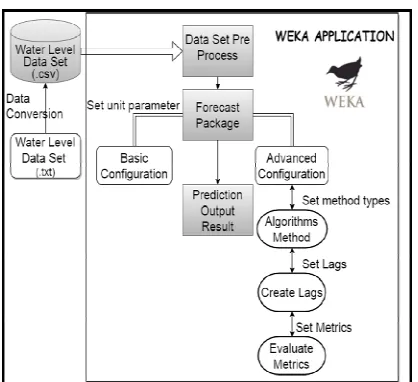
[image:2.612.313.522.90.281.2]The research framework is presented as in figure 1. The research started with the data collection, then followed by data preprocessing. After that, the raw data are converted into CSV format. The experiment setup are described as in figure 1.
Figure 1. Framework of streamflow forecasting
3.2 Data Set
The dataset is commonly known as a collection of data which represents a particular variable for a single table and also data combination in the whole entity. This data set can be organized into several characteristics of information based on the structure and properties need to be carried out. In this streamflow water level prediction, we will use data set on the attribute of date and water level from three streams which Sungai Nerus, Sungai Tebak, and Sungai Kuala Ping. In order to run this data set, conversion data were applied before running it into WEKA Application based on Figure 3.
3.3 Data Pre Processing
The actual data collected at the station contain noises and some missing values. Therefore, in order to eliminate the outliers and noises, we have performed the data preprocessing prior to the experiments. In this study, the data preprocessing has been considered in the total of 4154 daily instances streamflow water level data from 2001 until 2012 is used for Sungai Tebak, while 2650 daily instances streamflow water level data for Sungai Kuala Ping from 2005 until 2012. Lastly, the total daily instances of Sungai Nerus streamflow water level data is 11428 from 1981 until 2011.
normalized within the range of 1 and -1. For the attribute data, date and water level were used to fill the data information for preprocessing. Table 3.1 shows the result of 5 days (number time units) forecast according to the method mining that is applied with 7 lags length.
3.4 Algorithm
In this study, we have utilized WEKA Forecasting Time Series together with three (3) different data mining algorithms. The selected algorithms are as follows:
1) Linear Regression [9] [10] 2) SMO Regression [11] [12] 3) Multilayer Perceptron [13]
3.5 Performance Measure
Inn this research, we have proposed four (4) different type of performance measure which are Mean Absolute Error (MAE), Mean Absolute
Percentage Error (MAPE), Root Mean Squared Error (RMSE) and Mean Squared Error (MSE). The measurements have been identified as the most common tools to analyze the accuracy of the streamflow prediction [14]. MAPE usually used to fit the forecast measurement accuracy by obtaining the period of each time-average absolute error percentage computation. The simplest of forecast measurement is called Mean Absolute error (MAE). This measurement used to finalize the result by showing the closest quantity values based on the final result prediction. The standard statistical metrics of RMSE are used to measure the model’s performance, but it is not suitable to indicate the average performance models and may mislead the error of average indicator.
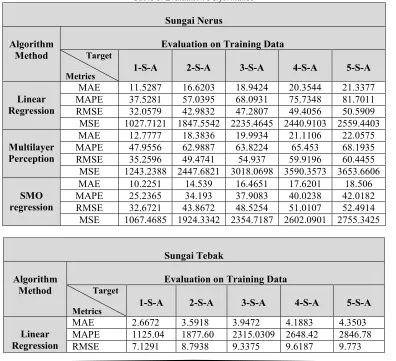
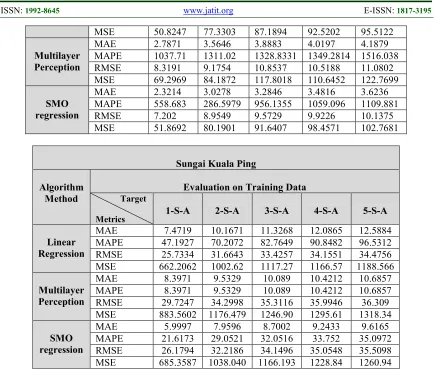
[image:3.612.112.508.382.743.2]Table 1 present the overall performance of three (3) different algorithms against four (4) type of measurement metrics with five (5) step-head target for each of our selected streams: (Sungai Nerus, Sungai Tebak and Sungai Kuala Ping)
Table 1. Evaluation Performance
Sungai Nerus
Algorithm Method
Evaluation on Training Data Target
Metrics
1-S-A 2-S-A 3-S-A 4-S-A 5-S-A
Linear Regression
MAE 11.5287 16.6203 18.9424 20.3544 21.3377
MAPE 37.5281 57.0395 68.0931 75.7348 81.7011
RMSE 32.0579 42.9832 47.2807 49.4056 50.5909
MSE 1027.7121 1847.5542 2235.4645 2440.9103 2559.4403
Multilayer Perception
MAE 12.7777 18.3836 19.9934 21.1106 22.0575
MAPE 47.9556 62.9887 63.8224 65.453 68.1935
RMSE 35.2596 49.4741 54.937 59.9196 60.4455
MSE 1243.2388 2447.6821 3018.0698 3590.3573 3653.6606
SMO regression
MAE 10.2251 14.539 16.4651 17.6201 18.506
MAPE 25.2365 34.193 37.9083 40.0238 42.0182
RMSE 32.6721 43.8672 48.5254 51.0107 52.4914
MSE 1067.4685 1924.3342 2354.7187 2602.0901 2755.3425
Sungai Tebak
Algorithm Method
Evaluation on Training Data Target
Metrics 1-S-A 2-S-A 3-S-A 4-S-A 5-S-A
Linear Regression
MAE 2.6672 3.5918 3.9472 4.1883 4.3503
MAPE 1125.04 1877.60 2315.0309 2648.42 2846.78
MSE 50.8247 77.3303 87.1894 92.5202 95.5122
Multilayer Perception
MAE 2.7871 3.5646 3.8883 4.0197 4.1879
MAPE 1037.71 1311.02 1328.8331 1349.2814 1516.038
RMSE 8.3191 9.1754 10.8537 10.5188 11.0802
MSE 69.2969 84.1872 117.8018 110.6452 122.7699
SMO regression
MAE 2.3214 3.0278 3.2846 3.4816 3.6236
MAPE 558.683 286.5979 956.1355 1059.096 1109.881
RMSE 7.202 8.9549 9.5729 9.9226 10.1375
MSE 51.8692 80.1901 91.6407 98.4571 102.7681
Sungai Kuala Ping
Algorithm Method
Evaluation on Training Data Target
Metrics 1-S-A 2-S-A 3-S-A 4-S-A 5-S-A
Linear Regression
MAE 7.4719 10.1671 11.3268 12.0865 12.5884
MAPE 47.1927 70.2072 82.7649 90.8482 96.5312
RMSE 25.7334 31.6643 33.4257 34.1551 34.4756
MSE 662.2062 1002.62 1117.27 1166.57 1188.566
Multilayer Perception
MAE 8.3971 9.5329 10.089 10.4212 10.6857
MAPE 8.3971 9.5329 10.089 10.4212 10.6857
RMSE 29.7247 34.2998 35.3116 35.9946 36.309
MSE 883.5602 1176.479 1246.90 1295.61 1318.34
SMO regression
MAE 5.9997 7.9596 8.7002 9.2433 9.6165
MAPE 21.6173 29.0521 32.0516 33.752 35.0972
RMSE 26.1794 32.2186 34.1496 35.0548 35.5098
MSE 685.3587 1038.040 1166.193 1228.84 1260.94
4. RESULT AND DISCUSSION
The performance and comparative analysis of each of the time series forecasting algorithms are tabulated in Table 2. It shows that the SMO regression algorithm of MAE have the smallest resultant reading at Sungai Nerus with the value of
10.2251, whereas at Sungai Tebak with the value of
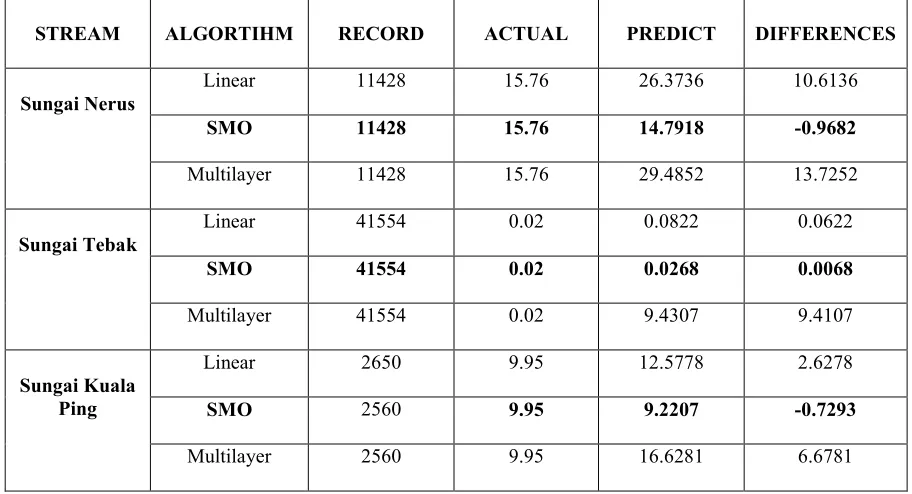
2.3214 and finally at Sungai Kuala Ping recorded the value of 5.9997. Meanwhile, table 3 shows the result of actual and predicted output of the stream flow level. Based on the result, it is apparent that
[image:4.612.90.525.68.437.2]the SMO regression algorithm produces the lowest difference values between the actual and predicted. From this experiment, we could say that the SMO regression algorithm outperformed the Linear regression and Multilayer Perceptron algorithms. This performance comparison lead us to our conclusion that that SMO regression is the most suitable algorithm for time series forecasting of sreamflow. It is proved that our result is reliable and comparable with other method as indicated in [11][12].
Table 2. Metrics Data Comparison of MAE, MSE, RMSE and MAPE
METRIC
ALGORITHM
Sungai Nerus Sungai Tebak Sungai Kuala Ping
Linear Multi SMO Linear Multi SMO Linear Multi SMO
MAPE 1027.7121 1243.2388 1067.4685 50.8247 69.2069 51.8692 662.2062 883.5602 685.3587
SMSE 32.0579 32.2596 32.6721 7.1291 8.3191 7.202 25.7334 29.7247 32.2186
[image:5.612.82.538.210.457.2]MSE 37.52 35.2596 25.2365 1125.04 1037.71 558.683 47.1927 41.3417 21.6173
Table 3. Algorithms, Data Comparison of Actual & Predict
STREAM ALGORTIHM RECORD ACTUAL PREDICT DIFFERENCES
Sungai Nerus
Linear 11428 15.76 26.3736 10.6136
SMO 11428 15.76 14.7918 -0.9682
Multilayer 11428 15.76 29.4852 13.7252
Sungai Tebak
Linear 41554 0.02 0.0822 0.0622
SMO 41554 0.02 0.0268 0.0068
Multilayer 41554 0.02 9.4307 9.4107
Sungai Kuala Ping
Linear 2650 9.95 12.5778 2.6278
SMO 2560 9.95 9.2207 -0.7293
Multilayer 2560 9.95 16.6281 6.6781
5. CONCLUSION
In this research, we applied three (3) different algorithms which are Linear Regression, SMO Regression and Multilayer Perceptron using WEKA time series forecasting. By comparing the performance of forecasting algorithms, we found that SMO regression offers the better ability to predict the streamflow of Sungai Nerus, Sungai Tebak and Sungai Kuala Ping. SMO regression predict with the highest accuracy when compared to the other two methods which are linear regression and multilayer perceptron. The finding of this research could be used as one of the alternatives in predicting the streamflow in the near future. However, we believed that the accuracy of the prediction could be improved if we could gather more reliable data and within the longer time duration. Future work can also be done by focusing on other algorithms and techniques.
ACKNOWLEDGMENTS
The authors would like to thank Universiti Sultan Zainal Abidin (UniSZA) for funding this research under University Research Grant Scheme (UniSZA / 14 / GU (022)).
REFERENCES
[1] Ashaary, N. A., Ishak, W. H. W., & Ku-Mahamud, K. R. (2015). Neural Network Application in the Change of Reservoir Water Level Stage Forecasting. Indian Journal of
Science and Technology, 8(13).
[2] Raj Kumar, A. B. (March -July 2014). Time Series Forecasting Of Nifty Stock Market Using Weka. International Journal for
Research Publication & Seminar, 6.
Forecasting. Applied Mathematics &
Information Sciences, 9(6), 2943. Eker, A. A.
(2012). Prediction Of Daily Streamflow Using Jordan Elman Networks. Fresenius
Environmental Bulletin , 7
[4] Doğan, E., Işık, S., Toluk, T., & Sandalcı, M. (2007, March). Daily streamflow forecasting using artificial neural networks.
In International Congress on River Basin
Management (pp. 22-24)..
[5] KİŞİ, Ö. (2005). Daily river flow forecasting using artificial neural networks and auto-regressive models. Turkish Journal of
Engineering and Environmental
Sciences, 29(1), 9-20..
[6] Zhang, N., Williams, C., Ososanya, E., & Mahmoud, W. (2013, October). Streamflow Prediction Based on Least Squares Support Vector Machines. InASEE-2013 Mid-Atlantic
Fall Conference, Washington, DC.
[7] Ni, Q., Wang, L., Ye, R., Yang, F., & Sivakumar, M. (2010). Evolutionary modeling for streamflow forecasting with minimal datasets: a case study in the West Malian River, China. Environmental Engineering
Science, 27(5), 377-385.
[8]
Francis Chiew, Q. W. (2008). Statistical Seasonal Streamflow Forecasting Model. SouthEastern Australian Climate Initiative, 5.
[9]
Seber, G. A., & Lee, A. J. (2012). Linearregression analysis (Vol. 936). John Wiley &
Sons.
[10]Montgomery, D. C., Peck, E. A., & Vining, G. G. (2015). Introduction to linear regression
analysis. John Wiley & Sons.
[11]
Flake, G. W., & Lawrence, S. (2002). Efficient SVM regression training with SMO. Machine Learning, 46(1-3), 271-290 [12]Mielniczuk, J., & Tyrcha, J. (1993).Consistency of multilayer perceptron regression estimators. Neural Networks, 6(7), 1019-1022.
[13]Khatib, T., Mohamed, A., Mahmoud, M., & Sopian, K. (2012). Estimating global solar energy using multilayer perception artificial neural network.International journal of energy, (1).
[14]Chai, T., & Draxler, R. R. (2014). Root mean square error (RMSE) or mean absolute error (MAE)?–Arguments against avoiding RMSE in the literature.Geoscientific Model
Development, 7(3), 1247-1250.
[15]Hyndman, R. J., & Koehler, A. B. (2006). Another look at measures of forecast
accuracy. International journal of