BIROn - Birkbeck Institutional Research Online
Crawford, Ian (2001) An ultra-high-resolution study of the interstellar medium
in the direction of Ophiuchi. Monthly Notices of the Royal Astronomical
Society 327 (3), pp. 841-848. ISSN 0035-8711.
Downloaded from:
Usage Guidelines:
Please refer to usage guidelines at
or alternatively
An ultra-high-resolution study of the interstellar medium in the direction
of
a
Ophiuchi
I. A. Crawford
PDepartment of Physics and Astronomy, University College London, Gower Street, London WC1E 6BT
Accepted 2001 June 18. Received 2001 May 30; in original form 2001 April 9
A B S T R A C T
I present very high resolution ðR¼400 000 and R¼880 000Þobservations of interstellar CaIIabsorption lines towards eight early-type stars situated within 158of
a
Oph on the sky. I confirm an earlier result that the interstellar structure responsible for the anomalously strong CaII absorption towardsa
Oph has a spatial extent of&1 pc (and is probably very much smaller). Many discrete interstellar absorption components are apparent in these high-resolution data, but while several have velocities in the range expected for the local interstellar medium (LISM), no convincing detections of either the local interstellar cloud (LIC), or the so-called G cloud, were made. In the former case, I argue that the relatively weak LIC components are masked by components arising in more distant clouds, but which have LISM-like velocities owing to the pervasive influence of outflow from the Sco-Cen association. The non-detection of the G cloud is more problematical, and I tentatively argue that, previous claims notwithstanding, this feature does not extend to galactic latitudes as high as1158in this direction.Key words:line: profiles – stars: individual:
a
Oph – ISM: structure.1 I N T R O D U C T I O N
The presence of an unusually strong interstellar CaII K line towards the nearbyð14:3^0:2 pc;ESA 1997) staraOph was first discovered by Mu¨nch & Unso¨ld (1962). The equivalent width (<25 mA˚ ; Crawford & Dunkin 1995; Welty, Morton & Hobbs 1996) is the largest known for any star within about 30 pc of the Sun, and for this reason the sightline has long held a special place in studies of the local interstellar medium (e.g. Frisch 1981; Paresce 1983; Frisch, York & Fowler 1987; Crawford & Dunkin 1995). In their initial study, Mu¨nch & Unso¨ld (1962) observed a number of stars close toaOph on the sky in an attempt to place limits on the extent of the structure (‘cloud’) responsible for this absorption, deriving ‘an upper limit of 5 pc, with an actual value more likely to be around 1 pc.’
Given the interest in this sightline, and the fact that Mu¨nch & Unso¨ld’s spectra were obtained at relatively low dispersion (typically 3–9A mm 21Þ using photographic plates, it seemed worthwhile to repeat their study at much higher spectral resolution using modern detectors. To this end, I have used the Ultra-High-Resolution Facility (UHRF) at the Anglo-Australian Telescope to obtain very high resolution observations of the interstellar CaIIK line towards eight stars close toa Oph on the sky, all of them previously observed by Mu¨nch & Unso¨ld (1962). The list of stars is
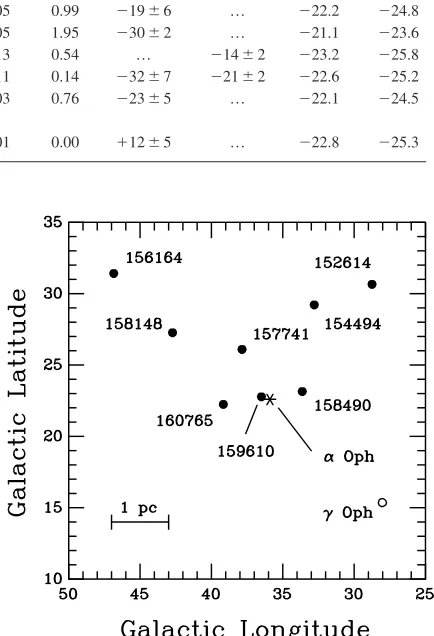
given in Table 1, and their locations on the sky, relative toaOph itself, are shown in Fig. 1.
Perhaps surprisingly, most of these interstellar Ca K lines seem do not seem to have been re-observed since the initial study by Mu¨nch & Unso¨ld (1962). Indeed, a bibliographic search of the SIMBADdata base revealed additional observations reported in the literature for only the two brightest stars in the present sample: HD 152614 (iOph) and HD 156164 (dHer). References to these earlier studies, and the interstellar equivalent widths obtained by them, are given in Table 2. In addition to this paucity of later observations, the primary justifications for repeating the work of Mu¨nch & Unso¨ld at higher spectral resolution are as follows:
(i) The resolution is sufficient to resolve the number of individual velocity components present, down to the limit imposed by the intrinsic linewidths. Thus we should be able to unambiguously distinguish an a Oph cloud component from others which may be present along the line of sight. This is especially important for the more distant stars in the sample, for which the probability of encountering additional absorption components is high.
(ii) Given that the resolution is sufficient to resolve the intrinsic absorption line profiles, the measured linewidths enable us to place limits on the physical conditions (specifically temperature and turbulence) prevailing in the absorbing medium.
(iii) Finally, the higher resolution results in much greater P
E-mail: [email protected]
sensitivity to weak, narrow interstellar lines, likely to have been missed in earlier, lower resolution, surveys (cf. Section 3.6 below).
2 O B S E R VAT I O N S
The observations were obtained using the Ultra-High-Resolution Facility (UHRF; Diego et al. 1995) at the Anglo-Australian Telescope, during observing runs in 2000 April and August. In April, the spectrograph was used in itsR¼106mode, although a measurement of the instrumental profile (using a stabilised HeNe laser as a source) indicated that the actual resolving power was
R¼880 000 ð0:34^0:01 km s21, FWHM). In August, the spectrograph was used in its R¼300 000 mode, but a similar measurement of the instrumental profile yielded an actual value of
R¼400 000 ð0:75^0:01 km s21, FWHM; this greater than nominal resolution for the lower-resolution modes of the UHRF has been discussed by Diego et al. 1995). On both occasions the detector was the AAO Tectronix CCD ð10241024 24-mm pixels). The spectrograph was used in conjunction with an image-slicer (Diego 1993), and the output was binned by a factor of eight perpendicular to the dispersion direction in order to reduce the readout noise associated with the broad spectrum which results. Details of individual observations are given in Table 2.
The spectra were extracted from the CCD images using the FIGARO data reduction package (Shortridge et al. 1998), and subsequent measurements were made using the DIPSO spectral analysis program (Howarth et al. 1998), at the Universy College, London (UCL), Starlink node. Wavelength calibration was achieved using a ThAr comparison lamp; second-order polynomial fits to five comparison lines yielded rms residuals of &3:51024A ( &0.03 km s21
). Three stars (HD 154494, 158490 and 159610) were found to exhibit strong and broad photospheric Ca K lines, and these were fitted by Gaussians to define the local continuum for the much narrower interstellar (or possibly circumstellar) lines in their cores. These Gaussian fits then gave an independent estimate of the stellar radial velocities, and these are listed in Table 1. Once wavelength calibrated, the spectra were converted to a heliocentric velocity scale, and are shown in Fig. 1. Superimposed on the observed line profiles in Fig. 2 are the
best-fitting line-profiles obtained using thex-squared minimization routineVAPID(I.D. Howarth et al., in preparation). This program returns the optimum values of the radial velocity (vhelio), velocity
dispersion (b), and column density (N) for a specified number of absorption components, and these values are listed in Table 2. For comparative purposes, I reproduce the interstellar Ca K spectrum ofaOph itself, obtained by Crawford & Dunkin (1995), in Fig. 3. Also, for consistency with the present work, I have re-analysed this spectrum using theVAPIDroutine, and the results are also given in Table 2; with the exception of the b-value for the very weak (232 km s21) component, the line profile parameters agree closely
[image:3.594.60.530.119.270.2]with the values obtained in the earlier work.
Table 1.List of observed stars and relevant stellar data. The visual magnitudes (V), spectral types, and galactic coordinates (l,b) are taken from the
SIMBADdata base;DHippis the Hipparcos trigonometric distance (ESA 1997);EðB2VÞis the colour excess, calculated from theðB2VÞcolours listed in the Hipparcos Catalogue and the intrinsic colours given by Schmidt-Kaler (1982);Sis the projected linear separation (in pc) of each line-of-sight from theaOph sightline at the distance ofaOph (14.3 pc);v* (SIMBAD) andv* (here) are the stellar heliocentric radial velocities given by
SIMBAD, and measured from the present data, respectively;vLICandvGare the expected velocities of the LIC and G Cloud components towards each star (all^1.1 km s21; see text). Values foraOph are given for comparison.
Star l b V Sp. DHipp EðB2VÞ S v* (SIMBAD) v* (here) vLIC vG
(HD) (Name) (8) (8) (mag) Type (pc) (mag) (pc) (km s21) (km s21) (km s21) (km s21)
152614 (iOph) 28.73 30.66 4.4 B8 V 71:713:9
23:5 0.02 2.60 221^5 … 223.5 226.5
154494 (60 Her) 32.78 29.22 4.9 A4 IV 44:111:4
21:4 0.01 1.81 24^2 15^5 223.0 225.8
156164 (dHer) 46.83 31.42 3.1 A3 IV 24:110:4
20:4 0.00 3.34 240^2 … 219.9 222.4
157741 37.84 26.10 6.3 B9 V 149122217 0.05 0.99 219^6 … 222.2 224.8
158148 42.71 27.27 5.5 B5 V 144119
215 0.05 1.95 230^2 … 221.1 223.6
158490 33.62 23.15 7.7 A0 201124732 0.13 0.54 … 214^2 223.2 225.8
159610 (56 Oph) 36.48 22.78 7.3 A0 119115
211 0.11 0.14 232^7 221^2 222.6 225.2
160765 39.15 22.25 6.3 A1 V 128116
211 0.03 0.76 223^5 … 222.1 224.5
aOph 35.89 22.57 2.1 Ae III 14:310:2
[image:3.594.317.534.188.506.2]20:2 0.01 0.00 112^5 … 222.8 225.3
Figure 1. The location of the observed stars on the sky, expressed in galactic coordinates. The position ofaOph itself is marked by an asterix and the stars observed here by filled circles; the position ofgOph, observed by Crawford, Craig & Welsh (1997) and discussed in the text, is marked by an open circle. The 1 pc scale bar holds for the distance ofaOph (14.3 pc; ESA 1997); for a distance of 1 pc (i.e. on the scale of the LIC) this scale bar corresponds to only 0.07 pc.
842
I. A. Crawford
q2001 RAS, MNRAS327,841–848
3 D I S C U S S I O N
3.1 Context
The structure of the local interstellar medium (LISM) has recently been reviewed by Redfield & Linsky (2000), Ferlet (1999), and Frisch (1995, 1998). The Sun is known to lie within a warm
ðTk,7000 KÞ, low-density ðn,0:2 cm23Þ, partially ionized cloud, generally referred to as the Local Interstellar Cloud (LIC). The LIC, together with several apparently similar low-density clouds, lies within a hot ðTK,106KÞ, low-density ðn,
0:005 cm23Þregion, the Local Bubble (LB), which surrounds the Sun for several tens of parsecs (e.g. Cox & Reynolds 1987). As reviewed by Frisch (1995; see also Crawford 1991), the motions of these local clouds appear to be dominated by a general outflow
from the nearby (,140 pc) Sco-Cen OB association. Recently, Breitschwerdt, Freyberg & Egger (2000) have proposed a persuasive model whereby these low-density clouds arise from the fragmentation of the ‘wall’ of neutral gas at the boundary of the LB and adjacent, expanding, Sco-Cen (‘Loop I’) superbubble.
Based on a range of ground-based andHubble Space Telescope
(HST) observations, Lallement et al. (1995) concluded that the LIC is moving past the Sun with a heliocentric velocity of 226^
1 km s21 from the direction l¼ ð6^3Þ8, b¼ ð116^3Þ8. As reviewed by Frisch (1998), this vector is very similar to that deduced from observations of interstellar matter flowing through the Solar System ½225:9^0:6 km s21 from l¼ ð4:0^0:2Þ8,
[image:4.594.85.518.116.543.2]b¼ ð115:4^0:6Þ8. Lallement et al. (1995; see also Lallement & Bertin 1992) also drew attention to a somewhat different local flow of material ð229^1 km s21 from l<4:58, b<120:58Þ,
Table 2. List of observational data and line-profile parameters.Wl(tot) is the total measured equivalent width (i.e. summed over all
velocity components; 2serrors). For comparison,Wl(Ref) lists previously published equivalent widths as follows: (1) Mu¨nch & Unso¨ld
(1962); (2) Vallerga et al. (1993); (3) Lallement, Vidal-Madjar & Ferlet (1986); (4) Welty et al. (1996). The quantitiesvhelio,bandNare, respectively, the heliocentric velocity, velocity dispersion and column density for the identified velocity components.Tul
k is the rigorous
upper-limit to the kinetic temperature obtained from theb-value assuming no turbulent contribution to the line profile (see text). Values are also given from the re-analysis of theaOph spectrum obtained by Crawford & Dunkin (1995).
Star Date R Exps. Wl(tot) Wl(Ref) vhelio b logN Tulk
(HD) (UT) ðnsÞ (mA˚ ) (mA˚ ) (km s21) (km s21) (cm22) (103K)
152614 21-04-00 9105 31200 11.0^1.3 14.4^0.5 (2) 229.9^0.6 2.63^0.92 10.20^0.13 16:76113:78
29:67
221.5^0.1 1.88^0.17 10.74^0.03 8:5611:62
21:48
213.7^0.1 0.62^0.19 10.08^0.11 0:9310:66
20:48
210.0^0.3 2.54^0.43 10.61^0.06 15:6315:74
24:84
154494 21-04-00 9105 31800 &1.5 10? (1) … … &10.24 …
156164 21-04-00 9105 11800 2.8^0.5 2.9 (3) 219.6^0.2 1.73^0.24 10.53^0.05 7:2512:15
21:87
157741 17-08-00 4105 11900 26.1^2.2 16 (1) 220.9^0.1 1.96^0.14 11.58^0.03 9:3111:38
21:28
158148 21-04-00 9105 31800 17.2^1.4 25 (1) 224.5^0.1 0.52^0.07 10.57^0.05 0:6610:19
20:16
221.6^0.3 1.53^0.39 10.79^0.12 5:6713:25
22:52
219.5^0.1 0.54^0.21 10.50^0.36 0:7110:66
20:44
218.4^1.1 1.41^1.25 10.62^0.55 4:82112:33
24:75
214.3^1.3 4.02^1.52 10.83^0.16 39:15135:21
224:01
158490 17-08-00 4105 21800 59.5^6.5 30 (1) 225.1^0.3 3.05^0.42 11.60^0.05 22:5416:63
25:77
218.4^0.2 2.10^0.35 11.47^0.06 10:6813:86
23:26
213.0^0.2 1.54^0.37 11.17^0.08 5:7513:09
22:43
159610 16-08-00 4105 31800 54.0^5.6 20 (1) 226.2^0.5 4.38^0.70 11.74^0.06 46:48116:04
213:67
220.8^0.3 1.08^0.55 10.94^0.23 2:8313:61
22:15
215.0^0.6 2.22^0.80 11.05^0.13 11:94110:16
27:06
160765 21-04-00 9105 11200 16.6^4.0 12 (1) 223.7^0.5 4.89^0.74 11.65^0.06 60:09119:18
216:53
11800
aOph 24-04-94 9105 21200 24.5^0.6 19 (1); 28 (4) 231.8^0.9 4.04^0.94 10.55^0.11 39:54120:54
216:26
228.7^0.1 1.06^0.15 10.55^0.15 2:7210:82
20:72
226.4^0.1 1.58^0.19 11.19^0.11 6:0511:54
21:37
224.0^0.5 2.34^0.32 11.09^0.12 13:2713:88
23:38
a
observed towards stars in the galactic centre hemisphere, which they dubbed the ‘G cloud’. It is still unclear whether the LIC and G clouds are separate entities (Frisch 1998), although the absence of a LIC component towards a Cen ðD¼1:35 pcÞ makes this seem likely (Lallement et al. 1995). Indeed, in their recent three-dimensional model of the LIC, Redfield & Linsky (2000) place the Sun very close (&0.05 pc) from the edge of the LIC in the galactic centre direction.
Table 1 lists the expected velocities of the LIC and G clouds towards each of the stars observed here. The vertical dotted lines in Fig. 2 enclose the velocity range occupied by the LIC and G clouds as defined by Lallement et al. (1995; allowing for the^1.1 km s21
velocity uncertainty on each). The velocities predicted from interstellar material actually observed in the Solar System (Frisch 1998) are essentially identical to those predicted for the LIC. Thus, regardless of the precise relationship between the LIC and G
clouds, the dotted lines in Fig. 2 enclose the range of velocities expected for the very closest components of the LISM.
Following a brief discussion of the possible contamination of the present data by circumstellar absorption, the remainder of this section will explore how the present observations can be used to constrain the picture of the LISM sketched above, and how thea
Oph cloud fits into it.
3.2 Possible circumstellar lines
[image:5.594.126.469.51.479.2]Holweger, Hempel & Kamp (1999) have recently drawn attention to the high percentage of normal A-type stars (<30 per cent in their sample) which exhibit narrow circumstellar CaII lines super-imposed on the broader photospheric line profiles. Similar results for circumstellar TiII lines were obtained by Abt, Tan & Zhou (1997). Holweger et al. argue convincingly that many of these lines
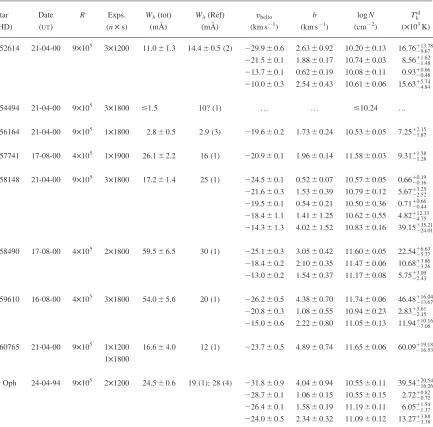
Figure 2.The interstellar Ca K lines towards the observed stars. The observed data are plotted as histograms, and the best-fitting theoretical line profiles (Table 2) are shown superimposed. The radial velocity of the central absorption component towardsaOph (226.2 km s21) is marked by a vertical dashed line in each panel, and the vertical dotted lines give the velocity range expected for the LISM (defined by the range occupied by LIC and G cloud velocities given in Table 1, including the^1.1 km s21
uncertainty). In each panel the published stellar radial velocity (Table 1) is indicated by a star symbol; where these are uncertain by more than^2 km s21
an error bar is included (in the case of HD 159610 I have adopted the velocity obtained from the present observations, cf. Table 1).
844
I. A. Crawford
q2001 RAS, MNRAS327,841–848
arise in edge-on circumstellar discs, similar to that observed in the well-studied case ofbPictoris [see Vidal-Madjar, Lecavelier des Etangs & Ferlet (1998) for a review]. As Holweger et al. point out, the near ubiquity of circumstellar CaIIlines in A stars makes their use as background sources for the study of interstellar lines problematical. Similarly, the presence of weak absorption lines arising in the LISM will confuse searches for circumstellar lines. In general, only if the star has a well-determined radial velocity that is significantly different from an observed narrow absorption line can we be confident that the latter is not circumstellar in origin. Even then some uncertainty must persist, partly because of uncertainties in the stellar radial velocities (especially in the case of suspected spectroscopic binaries), and also because thebPic disc is known to exhibitvariablecircumstellar absorption with velocities up to tens of km s21from the stellar radial velocity [e.g. Vidal-Madjar et al. (1998), and references therein].
In the present case, it is unfortunately true that five out of the eight stars have absorption components very close to the published stellar radial velocities (Fig. 2). Moreover, in all but one of these five cases (HD 158490) these components occur within the velocity range (delineated by vertical dotted lines in Fig. 2) expected for absorption components arising in the LISM. Without additional information it is impossible to be sure whether these components arise in the LISM or in the circumstellar environments of the observed stars.
One way to discriminate between interstellar and circumstellar lines is to search for absorption lines arising from excited levels that can only be populated in a circumstellar environment. For example, Crawford, Craig & Welsh (1997) successfully identified a circumstellar CaII component in the spectrum of 51 Oph by showing that it occurred at the same velocity as an FeIIline arising from an excited level. If narrow circumstellar CaII lines are as common in the spectra of normal A stars as the work of Abt et al. (1997) and Holweger et al. (1999) seems to suggest, similar observational constraints will be required before these stars can be used as reliable probes of the LISM.
3.3 The LIC
With the single exception of HD 154494 (which shows no
interstellar absorption at all to an equivalent-width upper limit of 1.5 mA˚ ), all the stars observed here exhibit absorption components at or near (i.e. within,1 km s21) the velocity range expected for the LISM (vertical dotted lines in Fig. 2). Several of these lie to the more positive velocity side of the LISM band, at or near the velocities expected for the LIC. However, in spite of their LIC-like velocities, there are at least two reasons why we cannot straightforwardly make this identification:
(i) In four cases (HD 152614, 157741, 159610 and 160765), the most LIC-like components also occur at or near the published stellar radial velocities (Fig. 2). As discussed above, this means that a circumstellar origin cannot be excluded, and may in fact be quite likely. However, while the possibility of circumstellar absorption does confuse the issue, it is unlikely to explain away all of these apparently LIC-like velocity components because in two cases (HD 156164 and HD 158148) these occur well away from the published stellar radial velocities (see Fig. 2).
(ii) The carefully constructed LIC model of Redfield & Linsky (2000) places the boundary of the LIC at a distance of only 0.07 pc in the direction ofa Oph, and predicts a corresponding neutral hydrogen column density of NðHÞ<2:21016cm22. For their best-fittingNðCa1Þ/ NðH0Þratioð2:31028Þthis would lead us to expect a LIC CaIIcolumn density of only 5:1108cm22, which is well below the detection limit of the present observations. Thus, if the LIC-like velocity components identified here [all of which have logNðCaiiÞ*10:00; Table 2] really are formed in the LIC the
otherwise well-supported model of Redfield & Linsky (2000) will have to be discarded. It seems much more likely that the very weak LIC components predicted by Redfield & Linsky (expected Wl,0:1 mAÞ are actually present towards all these stars (including HD 154494) but are masked by the relatively poor signal-to-noise ratio and the presence of stronger components at similar velocities.
Given that the dynamics of the whole LISM is dominated by outflow from the Sco-Cen association (e.g. Frisch 1995; Breitschwerdt et al. 2000), the detection of more distant interstellar clouds with LIC-like velocities is quite plausible. Theb-values of these stronger components generally imply upper limits to the kinetic temperature in the range 6000 to 9000 K (Table 2), so if they do represent more distant clouds, these appear to have physical conditions similar to the LIC. The CaIIcolumn densities of these components are also similar to those across the whole extent of the LICðlogN<10:60 cm22; Redfield & Linsky 2000), with the exception of those towards HD 160765 and HD 157741 which are an order of magnitude larger (but which, again, may be circumstellar and/or contain additional unresolved velocity structure).
3.4 The G cloud
[image:6.594.51.287.53.194.2]One striking observation from Fig. 2 is the general absence of components which can readily be attributed to the G cloud (i.e. absorption components close to the left-hand side of the LISM band, delineated by the vertical dotted lines in the figure). Note that whereas the non-detection of the LIC towards these stars can easily be explained by its expected very low column density in this direction (Redfield & Linsky 2000; see discussion in Section 3.3), the same argument cannot be so easily invoked to explain the apparent absence of G cloud components, as the lines of sight would be expected to sample the whole extent of the cloud. Typical
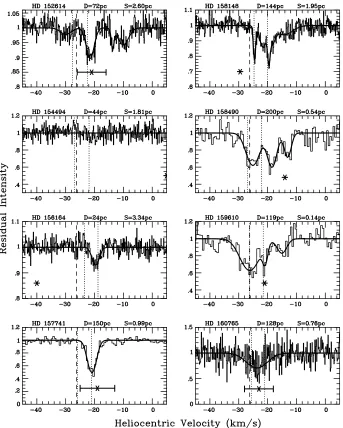
Figure 3.The interstellar Ca K line towardsaOph (obtained by Crawford & Dunkin 1995; bold line) compared with those obtained here towards HD 158490 (light line) and HD 159610 (dotted line). The new best-fitting theoretical profile foraOph (Table 2) is also shown. The vertical dashed and dotted lines have the same meaning as in Fig. 2. The slightly variable, but well-determined, radial velocity ofaOph itselfð112^5 km s21Þlies
outside the frame.
a
G cloud CaIIcolumn densities given by Bertin et al. (1993) lie in the range 21010to 41010cm22ðW
l<2–4 mAÞ, which should be detectable in the present data (excluding the very noisy spectrum of HD 160765), if present.
It is true that three stars (HD 158148, 158490 and 159610) do have absorption components with G cloud-like velocities. However, in the former case the component is too narrowðb¼
0:52 km s21Þ to arise in a warm medium like the G cloud (see Section 3.6), while those towards HD 158490 and HD 159610 are better interpreted as arising in a separate cloud responsible for the anomalously strong absorption towardsa Oph (see Section 3.5; although in this case blending with a weaker G cloud component cannot be excluded).
The boundaries of the G cloud have never been rigorously defined, and as reviewed by Frisch (1998), it is still unclear whether it really represents an interstellar structure separate from the LIC. When introducing the concept of a separate G cloud, Lallement & Bertin (1992) identified a galactic longitude range of 2108 &l& 608 and a latitude range of 2708 &b& 1408. All the stars observed here fall within this very large area of sky, and, as a G cloud component has been identified in the spectrum of the very nearest star (aCen,D¼1:35 pc; Lallement et al. 1995), G cloud components might be expected towards all these stars.
It is noteworthy, however, that the region of sky considered here lies close to the northern boundary of the G cloud as defined by Lallement & Bertin (1992; cf. their fig. 3). Given that this boundary is poorly defined, the most plausible explanation for the lack of G cloud components is that these lines of sight have in fact missed it completely. In this interpretation, the a Oph-like components (discussed below) arise in a separate, more distant (but still ,14 pc) interstellar structure. The alternative, that the present observations straddle the G cloud boundary with a Oph, HD 159610 and HD 158490 lying within it and the other stars lying outside, is effectively excluded by the non-detection of the G cloud towards g Oph ðl¼28:08, b¼15:48, D¼29 pc; open circle in Fig. 1) by Crawford et al. (1997).
Interestingly, in their recent work on the LIC, Redfield & Linsky (2000) have tentatively identified the area of sky lying within 408of
a Oph as being occupied by the G cloud. This more restricted definition gives the G cloud a smaller angular extent than given by Lallement & Bertin (1992), but moves its northern boundary to much more positive galactic latitudes. It is clear from Fig. 1 that this definition would predict G cloud component towardsallof the stars observed here, and can probably be excluded by the present observations.
3.5 TheaOph cloud components
The velocity of the main absorption component towards a Oph (226.4 km s21; Table 2) is essentially identical to that predicted for the G cloud (Table 1). However, as discussed above, the non-detection of this feature towards the other stars makes this identification unlikely. Moreover, as first noted by Bertin et al. (1993), the column density of this component ½logNðCaiiÞ*
11:20; Table 2] is approximately an order of magnitude greater than found for other G cloud components. Although Bertin et al. suggested that the most likely explanation was the presence of another cloud blended with the G cloud in velocity space, it now seems most likely that there is no G cloud towardsa Oph, just several (at least three – cf. Table 2; also Crawford & Dunkin 1995) more distant clouds with G (and LIC)-like velocities. As noted in Section 3.3, the fact that the whole LISM is dominated by the
Sco-Cen outflow makes this apparent velocity coincidence less surprising than it might at first appear.
Only the two stars closest toaOph on the sky (HD 158490 and HD 159610) exhibit absorption components with velocities
ðvhelio<226 km s21Þ sufficiently close to those of the a Oph components to be plausibly identified with them. This in itself limits the linear extent of the absorbing structure to,1 pc in the (galactic) east – west direction, even if it were as distant as 14 pc (Fig. 1). Similarly, the absence of such a component towards HD 157741 means that the absorbing cloud must have a linear extension of,1 pc north ofaOph. To the south, the size of the cloud is less constrained owing to the scarcity of observations in this region. Nevertheless, the non-detection of an a Oph-like velocity component towardsg Oph (Crawford et al. 1997; open circle in Fig. 1) effectively places a limit of,3 pc in this direction also.
Thus, while the present observations have uncovered more complex interstellar line profiles than suspected by Mu¨nch & Unso¨ld (1962), their basic conclusion remains: the interstellar structure responsible for the anomalously strong interstellar absorption towards a Oph has a linear extent of &1 pc (and probably!1 pc). As pointed out by Frisch et al. (1987) this spatial scale, and the heliocentric velocities, are consistent with those found in the 21-cm HImaps of this region obtained by Colomb, Po¨ppel & Heiles (1980), although, as always, it is difficult to be sure that the HIemission actually occurs this side of the star. Given this small spatial scale, and the recent evidence for temporal variability in interstellar line profiles arising from small-scale structure towards other stars (e.g. Crawford et al. 2000; Lauroesch, Meyer & Blades 2000; Price, Crawford & Barlow 2000) a search for temporal changes in the interstellar spectrum ofaOph may be worthwhile. This would further help constrain the spatial scale of the absorbing structures(s).
Fig. 3 shows the interstellar line profiles observed towards HD 158490 and HD 159610 superimposed on the spectrum ofaOph obtained by Crawford & Dunkin (1995). Within the limits imposed by the signal-to-noise ratios, it is apparent that theaOph profile agrees well with those of the most blue shifted (i.e. most LISM-like) components towards HD 158490 and HD 159610, but that these latter stars display additional absorption, at less negative velocities (discussed briefly in Section 3.7).
As modelled here, the b-values of the putative a Oph-cloud components towards these stars are quite large (3 to 4 km s21), implying implausibly high kinetic temperatures (Table 2). However, as discussed by Crawford & Dunkin (1995; see also Table 2), the interstellar CaIIline towardsaOph is very complex, with a total of four discrete absorption components being present. The signal-to-noise ratios obtained here are insufficient for the detection of this structure, which will therefore manifest itself as a single broad component. Indeed, if we interpret the broad225.1 and 226.2 km s21 components towards HD 158490 and HD 159610 respectively, to correspond to a blend of the228.7,226.4 and 224.0 km s21components towardsa Oph, we find that the CaII column densities are very similar ðlogN<11:60^0:10Þ. Only much higher signal-to-noise ratio observations will reveal whether all the velocity structure known to be present towardsa
Oph is actually present towards these stars as well.
3.6 The narrow components
One of the major advantages of ultra-high-resolution spectroscopy is its ability to unambiguously detect intrinsically narrow lines.
846
I. A. Crawford
q2001 RAS, MNRAS327,841–848
Observed at lower resolution, these lines are often lost through blending with neighbouring components, and in any case their intrinsic widths cannot be measured reliably if these are narrower than the instrumental resolution. This is well-illustrated by the case of HD 152614 (iOph), which was observed with a resolving power ofR<150 000 by Vallerga et al. (1993). Their spectrum is very similar to that found here, but whereas they clearly resolved only three velocity components (at vhelio¼230:8, 221.5, and
211.0 km s21), the present data reveal the presence of an
additional, very narrow ðb¼0:62^0:19 km s21Þ component at
213.7 km s21. Inspection of Vallerga et al.’s actual spectrum (their fig. 1) does in fact show some evidence for this feature, blended with their 211.0 km s21 component, but they were unable to resolve it properly and thus, of necessity, it went unanalysed.
In addition to this narrow component towards HD 152614, the present work has identified two comparably narrow components towards HD 158148, atvhelio¼224:5 km s21 ðb¼0:52^0:07Þ and219.5 km s21ðb¼0:54^0:21 km s21Þ. These narrow com-ponents are of interest because theb-values imply rigorous upper limits to the kinetic temperature,Tul
k, in the range 700 to 900 K (Table 2), far lower than encountered on the nearby LISM clouds. As all interstellar clouds are turbulent to some extent, the actual kinetic temperatures are probably significantly lower. Note, moreover, that a LIC-like turbulence can also be excluded for these components; Linsky et al. (1995) measured a one-dimensional rms turbulent velocity for the LIC of <1 km s21, which would yieldb¼1:4 km s21, even ifT
k¼0 (see equation 1 of Crawford et al. 1997).
It is interesting that the two narrow components present towards HD 158148 have LISM-like velocities (Fig. 2), although linewidth considerations would seem to argue against a LISM origin. The narrow component towards HD 152614 lies well away from the LISM velocity range. In this direction, radial velocities with respect to the local standard of rest (LSR) are approximately 16 km s21more positive than heliocentric values, so these narrow components all have low negative (or, in the case of HD 152614, low positive) LSR velocities. Thus, one possibility, and perhaps the most likely, for the origin of these narrow components is in cool, relatively dense, background interstellar clouds, perhaps related to similar components identified in NaIabsorption lines in the first galactic quadrant by Ge´nova et al. (1997) and attributed by them to interstellar material unaffected by the Sco-Cen outflow(s).
On the other hand, while at first sight a location outside the Local Bubble seems the most likely location for these narrow components, and is consistent with the stellar distances (72 and 144 pc for HD 152614 and HD 158148, respectively), a more local origin cannot be absolutely excluded. In this respect it is worth noting that the discovery of almost comparably narrow ðb& 1 km s21Þcomponents towardsdVelðD¼24 pcÞandaPavðD¼ 56 pcÞ by Crawford, Lallement & Welsh (1998) has raised the possibility that a population of such cool, relatively dense clouds exists within the Local Bubble, but has been missed by earlier, lower resolution observations. It would be interesting to know if such a population of cool clouds within the Local Bubble would be predicted by models, such as that of Breitschwerdt et al. (2000), for the origin of the LISM clouds.
3.7 Other interstellar components
In addition to the various absorption components discussed above, several stars exhibit additional velocity components. Specifically, HD 152614, HD 158148, HD 158490 and HD 159610 all have one
or more relatively broad ð2&b&4 km s21Þ components in the velocity range 220&vhelio& 210 km s21. This heliocentric velocity range corresponds to velocities which are effectively at rest in the local standard of rest ð24&vLSR& 16 km s21Þ, suggesting an origin in more distant material not partaking in the general motion of the LISM. In addition, HD 152614 also has a weak component at the more negative heliocentric velocity of 230 km s21; although barely significant in the present data (Fig. 2), this component was also detected by Vallerga et al. (1993) and is certainly real.
While it is possible that some of these components may be circumstellar (Fig. 2), this cannot plausibly account for all of them. It is notable that all four of these stars are fairly distantðD.70 pc, and only HD 152614 lying closer than 100 pc), and many discrete absorption components arising in low-density clouds along these lines of sight would be expected. For example, in the case of the much-studied, and comparably distant, star z Oph ðl¼6:288,
b¼123:598, D¼140116
212pcÞ, Barlow et al. (1995) identified a total of 12 interstellar CaII components in the velocity range 235&vhelio& 25 km s21 on the basis of high signal-to-noise ratio UHRF spectra (cf. their fig. 6). From this perspective it is highly likely that at least the broadest of these components contain additional velocity structure which is obscured by the relatively low signal-to-noise ratio of the present observations.
4 C O N C L U S I O N S
By obtaining very high resolution observations of interstellar CaII absorption lines towards eight early-type stars within 158ofaOph on the sky, I have reached the following conclusions:
(i) Components with velocities ðvhelio<226 km s21Þ suffi-ciently close to those of the a Oph cloud component(s) to be plausibly identified with them are only found towards the two stars which are closest toaOph on the sky (HD 158490 and HD 159610; cf. Fig. 3). This confirms the result of Mu¨nch & Unso¨ld (1962), that the interstellar structure responsible for the anomalously strong CaIIabsorption towardsaOph has a spatial extent of&1 pc (and is probably very much less). Given this small size, it is suggested that a search for temporal variability would be of interest.
(ii) Although absorption components with velocities close to that predicted for the Local Interstellar Cloud occur towards five of the eight stars studied, the column densities ½logNðCaiiÞ*10:00;
Table 2] are about two orders of magnitude higher than predicted for the LIC in this direction by the recent model of Redfield & Linsky (2000). It seems likely that some of these components are infact circumstellar (Section 3.2), with the others arising in more distant clouds which nevertheless have LIC-like velocities owing to the general outflow from the Sco-Cen association, which dominates the dynamics of the local interstellar medium.
(iii) The non-detection of the so-called G cloud of Lallement & Bertin (1992) towards these stars argues against theaOph cloud(s) being part of this structure, despite the coincidence in velocities. As is the case for the LIC-like components, the a Oph cloud(s) probably lies outside the immediate vicinity of the Sun, but exhibits LISM-like velocities owing to the influence of Sco-Cen outflow(s).
(iv) This suggests that the northern boundary of the G Cloud (assuming that such a discrete entity exists at all) lies south of
b<158 in this galactic longitude range [where the strongest constraint comes from the non-detection towardsgOph reported by Crawford et al. (1997)]. This is just about compatible with the
a
distribution sketched by Lallement & Bertin (1992), given the uncertainties, but not with the suggestion of Redfield & Linsky (2000) that the G cloud occupies the area of sky lying within 408of
aOph.
(v) Three very narrow ðb&0:6 km s21Þ components were identified, one towards HD 152614 (iOph) and two towards HD 158148. These components have low velocities with respect to the LSR, and probably arise in coolðTk&700 K and probably much lower), relatively dense, background interstellar clouds unaffected by the flow(s) away from the Sco-Cen association (see also Ge´nova et al. 1997). However, an origin within the Local Bubble cannot be excluded given the detection of similarly narrow components towards two somewhat closer stars (dVel,D¼24 pc;aPav,D¼
56 pcÞby Crawford et al. (1998). Thus it remains possible that a population of cool clouds in the immediate vicinity of the Sun has been missed by earlier, lower resolution, surveys.
A C K N O W L E D G M E N T S
I am indebted to Professor I.D. Howarth for his work in developing theVAPIDline-fitting routine. I thank Richard Price for performing the 2000 August observations, PATT for the award of telescope time, and PPARC for the award of an Advanced Fellowship. This research has made use of theSIMBADdata base, operated at CDS, Strasbourg.
R E F E R E N C E S
Abt H. A., Tan H., Zhou H., 1997, ApJ, 487, 365
Barlow M. J., Crawford I. A., Diego F., Dryburgh M., Fisf A. C., Howarth I. D., Spyromilio J., Walker D. D., 1995, MNRAS, 272, 333 Bertin P., Lallement R., Ferlet R., Vidal-Madjar A., 1993, A&A, 278, 549 Breitschwerdt D., Freyberg M. J., Egger R., 2000, A&A, 361, 303 Colomb F. R., Po¨ppel W. G. L., Heiles C., 1980, A&AS, 40, 47 Cox D. P., Reynolds R. J., 1987, ARA&A, 25, 303
Crawford I. A., 1991, A&A, 247, 183
Crawford I. A., Dunkin S. K., 1995, MNRAS, 273, 219
Crawford I. A., Craig N., Welsh B. Y., 1997, A&A, 317, 889 Crawford I. A., Lallement R., Welsh B. Y., 1998, MNRAS, 300, 1181 Crawford I. A., Howarth I. D., Ryder S. D., Stathakis R. A., 2000, MNRAS,
319, L1
Diego F., 1993, Appl. Opt., 32, 6284 Diego F. et al., 1995, MNRAS, 272, 323
ESA, 1997, The Hipparcos and Tycho Catalogues, ESA SP-1200 Ferlet R., 1999, A&AR, 9, 153
Frisch P. C., 1981, Nat, 293, 377
Frisch P. C., 1995, Space Sci. Rev., 72, 499 Frisch P. C., 1998, Space Sci. Rev., 86, 107
Frisch P. C., York D. G., Fowler J. R., 1987, ApJ, 320, 842 Ge´nova R., Beckman J. E., Bower S., Spicer T., 1997, ApJ, 484, 761 Holweger H., Hempel M., Kamp I., 1999, A&A, 350, 603
Howarth I. D., Murray J., Mills D., Berry D. S., 1998, Starlink User Note, 50.21
Lallement R., Bertin P., 1992, A&A, 266, 479
Lallement R., Vidal-Madjar A., Ferlet R., 1986, A&A, 168, 225 Lallement R., Ferlet R., Lagrange A. M., Lemoine M., Vidal-Madjar A.,
1995, A&A, 304, 461
Lauroesch J. T., Meyer D. M., Blades J. C., 2000, ApJ, 543, L43 Linsky J. L., Diplas A., Wood B. E., Brown A., Ayres T. R., Savage B. D.,
1995, ApJ, 451, 335
Mu¨nch G., Unso¨ld A., 1962, ApJ, 135, 711 Paresce F., 1983, Nat, 302, 806
Price R. J., Crawford I. A., Barlow M. J., 2000, MNRAS, 312, L43 Redfield S., Linsky J. L., 2000, ApJ, 534, 825
Schmidt-Kaler T. H., 1982, in Schaifers K., Voigt H. H., eds, Landolt-Bo¨rnstein, Numerical Data and Functional Relationships in Science and Technology, Group VI, Astronomy, Astrophysics and Space Research, Vol. 2b. Springer-Verlag, Berlin
Shortridge K. et al., 1998, Starlink User Note, 86.16
Vallerga J. V., Vedder P. W., Craig N., Welsh B. Y., 1993, ApJ, 411, 729 Vidal-Madjar A., Lecavelier des Etangs A., Ferlet R., 1998, Planet. Space
Sci., 46, 629
Welty D. E., Morton D. C., Hobbs L. M., 1996, ApJS, 106, 533
This paper has been typeset from aTEX/LATEXfile prepared by the author.
848
I. A. Crawford
q2001 RAS, MNRAS327,841–848