Munich Personal RePEc Archive
Inflation Targeting and Inflation
Convergence within Turkey
Yilmazkuday, Hakan
2009
Online at
https://mpra.ub.uni-muenchen.de/16770/
Inflation Targeting and Inflation Convergence within Turkey
*Hakan Yilmazkuday† Temple University
August 2009
Abstract
Using a disaggregated level CPI data, this paper compares bilateral convergence properties of Turkish regional inflation rates between pre-inflation-targeting and inflation-targeting periods. Rather than using an ad hoc date for the introduction of inflation-targeting regime, structural break dates are estimated for Turkish national inflation rate as well as the standard deviation of Turkish regional inflation rates. The first moment of Turkish national inflation rate has an estimated break at the beginning of explicit inflation-targeting regime in January 2002, and the second moment of Turkish regional inflation rates has an estimated break at the financial crisis in February 2001 after which Turkey adopted a flexible exchange rate. It is found that during the inflation-targeting period, Turkish regional inflation rates have converged to each other in terms of CPI groups with relatively non-tradable components, and they have diverged from each other in terms of CPI groups with relatively tradable components.
JEL Classification: E31, E50, E52, R12.
Key Words: Inflation Targeting; Inflation Rate Convergence; Regional Analysis; Turkey.
* The author would like to thank Carl Walsh for his helpful comments and suggestions. All errors are the author’s own responsibility.
I. INTRODUCTION
There is a large body of evidence of the convergence of inflation rates among the countries under a common monetary policy and currency. However, there is less evidence on the convergence of regional inflation rates within a country: Have they already converged? Is there a role for national monetary policy in explaining the convergence of regional inflation rates within a country? The answers emerge from the investigation of this paper comparing the convergence properties of inflation rates among geographical regions of Turkey between the pre-inflation-targeting and inflation-pre-inflation-targeting periods.1
The convergence of inflation rates at the regional level is important, because persistent differences in (actual and expected) inflation among regions of a country may lead to disparities in regional real interest rates, given a common national monetary policy.2 These diversities may be exacerbated by cyclical considerations: a region where economic activity is relatively subdued is likely to have weak inflationary pressures and therefore experience a relatively high real interest rate; this in turn could further add to the divergence of inflation. On the other hand, sharing a common national exchange rate, inflation differentials may work as an adjustment mechanism: regions with higher productivity or lower wage growth than others would experience a depreciation of the real exchange rate (i.e., a fall in relative prices) and thus a gain in trade competitiveness. Overall, whether the expansionary effects associated with a real-interest-rate reduction or the contractionary ones induced by real-exchange-rate appreciation, due to a positive inflation differential would dominate, and the horizon at which this might happen, is an empirical question. The answer will depend to a large extent on the magnitude of inflation differentials and on their persistence. However, part of the differences in inflation could also be due to regional heterogeneities in the relative productivity growth of the tradable versus the non-tradable sector (the so-called Balassa-Samuelson effect), and therefore they might last as long as these persist.
This paper investigates the bilateral convergence patterns of inflation rates among Turkish geographical regions, namely Marmara, Aegean, Black Sea, Central Anatolia, Eastern Anatolia, Southeastern Anatolia and Mediterranean. The motivation mainly comes from two sources: (i) decreasing inflation rates in the inflation-targeting period, (ii) the estimated structural breaks in the first and second moments of inflation within Turkey. Specifically, the structural break analysis estimates that the national inflation rate has a break right after the beginning of inflation-targeting regime in January 2002; and the cross-sectional standard deviation of regional inflation rates has a break right before the financial crisis in February 2001, after which Turkey adopted a flexible exchange rate and started relevant reforms in the economy to begin conducting inflation targeting. These estimated break dates are used to analyze the possible effects of an inflation-targeting regime, together with a flexible exchange rate regime, on the convergence regional inflation rates. Consistent with the Balassa-Samuelson effect, it is found through a disaggregated level regional analysis that during the pre-inflation-targeting period, regional inflation rates have converged to each other more (respectively, less) in terms of CPI groups with more tradable (respectively, non-tradable) components. However, during the inflation-targeting
1 For the effects of inflation targeting on the economic performance of the adopting countries, see Neumann and von Hagen (2002); Mishkin (2002); Ball and Sheridan (2003); Goncalves and Salles (forthcoming); Goncalves and Carvalho (2007).
period, regional inflation rates have converged to each other more (relatively, less) in terms of CPI groups with more non-tradable (relatively, tradable) components. According to the Balassa-Samuelson effect, this means that the inflation-targeting period coincides with a productivity growth of non-tradable goods and a productivity fall in tradable goods. Since the inflation-targeting period also corresponds to a flexible exchange rate regime in Turkey, these results may also suggest that the traded good shares differ across Turkish regions, so that a high volatility in the exchange rates (due to the flexible exchange rate regime) is reflected in the regional inflation rate differences.
Related Literature
In this subsection, it is briefly described how this paper relates to its closest antecedents. The concept of inflation convergence has been widely used in order to analyze the inflation patterns of a group of regions and/or countries. A common monetary policy among the regions of a country or the members of a union is supposed to have a convergence effect on the individual inflation rates. The most popular studies in the context of a union have focused on the convergence experience within the EMU. For alternative evidence on the inflation convergence within the EMU, see Kocenda and Papell (1997), Siklos and Wohar (1997), Holmes (2002), Beck and Weber (2001), Honohan and Lane (2003), Mentz and Sebastian (2003), Beck et al. (2006), Busetti et al. (2007), among many others. Besides the convergence within the EMU, Beck et al. (2006) have also focused on the convergence patterns of the regions of a country, the United States (US), and have found that inflation dispersion among European regions is higher than in the US. Their result supports the view that the inflation convergence within a country is more plausible compared to the one within a union of countries.
However, none of the studies above has investigated the possible effects of monetary policy, especially an inflation-targeting regime or a flexible exchange rate regime, on the convergence properties of regional inflation rates within a country. This paper bridges this gap by employing a formal analysis of bilateral convergence among inflation rates of Turkish regions. The selection of the Turkish economy for this paper is mostly due to the fact that the economy had its transition from high annual inflation rates of 100% to low annual inflation rates of below 10% through its inflation targeting experience. Moreover, the monthly data of regional Consumer Price Index (CPI) obtained from Turkstat for the period of 1994-2004 is convenient to compare convergence properties of regional inflation rates between the pre-targeting and targeting periods.
The rest of the paper is organized as follows. The next section depicts the data. Section III provides a brief description of the inflation dynamics of Turkey at the national and regional levels. Section IV makes a formal convergence analysis. Section V concludes.
II. DATA
The Turkish inflation rate, at both the national and regional level, is defined as the first log difference of monthly Consumer Price Index (CPI) obtained from Turkstat.3 The price indices cover the regions of Turkey, namely Marmara, Aegean, Black Sea, Central Anatolia, Eastern Anatolia, Southeastern Anatolia and Mediterranean, over the monthly periods during 1994-2004. The data cannot be extended for the period after 2004, because that is the date when Turkstat changed its definition of CPI for the regions from which price data are collected.
Table 1 – CPI Components
1 - Food, Beverage And Tobacco 3 - Housing And Rent 6 – Transportation
Food Rent Purchase Of Vehicles
Bread And Cereals Actual Rent Motor Cars
Bread Imputed Rent Bicycles And Motor Cycles Cereals And Cereal Products Maintenance And Repair Of Maintenance And Repairs O Meat And Meat Products Products For The Maintenance Spare Parts And Accessories
Meat Services For The Maintenance Fuels And Lubricants
Meat Products Maintenance And Repairs
Fish 4 - Other Housing Other Services In Respect Milk, Cheese And Eggs Water Supply Transports Services Milk And Milk Products Electricity, Gas and Fuels Local Transport of Individuals
Eggs Electricity Long-Distance Transport O
Oils And Fats Gas Other Purchased Transport
Margarine Liquid Fuels
Oils Other Fuels 7 - Leisure and Entertainment Fresh-Dried Vegetables Furniture And Furnishings Equipment And Accessories
Fruits Furniture, Floor Covering Equip. For The Reception, Fresh Fruits Furniture Equipment For Sports, Cam Dried Fruits Floor Coverings Games, Toys And Hobbies Vegetables (Potatoes ) Household Textiles And Re Recording Media For Pictures
Fresh Vegetables Household Textiles Repair Of Equipment And A Dried Vegetables Household Appliances Recreational And Cultural Canned Vegetables Major Electrical Appliances Group Recreational Services
Tubers Small Electrical Appliances Other Recreational Services Sugar Small Non-Electrical Appl. Newspapers, Books And Stationery Jam, Honey, Chocolate Repair of Household Appl. Books
Salt, Spices, Condiments Glassware, Tableware Newspapers And Miscellaneous Beverages Tools And Equipment For T Stationery And Drawing Material Coffee, Tea And Cocoa Small Tools - Miscellaneous
Tea Repair Goods And Services 8 - Education Coffee And Cocoa Non-Durable Household Good Educational Services Non-Alcoholic Beverages Domestic Services Pre-Primary And Primary E
Water Secondary Education
Alcoholic Beverages 5 - Health Tertiary Education Cigarettes And Tobacco Medical And Pharmaceutical Others
Cigarettes Pharmaceutical Preparations Educational Materials Cigarettes With Filter Other Medical Products
Cigarettes Without Filter Therapeutic Appliances An 9 - Hotels, Cafes And Restaurants Cigarettes of Foreign Brand Non-Hospital Medical And Catering
Tobacco Services Of Physicians Restaurants
Dentistry Pastry Shops, Buffets And Picnic Services 2 - Clothing And Footwear Medical Analyses Hotel Services
Clothing Services Of Medical Auxiliary
Garments Hospital Services 10 - Miscellaneous Goods And Services Men's Garments Basic Hospital Services Personal Care
Women's Garments Medical And Paramedical Personal Care Services Children's Garments Electrical Appliances For Personal Care
Babies's Garment Other Articles And Products For Personal Care
Fabrics Jewellery, Clocks And Watches
Clothing Accessories Jewellery, Clocks And Watches Clothing Repair, Cleaning Other Personal Articles
Footwear Communications
Shoes And Other Footwear Postal Services
Men's Footwear Telephone, Telegraph And Telefax Services
Women's Footwear Financial Services
Children And Baby Footwear Other Services
The disaggregated level data also cover 10 main expenditure based CPI groups for each region: (1) food, beverage and tobacco, (2) clothing and footwear, (3) housing and rent, (4) other housing expenditure, (5) health, (6) transportation, (7) leisure and entertainment, (8) education, (9) hotels, cafes and restaurants, (10) miscellaneous goods and services. These CPI groups represent the price level of the good categories given in Table 1, where the bold font is used to distinguish the CPI groups from the good categories with normal font. While CPI groups such as housing and rent, other housing expenditures, health, hotels, cafes and restaurants, and miscellaneous goods and services mostly represent non-tradable goods, the other CPI groups are mostly including tradable goods. These features of CPI groups are going to be used during the text.
[image:6.595.99.459.366.615.2]Although the raw data are used in the figures, the seasonally adjusted data are used in the formal analysis. The conventional Augmented Dickey Fuller Tests (ADF) are used for all the lags from 0 to 4, i.e. from ADF(0)-ADF(4), by including a constant term only, and a linear trend together with a constant term in ADF equations. The results suggest that all the regional inflation series are I(1) at least at the 10% significance level for the period of 1994-2004.4
Figure 1 – Monthly Inflation Rate of Turkey
-5 0 5 10 15 20 25
Jan-94 Jan-96 Jan-98 Jan-00 Jan-02 Jan-04
Notes: The number of breaks, which is 1, and the break date (January 2002) are estimated using the sequential method of Bai and Perron (1998, 2003) at the 1% level, simply by regressing the vector of the inflation rate on a vector of ones. Although the results are not shown here, all the regional monthly inflation rates have exactly the same structural break date, January 2002, when the same analysis is followed as for the national inflation. The inflation rate is defined as the first log difference of CPI obtained from Turkstat.
4 These results are available upon request.
Inflati
o
III. DESCRIPTIVE ANALYSIS
[image:7.595.75.519.303.404.2]After a long history of high inflation, Turkey adopted an inflation-targeting regime explicitly starting from January 2002.5 The huge difference in inflation rates in Turkey between the pre-targeting and pre-targeting periods is the main motivation of this study. In particular, the monthly national inflation rate for the period of 1994-2004 is shown by Figure 1. As is evident, there is a structural break in the rate of national inflation right at the beginning of the explicit inflation targeting. This structural break in the rate of national inflation is estimated by the sequential method of Bai and Perron (1998, 2003) at the 1% level, simply by regressing the inflation rate on a vector of ones.6 Table 2 provides the summary results of Figure 1. As is evident, the mean monthly inflation rate is around 4.73% in the pre-inflation-targeting period, and it is around 1.33% in the targeting period. These numbers show the success of the inflation-targeting regime for Turkey.7
Table 2 – Structural Break for Turkish Inflation
February 1994 – January 2002 February 2002 – December 2004
Inflation 4.73*
(0.22)
1.33* (0.36)
Rbar-sqd. 0.33
Notes: Standard errors are in parenthesis. * stands for significance at the 1% level. The number of breaks, which is 1, and the break dates are estimated using the sequential method of Bai and Perron (1998, 2003) at the 1% level, simply by regressing the inflation rate on a vector of ones.
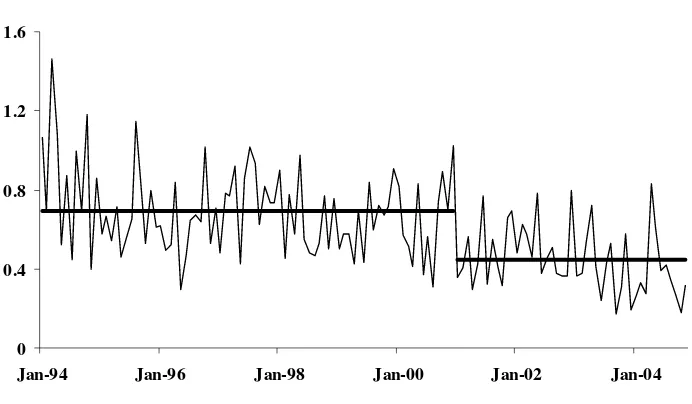
Although the selection of the inflation-targeting regime as a monetary policy seems appropriate to control the national rate of inflation, the convergence properties of regional inflation rates are still uncertain in Turkey, which is as a small open economy whose regions are sharing the very same monetary policy and nominal exchange rate. To shed light on this uncertainty, the cross-sectional standard deviation of the Turkish regional inflation rates is depicted in Figure 2. As is evident, the cross-sectional standard deviation has a structural break in January 2001, which is right before the financial crisis of February 2001 after which Turkey adopted a flexible exchange rate rule with the relevant reforms to start conducting inflation targeting regime. This structural break in the cross-sectional standard deviation of Turkish regional inflation rates is again
5 The headline CPI inflation is used as a target in Turkey. See Akay and Yilmazkuday (2008): Ertugrul and Selcuk (2002) for detailed analyses of the Turkish economy for the period 1980-2001. See Yilmazkuday (2007) for an analysis of the Turkish inflation targeting experience. See Berument and Tasci (2004); Berument (2003, 2007); Yazgan and Yilmazkuday (2007) for different inflationary episodes and monetary policy specifications in Turkey. See Yazgan and Yilmazkuday (2005) for an analysis of the inflation dynamics of Turkey.
6 The modified gauss codes of Bai and Perron (1998, 2003) that are actually used in the paper are available upon request.
estimated by the sequential method of Bai and Perron (1998, 2003) at the 1% level, simply by regressing the cross-sectional standard deviation on a vector of ones.8
Figure 2 – Cross-Sectional Standard Deviation of Turkish Regional Inflation Rates
0 0.4 0.8 1.2 1.6
Jan-94 Jan-96 Jan-98 Jan-00 Jan-02 Jan-04
Notes: The number of breaks, which is 1, and the break date (January 2001) are selected using Bai and Perron’s (1998, 2003) sequential method at the 1% level, simply by regressing the vector of cross-sectional standard deviation on a vector of ones. The inflation rate is defined as the first log difference of CPI obtained from Turkstat.
Table 3 provides the summary results for Figure 2. As is evident, the cross-sectional standard deviation of regional inflations is around 0.69 in the pre-crisis period, and is around 0.45 in the post-crisis period.
Table 3 – Structural Break for Cross-Sectional Standard Deviation of Turkish Regional Inflation Rates
February 1994 – January 2001 February 2001 – December 2004
Cross-Sectional Standard Deviation
0.69* (0.02)
0.45* (0.03)
Rbar-sqd. 0.25
Notes: Standard errors are in parenthesis. * stands for significance at the 1% level. The number of breaks, which is 1, and the break dates are selected using Bai and Perron’s (1998, 2003) sequential method at the 1% level, simply by regressing the cross-sectional standard deviation on a vector of ones.
8The modified gauss codes of Bai and Perron (1998, 2003) that are actually used in the paper are available upon
To have a smoother picture of the second moment of inflation across the regions of Turkey, the twelve-month moving average of cross-sectional standard deviation is shown in Figure 3.
Figure 3 – Twelve-Month Moving Average of Cross-Sectional Standard Deviation
0.25 0.5 0.75 1
Jan-95 Jan-97 Jan-99 Jan-01 Jan-03
Figure 4 –Twelve-Month Moving Average of the Absolute Difference between Turkish Inflation and Regional Inflations
0 0.5 1 1.5
Jan-95 Jan-97 Jan-99 Jan-01 Jan-03
Southeastern Eastern Black Sea Central
[image:9.595.115.487.509.688.2]The twelve-month average of the absolute difference between Turkish inflation and each regional inflation rate is also shown in Figure 4. The cross-sectional mean of the curves in Figure 4 is given in Figure 5. Overall, Table 2, together with Figures 2-5, suggests that the cross-sectional standard deviation across the regions has decreased dramatically in the inflation-targeting period. Nevertheless, the inflation rate has also decreased according to the results in Table 1; hence, it is hard to decide whether there is a convergence across regional inflation rates according to Tables 1 and 2. This controversy suggests a necessity for a formal analysis of convergence (of inflation rates) across the bilateral pairs of Turkish regions.
Figure 5 –Cross-Sectional Mean of Twelve-Month Moving Average of the Absolute Difference between Turkish Inflation and Regional Inflations
(Cross-Sectional Mean of Figure 4)
0.25 0.5 0.75
Jan-95 Jan-97 Jan-99 Jan-01 Jan-03
IV. A FORMAL CONVERGENCE ANALYSIS
In order to test formally the convergence of inflation rates across Turkish regions, a pair-wise approach recently developed by Pesaran (2007) is used. Several methods for testing convergence have been proposed in the literature.9 The so-called beta and sigma-convergence are two of those methods that have been extensively used in the growth literature. In this study, these approaches are not followed as they have been subject a number of criticisms (see Durlauf et al., 2005, and Pesaran, 2007), and their usage is not appropriate in the present context.10
9 Durlauf and Quah (1999) and Durlauf et al. (2005) provide general surveys on the empirics of growth and
convergence. Rey and Janikas (2005) focus their survey on the spatial elements of regional convergence.
The other possibility could have been to apply unit root tests to inflation rates differences measured with respect to a reference country/region, which is obviously more practical, but is not invariant to the choice of the benchmark country/region and as a result can lead to misleading conclusions. However, as shown by Pesaran (2007), a formal test of cross-country/regional convergence can be developed by focussing on pair-wise output gaps, without choosing a reference country or region.
Convergence requires regional inflation rates to be cointegrated with the cointegrating vector of the form (1, 1)− , i.e. the difference between regional inflation rates dti j, =π πti− tj, i=1,...,N−1
and j= +i 1,...,N should be stationary (not having unit root) for all (N N−1) / 2 possible regional inflation rates. Following Pesaran (2007), to analyse convergence of inflation rates across 7 Turkish regions without being subject to the pitfalls that surround the use of the difference between regional inflation rates measured relative to a particular region benchmark, the unit-root of all (N N−1) / 2 possible regional inflation rate “gaps”, i j,
t
d are examined. Under the null of non-convergence, one would expect the fraction of inflation rate gap pairs for which the unit-root hypothesis is rejected to be close to the size of the unit-root test applied to the individual inflation rate gap pairs. Although, the underlying individual unit-root tests are not cross-sectionally independent, under the null of non-convergence, the fraction of the rejections converges to α, as N and T→ ∞, where α is the size of the underlying unit-root test.
The Augmented Dickey Fuller (ADF) is used to test the stationarity of the regional inflation rates. In order to have robust results, two versions (with and without intercept) of this test are applied at 10, 5, and 1 percent significance levels for different orders of augmentations, including the order selected using Akaike Information Criterion (AIC). As is known, ADF tests accept the unit root as the null hypothesis. The numbers in the cells of the tables in the next sub-section (i.e., the analysis for the pre-inflation targeting period) refer to the portions of pairs for which the null of unit root hypothesis of ADF test is rejected. A value of 1.00 means that all regional pairs have converged to each other, while a value of 0.00 means that none of the pairs have converged; thus, any value between 0.00 and 1.00 suggests a portion (or percentage) of the pairs that have converged to each other.
It was found in Table 2 that the cross-sectional standard deviation of Turkish regional inflation rates has a break right before the financial crisis in February 2001 after which Turkey adopted a flexible exchange rate. Since the time between the financial crisis of February 2001 and the start of the explicit inflation targeting of January 2002 has been used for the necessary reforms to conduct the inflation-targeting regime, from now on, pre-crisis period will interchangeably be used with pre-inflation-targeting period and post-crisis period will interchangeably be used with inflation-targeting period.11 In this context, to compare the convergence properties of the Turkish regional inflation rates between pre-inflation-targeting and inflation targeting periods, a formal convergence analysis for two different monthly samples, 1997:03-2001:01 and 2001:02-2004:12, is employed. It is important to note that the sample size in each period is set to 47 to make them
comparable, because the power and the results of convergence tests may depend on the sample size.12
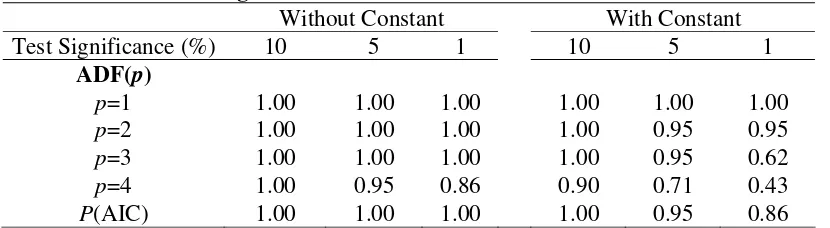
4.1. Results for the Pre-Inflation-Targeting Period
[image:12.595.94.500.362.498.2]Table 4 summarizes the results of unit root tests applied to all 21 region pairs for Food, Beverage, and Tobacco CPI inflation rates over the pre-inflation-targeting period 1997:03-2001:01 (i.e., T=47, N=7). As is evident, the lowest rejection ratio is 0.71, which means that for at least 71% of the region pairs, the null of unit root is rejected; thus at least 71% of the region pairs have converged to each other. Since the null hypothesis of the ADF convergence test is non-convergence, in order to consider the most conservative scenario, from now on, the minimum numbers in the tables will be used to decide for convergence. By this way, our inference will be robust to the selection of the version of the ADF test (i.e., with and without intercept), the significance level of the ADF test (i.e., 10%, 5%, and 1%), and the order of augmentations (i.e., p=1,2,3,4 and p(AIC)). Considering the tradable components Food, Beverage, and Tobacco CPI in Table 1, the high percentage of convergence in Table 4 is consistent with the notion of tradable goods, because trade across regions eliminates the arbitrage opportunities, so that the prices and the inflation rates converge to each other.
Table 4 – Pair-wise Convergence Tests for Food, Beverage and Tobacco CPI Inflation Rates
Without Constant With Constant
Test Significance (%) 10 5 1 10 5 1
ADF(p)
p=1 1.00 1.00 1.00 1.00 1.00 1.00
p=2 1.00 1.00 1.00 1.00 1.00 1.00
p=3 1.00 1.00 1.00 1.00 0.90 0.81
p=4 1.00 1.00 1.00 1.00 0.95 0.71
p(AIC) 1.00 1.00 1.00 1.00 1.00 1.00
Note: The table shows the portions of pairs for which the unit-root hypothesis of ADF(p) test is rejected (where p is the number of lags). See Pesaran (2007) for more details.
Similarly, Table 5 depicts the convergence test results for Clothing and Footwear CPI inflation rates. As is evident, for at least 86% of the region pairs, the null of unit root is rejected; thus at least 86% of the region pairs have converged to each other. This high percentage is again consistent with the notion of tradable goods. However, the components of Clothing and Footwear CPI in Table 1 also include some non-tradable sectors such as repair costs. In this context, it is surprising to have a higher convergence ratio for Clothing and Footwear inflation rates compared to Food, Beverage, and Tobacco inflation rates, which has no non-tradable components. A possible explanation may be related to low expenditure shares of the non-tradable components (e.g., repair costs) in the Clothing and Footwear CPI.
Table 5 – Pair-wise Convergence Tests for Clothing and Footwear CPI Inflation Rates
Without Constant With Constant
Test Significance (%) 10 5 1 10 5 1
ADF(p)
p=1 1.00 1.00 1.00 1.00 1.00 1.00
p=2 1.00 1.00 1.00 1.00 1.00 1.00
p=3 1.00 1.00 1.00 1.00 1.00 1.00
p=4 1.00 1.00 1.00 1.00 1.00 0.86
p(AIC) 1.00 1.00 0.95 0.95 0.95 0.86
Note: The table shows the portions of pairs for which the unit-root hypothesis of ADF(p) test is rejected (where p is the number of lags). See Pesaran (2007) for more details.
[image:13.595.96.504.452.568.2]Table 6 shows the convergence test results for Housing and Rent CPI inflation rates which completely consist of non-tradable components. The results show that the null of unit root is rejected for at least 14% of the region pairs; thus at least 14% of the region pairs have converged to each other. This portion is extremely low compared to the convergence portions in Tables 4-5, and it is consistent with the notion of non-tradable sectors where the trade across regions cannot eliminate the arbitrage opportunities, so that the prices and the inflation rates cannot converge to each other easily. Another explanation can be related to migration across regions, which may be seen as an arbitrage removing activity, especially for the housing sector, but this process takes much more time compared to the trade of the tradable goods across regions.
Table 6 – Pair-wise Convergence Tests for Housing and Rent CPI Inflation Rates
Without Constant With Constant
Test Significance (%) 10 5 1 10 5 1
ADF(p)
p=1 1.00 1.00 0.95 0.95 0.90 0.81
p=2 0.90 0.90 0.81 0.86 0.71 0.57
p=3 0.90 0.86 0.52 0.62 0.48 0.38
p=4 0.81 0.76 0.52 0.52 0.43 0.14
p(AIC) 0.86 0.76 0.67 0.67 0.57 0.52
Note: The table shows the portions of pairs for which the unit-root hypothesis of ADF(p) test is rejected (where p is the number of lags). See Pesaran (2007) for more details.
Table 7 – Pair-wise Convergence Tests for Other Housing CPI Inflation Rates
Without Constant With Constant
Test Significance (%) 10 5 1 10 5 1
ADF(p)
p=1 1.00 1.00 1.00 1.00 1.00 1.00
p=2 1.00 1.00 1.00 1.00 1.00 0.71
p=3 1.00 1.00 0.95 1.00 0.86 0.52
p=4 1.00 1.00 0.90 1.00 0.76 0.29
p(AIC) 1.00 0.90 0.86 0.95 0.86 0.86
Note: The table shows the portions of pairs for which the unit-root hypothesis of ADF(p) test is rejected (where p is the number of lags). See Pesaran (2007) for more details.
[image:14.595.93.501.372.487.2]Table 8 shows the convergence test results for Health CPI inflation rates. The lowest suggested convergence fraction is 67%, which is a high value for a CPI group mostly including non-tradable components such as hospital services or services of physicians. Nevertheless, since the health sector, especially hospital services, are mostly conducted by the state-owned institutions, this result is not unusual.
Table 8 – Pair-wise Convergence Tests for Health CPI Inflation Rates
Without Constant With Constant
Test Significance (%) 10 5 1 10 5 1
ADF(p)
p=1 1.00 1.00 1.00 1.00 1.00 1.00
p=2 1.00 1.00 1.00 1.00 1.00 1.00
p=3 1.00 1.00 1.00 1.00 1.00 0.86
p=4 1.00 1.00 0.90 0.90 0.90 0.86
p(AIC) 1.00 0.95 0.90 0.90 0.71 0.67
Note: The table shows the portions of pairs for which the unit-root hypothesis of ADF(p) test is rejected (where p is the number of lags). See Pesaran (2007) for more details.
Table 9 gives the convergence test results for Transportation CPI inflation rates which consist of tradable components except for maintenance and repair costs.
Table 9 – Pair-wise Convergence Tests for Transportation CPI Inflation Rates
Without Constant With Constant
Test Significance (%) 10 5 1 10 5 1
ADF(p)
p=1 1.00 1.00 1.00 1.00 1.00 1.00
p=2 1.00 1.00 1.00 1.00 1.00 1.00
p=3 1.00 1.00 1.00 1.00 1.00 0.95
p=4 1.00 1.00 1.00 1.00 0.90 0.71
p(AIC) 1.00 1.00 1.00 1.00 1.00 0.90
Table 10 shows the convergence test results for Leisure and Entertainment CPI inflation rates, which is another mix of tradable and non-tradable components. The lowest suggested convergence portion is 43%, which is much lower compared to other CPI groups with tradable components.
Table 10 – Pair-wise Convergence Tests for Leisure and Entertainment CPI Inflation Rates
Without Constant With Constant
Test Significance (%) 10 5 1 10 5 1
ADF(p)
p=1 1.00 1.00 1.00 1.00 1.00 1.00
p=2 1.00 1.00 1.00 1.00 0.95 0.95
p=3 1.00 1.00 1.00 1.00 0.95 0.62
p=4 1.00 0.95 0.86 0.90 0.71 0.43
P(AIC) 1.00 1.00 1.00 1.00 0.95 0.86
Note: The table shows the portions of pairs for which the unit-root hypothesis of ADF(p) test is rejected (where p is the number of lags). See Pesaran (2007) for more details.
The convergence portions of the regional inflation rates for Education CPI are given in Table 11. Although education is another type of service which can mostly be seen as a non-tradable, the fact that the educational services are mostly provided by state-owned institutions, of which pricing strategy is determined at the national level, makes the convergence portions higher (i.e., 67% as the lowest).
Table 11 – Pair-wise Convergence Tests for Education CPI Inflation Rates
Without Constant With Constant
Test Significance (%) 10 5 1 10 5 1
ADF(p)
P=1 1.00 1.00 1.00 1.00 1.00 1.00
P=2 1.00 1.00 1.00 1.00 1.00 1.00
P=3 1.00 1.00 1.00 1.00 1.00 0.95
P=4 1.00 1.00 0.95 1.00 0.90 0.67
p(AIC) 1.00 1.00 1.00 1.00 1.00 1.00
Note: The table shows the portions of pairs for which the unit-root hypothesis of ADF(p) test is rejected (where p is the number of lags). See Pesaran (2007) for more details.
Table 12 – Pair-wise Convergence Tests for Hotels, Cafes and Restaurants CPI Inflation Rates
Without Constant With Constant
Test Significance (%) 10 5 1 10 5 1
ADF(p)
p=1 1.00 1.00 1.00 1.00 1.00 1.00
p=2 1.00 1.00 1.00 1.00 1.00 0.90
p=3 1.00 1.00 1.00 1.00 1.00 0.76
p=4 1.00 1.00 0.81 0.81 0.52 0.05
p(AIC) 1.00 0.95 0.86 0.86 0.86 0.62
Note: The table shows the portions of pairs for which the unit-root hypothesis of ADF(p) test is rejected (where p is the number of lags). See Pesaran (2007) for more details.
Finally, the convergence test results for Miscellaneous Goods and Services CPI inflation rates are given in Table 13, where the lowest convergence ratio is 43%.
Table 13 – Pair-wise Convergence Tests for Miscellaneous Goods and Services CPI Inflation Rates
Without Constant With Constant
Test Significance (%) 10 5 1 10 5 1
ADF(p)
p=1 1.00 1.00 1.00 1.00 1.00 0.95
p=2 1.00 1.00 1.00 1.00 1.00 0.90
p=3 1.00 1.00 0.90 1.00 0.90 0.71
p=4 1.00 1.00 0.81 0.81 0.76 0.43
p(AIC) 1.00 1.00 0.90 0.95 0.86 0.76
Note: The table shows the portions of pairs for which the unit-root hypothesis of ADF(p) test is rejected (where p is the number of lags). See Pesaran (2007) for more details.
[image:16.595.96.502.391.529.2]Table 14 – Pair-wise Convergence Tests for General Regional CPI Inflation Rates
Without Constant With Constant
Test Significance (%) 10 5 1 10 5 1
ADF(p)
p=1 1.00 1.00 1.00 1.00 0.95 0.95
p=2 1.00 1.00 1.00 1.00 0.90 0.71
p=3 0.95 0.95 0.86 0.81 0.81 0.62
p=4 1.00 1.00 0.95 0.95 0.95 0.62
p(AIC) 1.00 1.00 0.95 0.95 0.95 0.90
Note: The table shows the portions of pairs for which the unit-root hypothesis of ADF(p) test is rejected (where p is the number of lags). See Pesaran (2007) for more details.
4.2. Results for the Inflation-Targeting Period
This sub-section tests whether there is a change in the convergence properties of the regional inflation rates in the inflation-targeting period. For this purpose, one can either depict the convergence test results for the inflation-targeting period (as it has been done for the pre-inflation targeting period, above) or depict the change in the region pair portions that have converged to each other. In order to make a clear comparison, the second approach is chosen.
Table 15 summarizes the change in the region pair portions that have converged to each other for Food, Beverage and Tobacco inflation rates between the pre-inflation-targeting period of 1997:03-2001:01 (i.e., T=47, N=7) and the inflation-targeting period of 2001:02-2004:12 (i.e., T=47, N=7). A value of 0.00 means that the number of region pairs that have converged in the pre-targeting period (that are given in Table 4) has not changed in the inflation-targeting period, while a value of -0.24 means that the number of region pairs that have converged in the pre-inflation-targeting (that are given in Table 4) period has decreased by 24% in the inflation-targeting period. As is evident, all the changes in converging portions in Table 15 are either equal to 0.00 or a negative value. This suggests that no matter which version of the ADF test (i.e., with and without intercept), which significance level of the ADF test (i.e., 10%, 5%, and 1%), and which order of augmentations (i.e., p=1,2,3,4 and p(AIC)) are used, the number of regions that have converged to each other in terms of Food, Beverage and Tobacco CPI inflation rates has decreased. In other words, some regions have diverged from each other in the inflation-targeting period in terms of this particular CPI group inflation.
Table 15 –Change in Pair-wise Convergence Portions for Food, Beverage and Tobacco CPI Inflation Rates
Without Constant With Constant
Test Significance (%) 10 5 1 10 5 1
ADF(p)
p=1 0.00 0.00 0.00 0.00 0.00 0.00
p=2 0.00 0.00 0.00 0.00 -0.05 -0.05
p=3 0.00 0.00 -0.05 -0.05 -0.10 -0.14
p=4 0.00 0.00 -0.10 -0.10 -0.10 -0.29
p(AIC) 0.00 -0.05 -0.19 -0.19 -0.19 -0.24
Similarly, Table 16 depicts the change during the inflation-targeting period in the portion of region pairs that have converged to each other in terms of the Clothing and Footwear CPI inflation rates in the pre-inflation-targeting period. Again, all the figures in Table 16 are either equal to 0.00 or have negative values, which suggest that the number of regions that have converged to each other in terms of Clothing and Footwear has decreased.
Table 16 – Change in Pair-wise Convergence Portions for Clothing and Footwear CPI Inflation Rates
Without Constant With Constant
Test Significance (%) 10 5 1 10 5 1
ADF(p)
p=1 0.00 0.00 0.00 0.00 0.00 0.00
p=2 0.00 0.00 0.00 0.00 0.00 0.00
p=3 0.00 0.00 0.00 0.00 0.00 0.00
p=4 0.00 0.00 0.00 0.00 0.00 -0.05
p(AIC) -0.05 -0.10 -0.29 -0.19 -0.33 -0.48
Note: The table shows the portions of pairs for which the unit-root hypothesis of ADF(p) test is rejected (where p is the number of lags). See Pesaran (2007) for more details.
[image:18.595.95.501.503.622.2]When Table 17 is considered, values range between -0.19 and 0.43, but they are mostly positive. This suggests that more regions have converged to each other in terms of Housing and Rent CPI inflation rates in the inflation-targeting period compared to the pre-inflation-targeting period. Having such a convergence is interesting, especially for such a CPI group which consists of non-tradable components.
Table 17 – Change in Pair-wise Convergence Portions for Housing and Rent CPIs
Without Constant With Constant
Test Significance (%) 10 5 1 10 5 1
ADF(p)
p=1 0.00 0.00 0.05 0.05 0.10 0.14
p=2 0.10 0.05 0.05 0.10 0.10 -0.19
p=3 0.10 0.10 0.29 0.33 0.38 -0.05
p=4 0.19 0.19 0.24 0.43 0.43 0.24
p(AIC) 0.05 0.14 0.14 0.29 0.29 0.19
Note: The table shows the portions of pairs for which the unit-root hypothesis of ADF(p) test is rejected (where p is the number of lags). See Pesaran (2007) for more details.
Table 18 – Change in Pair-wise Convergence Portions for Other Housing CPI Inflation Rates
Without Constant With Constant
Test Significance (%) 10 5 1 10 5 1
ADF(p)
p=1 0.00 0.00 0.00 0.00 0.00 0.00
p=2 0.00 0.00 0.00 0.00 0.00 0.05
p=3 0.00 0.00 -0.05 -0.14 -0.14 -0.24
p=4 0.00 0.00 -0.14 -0.19 -0.10 0.05
p(AIC) 0.00 0.10 -0.05 -0.10 0.00 -0.05
Note: The table shows the portions of pairs for which the unit-root hypothesis of ADF(p) test is rejected (where p is the number of lags). See Pesaran (2007) for more details.
[image:19.595.93.506.394.513.2]Tables 19-22 are other tables having mostly negative values. It suggests that more regions have diverged from each other in the inflation-targeting period in terms of the Health, Transportation, Leisure and Entertainment, and Education CPI inflation rates. Having such a divergence is interesting, especially for such CPI groups which consist of mostly tradable components.
Table 19 – Change in Pair-wise Convergence Portions for Health CPI Inflation Rates
Without Constant With Constant
Test Significance (%) 10 5 1 10 5 1
ADF(p)
p=1 0.00 0.00 0.00 0.00 0.00 0.00
p=2 0.00 0.00 0.00 0.00 0.00 -0.10
p=3 0.00 0.00 0.00 0.00 0.00 -0.10
p=4 0.00 0.00 0.00 0.00 0.00 -0.24
p(AIC) 0.00 0.00 -0.24 -0.14 -0.05 -0.05
Note: The table shows the portions of pairs for which the unit-root hypothesis of ADF(p) test is rejected (where p is the number of lags). See Pesaran (2007) for more details.
Table 20 – Change in Pair-wise Convergence Portions for Transportation CPI Inflation Rates
Without Constant With Constant
Test Significance (%) 10 5 1 10 5 1
ADF(p)
p=1 0.00 0.00 0.00 0.00 0.00 0.00
p=2 0.00 0.00 0.00 0.00 0.00 -0.19
p=3 0.00 0.00 -0.10 0.00 -0.10 -0.14
p=4 0.00 -0.10 -0.10 -0.10 -0.05 -0.38
p(AIC) -0.05 -0.10 -0.10 -0.05 -0.14 -0.10
Table 21 – Change in Pair-wise Convergence Portions for Leisure and Entertainment CPI Inflation Rates
Without Constant With Constant
Test Significance (%) 10 5 1 10 5 1
ADF(p)
p=1 0.00 0.00 0.00 0.00 0.00 0.00
p=2 0.00 0.00 0.00 0.00 0.05 0.00
p=3 0.00 0.00 -0.10 -0.14 -0.10 -0.05
p=4 0.00 0.05 -0.05 -0.10 0.00 -0.14
p(AIC) 0.00 0.00 0.00 0.00 0.05 0.00
[image:20.595.93.506.302.422.2]Note: The table shows the portions of pairs for which the unit-root hypothesis of ADF(p) test is rejected (where p is the number of lags). See Pesaran (2007) for more details.
Table 22 – Change in Pair-wise Convergence Portions for Education CPI Inflation Rates
Without Constant With Constant
Test Significance (%) 10 5 1 10 5 1
ADF(p)
p=1 0.00 0.00 0.00 0.00 0.00 0.00
p=2 0.00 0.00 0.00 0.00 0.00 -0.05
p=3 0.00 0.00 0.00 0.00 -0.05 -0.24
p=4 0.00 0.00 0.00 -0.05 -0.14 -0.24
p(AIC) 0.00 0.00 -0.05 0.00 0.00 0.00
Note: The table shows the portions of pairs for which the unit-root hypothesis of ADF(p) test is rejected (where p is the number of lags). See Pesaran (2007) for more details.
[image:20.595.92.502.566.703.2]Tables 23 and 24 show the change in pair-wise convergence portions for Hotels, Cafes, and Restaurants, and Miscellaneous Goods, and Services CPI inflation rates. As is evident, both tables consist of mostly positive values, suggesting that regions have converged to each other in terms of these two CPI group inflation rates. It is again important to note that these CPI groups mostly consist of non-tradable components.
Table 23 – Change in Pair-wise Convergence Portions for Hotels, Cafes and Restaurants CPI Inflation Rates
Without Constant With Constant
Test Significance (%) 10 5 1 10 5 1
ADF(p)
p=1 0.00 0.00 0.00 0.00 0.00 -0.05
p=2 0.00 0.00 -0.05 0.00 -0.10 -0.14
p=3 0.00 0.00 0.00 0.00 0.00 -0.14
p=4 0.00 0.00 0.14 0.19 0.29 0.57
p(AIC) 0.00 0.05 0.10 0.10 0.10 0.14
Table 24 – Change in Pair-wise Convergence Portions for Miscellaneous Goods and Services CPI Inflation Rates
Without Constant With Constant
Test Significance (%) 10 5 1 10 5 1
ADF(p)
p=1 0.00 0.00 0.00 0.00 0.00 0.00
p=2 0.00 0.00 0.00 0.00 0.00 -0.14
p=3 0.00 0.00 0.10 0.00 0.05 -0.14
p=4 0.00 0.00 0.19 0.19 0.19 0.29
p(AIC) 0.00 0.00 0.10 0.05 0.14 0.19
Note: The table shows the portions of pairs for which the unit-root hypothesis of ADF(p) test is rejected (where p is the number of lags). See Pesaran (2007) for more details.
Overall, Tables 15-24 interestingly depict that during the inflation targeting period, the regions have converged to (respectively, diverged from) each other in terms of the CPI groups with relatively non-tradable (respectively, tradable) components.
The combination of all CPI groups is again the general CPI in each region. The change in pair-wise convergence portions for General Regional CPI inflation rates is given in Table 25. As is evident, the values are mixed, ranging between -0.38 and 0.19. This reflects an overall average of all CPI groups.
Table 25 – Change in Pair-wise Convergence Portions for General Regional CPI Inflation Rates
Without Constant With Constant
Test Significance (%) 10 5 1 10 5 1
ADF(p)
p=1 0.00 0.00 0.00 0.00 0.05 0.05
p=2 0.00 0.00 0.00 0.00 0.10 0.00
p=3 0.05 0.05 0.10 0.19 0.14 -0.24
p=4 0.00 0.00 -0.19 -0.05 -0.29 -0.38
p(AIC) 0.00 -0.10 -0.05 0.00 -0.10 -0.24
Note: The table shows the portions of pairs for which the unit-root hypothesis of ADF(p) test is rejected (where p is the number of lags). See Pesaran (2007) for more details.
V. CONCLUSIONS
[image:21.595.94.503.433.568.2]The obtained break dates are used to compare the convergence properties of regional inflation rates at the disaggregate level of CPI groups between the pre-inflation-targeting period and the inflation-targeting period in Turkey. It is found that the CPI groups with relatively tradable components have diverged from each other, while the CPI groups with relatively non-tradable components have converged to each other, during the inflation-targeting period. According to the Balassa-Samuelson effect, this means that the inflation-targeting period coincides with a productivity growth of non-tradable goods and a productivity fall in tradable goods. Since the inflation-targeting period also corresponds to a flexible exchange rate regime in Turkey, these results may also suggest that the traded good shares differ across Turkish regions, so that a high volatility in the exchange rates (due to the flexible exchange rate regime) is reflected in the regional inflation rate differences.
The results of this paper has important policy implications, which may be related to either the inflation-targeting process or the flexible exchange rate regime: (i) if CPI groups in different regions are affected differently by monetary policy conducted under inflation-targeting regime (i.e., different regions or sectors are affected differently by the policy instruments such as money aggregates, exchange rate, and interbank rates), then inflation-targeting regime may be the reason for this result; (ii) alternatively, if CPI groups in different regions have different imported good shares, the volatile exchange rate (due to the flexible exchange rate regime) may be a potential reason for the results of this paper. In particular, the Central Bank of Turkey implemented its monetary policy with both interest rates and foreign exchanges until the end of 1999, with foreign exchanges in year 2000, and with short-term interest rates since 2001. These different monetary policy tools may affect prices of different products differently; e.g., exchange rates affect prices of tradable goods more than non-tradable goods. If each geographic region has a different weight on these two set of prices, it is plausible that the flexible exchange rate regime also has its influence on the convergence of regional inflation rates. Understanding these linkages across regions and sectors is the key to a thorough monetary policy, at both national and regional levels.
References:
♦ Akay, K. and Yilmazkuday, H., (2008), “An Analysis of Regime Shifts in the Turkish Economy”,
Economic Modelling, 25(5): 885-898.
♦ Bai, J. and Perron, P., (1998), “Estimating and Testing Linear Models with Multiple Structural Changes”, Econometrica, 66(1): 47-78.
♦ Bai, J. and Perron, P., (2003), “Computation and Analysis of Multiple Structural Change Models”,
Journal of Applied Econometrics, 18: 1-22.
♦ Ball, L. and Sheridan, N., (2003), “Does Inflation Targeting Matter?”, NBER Working Paper No 9577.
♦ Beck, G.W., Hubrich, K., and Marcelliono, M., (2006), “Regional Inflation Dynamics within and across Euro Area Countries and a Comparison with the US”, European Central Bank Working Paper No 681.
♦ Beck, G.W. and Weber, A.A., (2001), “How Wide are European Borders? New Evidence on the Integration Effects of Monetary Unions”, CFS Working Paper No: 2001/07.
♦ Berument, H., (2003), “Public Sector Pricing Behavior and Inflation Risk Premium in Turkey”,
Eastern European Economics, 41(1): 68-78.
♦ Berument, H., (2007), “Measuring monetary policy for a small open economy: Turkey”, Journal of
Macroeconomics, 29(2): 411-430.
♦ Berument, H., and Tasci, H., (2004), “Monetary policy rules in practice: evidence from Turkey”,
International Journal of Finance and Economics, 9(1): 33-38.
♦ Busetti, F., Forni, L., Harvey, A. and Venditti, F., (2007), “Inflation Convergence and Divergence with the European Monetary Union”, International Journal of Central Banking, 3(2): 95-121.
♦ Busetti, F., Fabiani, S. and Harvey, A., (2006), “Convergence of Prices and Rates of Inflation,”
Oxford Bulletin of Economics and Statistics,.68(s1): 863-877.
♦ Durlauf SN, Johnson PA, and Temple J. R. (2005), “Growth econometrics”, in: Aghion P, Durlauf
SN(eds) Handbook of economic growth, vol 1A. Elsevier Science, Amsterdam, pp 555–677.
♦ Durlauf SN and Quah DT (1999), “The new empirics of economic growth”, in: Taylor JB, Woodford
M (eds) Handbook of macroeconomics, vol 1A. Elsevier Science, Amsterdam, pp 235–308.
♦ Ertugrul, A., Selcuk, F., (2002), “Turkish economy: 1980–2001”. In: Kibritcioglu, A., Rittenberg, L., Selcuk, F. (Eds.), Inflation and Disinflation in Turkey: 13–40.
♦ Goncalves, C.E. and Carvalho, A., (2007), “Inflation Targeting Matters: Evidence from OECD Economies’ Sacrifice Ratios”, Available at SSRN: http://ssrn.com/abstract=897308, accessed at June 30, 2007.
♦ Goncalves, C.E. and Salles, J.M. (forthcoming), “Inflation Targeting in Emerging Economies: What do the Data Say?”, Journal of Development Economics.
♦ Hobijn, B.,Franses, P.H. and Ooms, M., (1998), “Generalizations of the KPSS-test for Stationarity”,
Econometric Institute Report, 9802/A, Erasmus University, Rotterdam.
♦ Hobijn, B. and Franses, P.H. (2000), “Asymptotically Perfect and Relative Convergence of Productivity”, Journal of Applied Econometrics, 15: 59-81.
♦ Holmes, M.J., (2002), “Panel Data Evidence on Inflation Convergence in the European Union”,
Applied Economics Letters, 9(3): 155-158.
♦ Honohan, P. and Lane, P.R., (2003), “Divergent Inflation Rates in EMU”, Economic Policy, 18(37): 357-394.
♦ Kocenda, E. and Papell, D., (1997), “Inflation Convergence within the European Union: A Panel Data Analysis”, International Journal of Finance and Economics, 2(3): 189-198.
♦ Mentz, M. and Sebastian, S.P., (2003), “Inflation Convergence after the Introduction of the Euro”,
CFS Working Paper No: 2003/30.
♦ Mishkin, F.S., (2002), “Commentary on 'Does inflation targeting matter?”, Federal Reserve Bank of
St. Louis Economic Review, 84(4): 149–154.
♦ Muller, U.K., (2005), “Size and Power of Tests of Stationarity in Highly Autocorrelated Time Series”,
Journal of Econometrics, 128 (2): 195–213.
♦ Neumann, M.J.M. and von Hagen, J., (2002), “Does Inflation Targeting Matter?”, Federal Reserve
Bank of St. Louis Economic Review, 84(4): 127–148.
♦ Ng, S. and Perron, P., (2001), “Lag Length Selection and the Construction of Unit Root Tests with Good Size and Power”, Econometrica, 69(6): 1519-1554.
♦ Pesaran, M.H. (2007), “A pair-wise approach for testing output and growth convergence”, Journal of
Econometrics, 138:312-355.
♦ Rey S.J. and Janikas M.V. (2005), “Regional convergence, inequality, and space”, Journal of Economic
Growth, 5(2):155–176
♦ Siklos, J.H. and Wohar, M.E., (1997), “Convergence in Interest Rates and Inflation Rates across Countries over Time”, Review of International Economics, 5(1): 129-141.
♦ Yazgan, M.E. and Yilmazkuday, H., (2005), “Inflation Dynamics of Turkey: A Structural Estimation”,
Studies in Nonlinear Dynamics and Econometrics, 9(1).
♦ Yazgan, M.E. and Yilmazkuday, H., (2007), “Monetary Policy Rules in Practice: Evidence from Turkey and Israel”, Applied Financial Economics, 17(1): 1-8.
♦ Yilmazkuday, H., (2007), “Inflation Targeting Supported by Managed Exchange Rate”, Applied