http://dx.doi.org/10.4236/ijmpcero.2016.51009
Automatic Anomaly Detection of
Respiratory Motion Based on
Singular Spectrum Analysis
Jun’ichi Kotoku
1,2, Shinobu Kumagai
1, Ryouhei Uemura
1,2, Susumu Nakabayashi
1,
Takenori Kobayashi
11Graduate School of Medical Technology, Teikyo University, Tokyo, Japan 2Central of Radiology, Teikyo University Hospital, Tokyo, Japan
Received 2 February 2016; accepted 26 February 2016; published 29 February 2016
Copyright © 2016 by authors and Scientific Research Publishing Inc.
This work is licensed under the Creative Commons Attribution International License (CC BY).
http://creativecommons.org/licenses/by/4.0/
Abstract
The realization of automatic anomaly detection of respiratory motion could be very useful to pre-vent accidental damage during radiation therapy. In this paper, we proposed an automatic ano-maly detection method using singular value decomposition analysis. Before applying this method, the investigator needs a normal respiratory motion data of a patient. From these data, a trajectory matrix representing normal time-series feature is created. Decomposing the matrix, we obtained the feature of normal time series. Then, we applied the same procedure to real-time data and ob-tained real-time features. Calculating the similarity of those feature matrixes, an anomaly score was obtained. Patient motion was observed by a depth camera. In our simulation, two types of mo-tion e.g. cough and sudden stop of breathing were successfully detected, while gradual change of respiratory cycle frequency was not detected clearly.
Keywords
Anomaly Detection, Respiratory Motion, Singular Spectrum Analysis
1. Introduction
Monitoring of a patient has been an important but tedious work for medical staffs. The automatic anomaly de-tection for respiratory motion is very critical to conduct radiation therapy safely.
sometimes changes [1]. Because of these characteristics, simple threshold method tends to fail for detection of anomaly motion.
There has been some useful anomaly detection algorithm for industrial use. Those algorithms are classified into two categories: model based algorithm and model free algorithm. Typical examples of model based ap-proach are auto regressive (AR) model [2] and Kalman filter algorithm [3]-[5]. An example of model-free ap-proach is singular spectrum analysis. The merit of model-free apap-proach is an ability to deal with unexpected mo-tion error and easy implementamo-tion. An example of this type of approach is singular spectrum analysis. It is a non-parametric method to extract characteristics of time-series data. There have been a few examples for an ap-plication of change point detection [6][7], however, few researchers have reported on anomaly detection of res-piratory motion.
In this paper, we tried to apply an anomaly detection algorithm based on singular spectrum analysis to a res-piratory curve of a patient.
2. Materials and Methods
2.1. Measurement
In this study, we applied the singular decomposition technique to measured respiratory motion obtained by a depth camera (Microsoft Kinect v1). First, we will describe how we measured respiratory curve. In the next sec-tion, we will explain the detail of algorithm to detect anomaly motion.
To monitor the respiratory motion, contact-less sensor was desirable. As a low-price sensor, our group has been using a Kinect sensor. Kinect sensor obtained depth data to a target from a shift of projected infrared pat-terns and the accuracy was 3 - 4 mm. To reduce the noise, we applied Ueda’s algorithm to the raw data of Ki-nect sensor. The sampling rate was 5 fps. The detail of this system was described in Kumagai et al. [8].
For testing performance, one of the authors simulated two types of anomaly motion, e.g. cough, sudden stop of breathing.
2.2. Anomaly Detection Method
To detect an anomaly motion, we first extracted the feature of the time-series data with window length w based on singular value spectrum analysis [9][10].
Let normal (or reference) time-series data be xi =
(
x( )i ,x( )i+1,,x(i w+ −1))
. We can define a trajectory matrix as(
)
( ) ( ) ( ) ( ) ( ) ( ) 1 2 1 1 1 1 , ,k w w
k w w
k w w
k x x x x X x x τ τ τ τ τ τ τ τ − − + − − − + − + − − + − − − = = x x
(1)
The matrix holds the feature of normal time series data at a reference time
τ
with look-back time of w. k was set to w2 [9][10].Similarly, we can define a matrix representing current states (at time t) of respiratory motion as,
(
)
( ) ( ) ( ) ( ) ( ) ( ) 1 2 1 2 1 1 , , .t k w t w
t k w t w
t k w t w
t k t
x x x x X x x − − + − − − + − + − − + − − − = =
x x
(2)
For example, window length w was set to 40 (= 8 sec). k was set to w 2=20. Next, we decomposed the matrix X1 and X2 using singular value decomposition
(
)
1 11 1, 2, , k
k k X UWV λ λ = = v
u u u
here U=
(
u u1, 2,,uk)
is an orthogonal matrix and V =(
v v1, 2,,vk)
is an orthogonal matrix and W is a diagonal matrix with singular values of λ λ1, 2,,λk and there is a constraint of λ1≥λ2≥≥λk ≥0.
From this decomposition of matrix, the matrix X1 can be approximated as
(
)
1 1 1 1 2 2 2 m m m
X =
λ
u v+λ
u v+ +λ
u v m≤k (4)This is an example of well-known spectrum decomposition of a matrix. For X2, in the similar manner, we obtain the following formula
(
)
1
2 1 1 2 2 2 m m m
[image:3.595.193.438.485.704.2]X =
λ
′ ′ ′u v+λ
′ ′ ′u v+ +λ
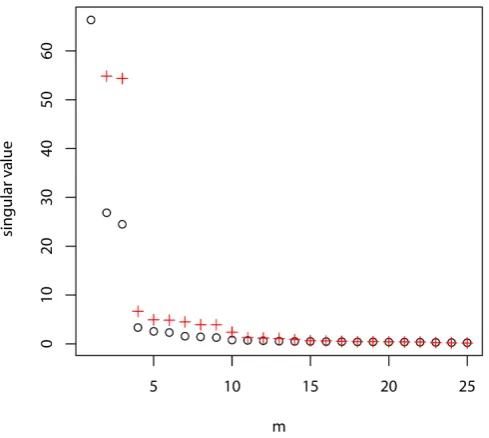
′ ′ ′u v m≤kFigure 1 shows the singular values of X1 and X2. From this figure, we set m to 5 to approximate the time series data. Therefore, the matrices were approximated as
5 1
1
i i i i
X λ
=
=
∑
u v (5)5
1 2 i i i
i
X λ
= ′ ′ ′
=
∑
u v (6)Then we defined a matrix representing the feature of time series of the reference signals as
(
1, , 5)
. mU = u u (7)
Similarly, a matrix representing features of current status was defined as
( )
(
)
1, , 5 .
t m
Q = u′ u′ (8)
To measure the similarity of two time series, we calculated canonical angle of two matrices as
( ) 2 2
t m m
U Q (9)
where ⋅ 2 is a two norm of a matrix calculated by a root of the maximum singular value of the matrix. Note
that the cosine of canonical angle is within 0 and 1, as an anomaly score, we can define
( )
( ) 22
1 m mt
a t = − U Q (10)
This score represents the anomaly of the current time window compared with the reference time window.
2.3. Performance Test
The anomaly detection can be divided into six steps.
1. Measurement of normal (not including anomaly events) respiratory motion. 2. Calculation of Um.
3. Measurement of respiratory motion. 4. Calculation of Qm( )t.
5. Calculation of anomaly score from Um and Qm( )t.
6. If the anomaly score exceeds the threshold, then the algorithm judged anomaly event occurred.
In the Step1, we measured a respiratory curve of a patient under normal situation (not suffered from anomaly events).
To test our algorithm, we measured the reference respiratory motion and normal respiratory motion by a vo-lunteer. Then the time-series data were retrospectively analyzed using our algorithm. All algorithms were im-plemented using R language [11].
Based on the algorithm, we performed real-time prediction of respiratory motion using our respiratory moni-toringsystem [8]. The algorithm was implemented by python language.
3. Results
In our study, we applied an anomaly detection algorithm based on singular spectrum analysis. Measurement data was obtained by a depth camera.
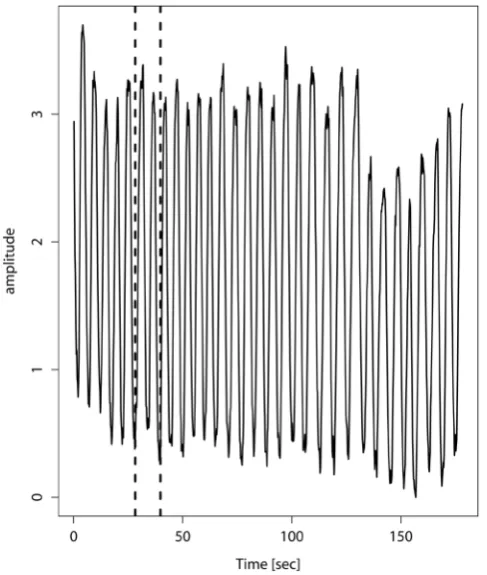
As a reference of normal respiratory curve, a normal respiratory motion was recorded with a depth camera. The obtained data was shown in Figure 2. The interval of dashed lines represents an interval to be used for sin-gular spectrum analysis. Obviously, the length of interval strongly affects calculation results of anomaly score. The choice of window length w will be discussed in the discussion section later.
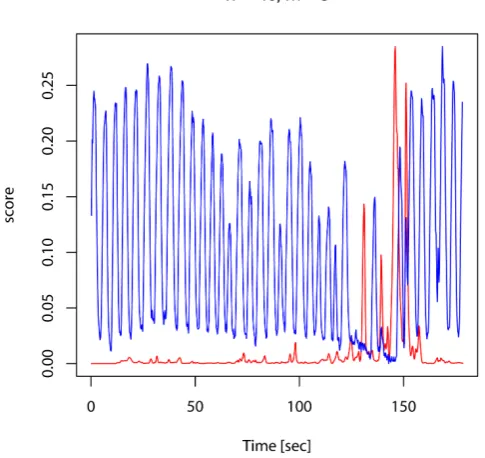
To simulate anomaly motions, the four types of anomaly motion were tested. Figure 3 shows an anomaly score when cough events occurred. Figure 4 shows an anomaly score when breathing was suddenly stopped. As
Figure 2. A reference respiratory curve obtained by a depth camera. An
[image:4.595.192.436.407.695.2]Figure 3.An example of cough events simulated by a volunteer. Two peaks at around 60 s and 120 s represent the cough events. The blue curve repre- sents the respiratory curve, while the red curve represents the anomaly score calculated by Equation (10).
Figure 4. An example of breathing stop simulated by a volunteer. The red curve represents the respiratory curve, while the blue curve represents the anomaly score calculated by Equation (10).
can be seen, the two types of events (cough and sudden stop of breathing) was successfully detected as a sudden increase of anomaly score. On the other hand, gradual increase of respiratory period was not clearly detected by this method.
[image:5.595.192.435.393.622.2]Simulated breathing stop was successfully detected by this algorithm.
4. Discussion
[image:6.595.89.538.163.343.2]Prior works have suggested that a general algorithm to detect anomaly motion would be difficult. This paper tried to overcome the difficulty using singular spectrum analysis.
Figure 5. A snapshot of real-time anomaly detection. Depth data (blue curve) and Anomaly score (red curve) are shown.
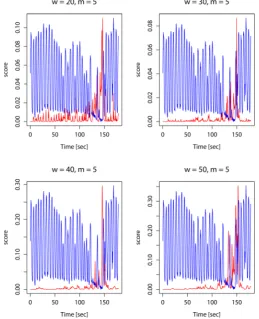
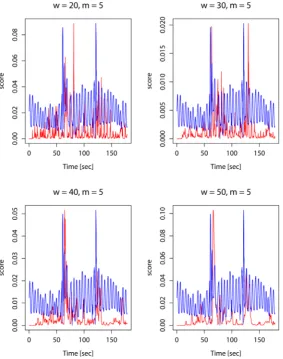
[image:6.595.184.444.375.695.2]The window length w is a main parameter of the analysis. The result depends on the parameter. However, there has been no universal selection rule. Therefore, we analyzed a respiratory curve with different length and compared them by visual inspection.
Figure 6 shows anomaly scores with different time window w for a sudden stop of breathing event. As shown in Figure 6, smaller window length tends to increase time resolution of anomaly detection, while the score itself tends to be noisy. Therefore, window length of 8 sec (w = 40) seemed to be appropriate for this situation. We did the same way to the cough events and obtained the Figure 7. We found the same tendency in the figure and de-termined the window length to be 8 sec. The optimum window length, however, depends on a patient.
There has a limitation, however, in this algorithm. One of the demerit in our method is the difficulty of the simple and explicit interpretation of the anomaly model. There has no clear-cut threshold to alarm an error. Us-ers should be aware of these difficulties.
The merit of this approach is the fact that no a priori modeling of anomaly motion is required. Because ano-maly motion is defined as a deviation from the normal motion, an explicit pre-implementation of anoano-maly mode is considered to be difficult. Using this algorithm, an unexpected anomaly motion could be detected. Hence, this algorithm will be a good supporting tool for medical staffs.
5. Conclusion
[image:7.595.174.458.342.702.2]We have demonstrated that automatic anomaly detection of respiratory motion using singular spectrum analysis was successful in the cough and sudden stop of breathing. The clinical use of this algorithm will be very hope-ful.
Acknowledgements
This work was supported by JSPS KAKENHI Grant Number 15K08703 and partly supported by JSPS Core-to- Core Program (No. 23003).
References
[1] Ruan, D., Fessler, J.A., Balter, J.M. and Keall, P.J. (2009) Real-Time Profiling of Respiratory Motion: Baseline Drift, Frequency Variation and Fundamental Pattern Change. Physics in Medicine and Biology, 54, 4777-4792.
http://dx.doi.org/10.1088/0031-9155/54/15/009
[2] McCall, K.C. and Jeraj, R. (2007) Dual-Component Model of Respiratory Motion Based on the Periodic Autoregres-sive Moving Average (Periodic Arma) Method. Physics in Medicine and Biology, 52, 3455.
http://dx.doi.org/10.1088/0031-9155/52/12/009
[3] Hong, S.M. and Bukhari, W. (2014) Real-Time Prediction of Respiratory Motion Using a Cascade Structure of an Ex-tended Kalmanfilter and Support Vector Regression. Physics in Medicine and Biology, 59, 3555-3573.
http://dx.doi.org/10.1088/0031-9155/59/13/3555
[4] Bukhari, W. and Hong, S.M. (2015) Real-Time Prediction and Gating of Respiratory Motion Using an Extended Kal-man Filter and Gaussian Process Regression. Physics in Medicine and Biology, 60, 233-252.
http://dx.doi.org/10.1088/0031-9155/60/1/233
[5] Ramrath, L., Schlaefer, A., Ernst, F., Dieterich, S. and Schweikard, A. (2007) Prediction of Respiratory Motion with a Multifrequency Based Extended Kalmanfilter. Proceedings of the 21st International Conference and Exhibition on Computer Assisted Radiology and Surgery (CARS’07), 21.
[6] Mohammad, Y. and Nishida, T. (2011) On Comparing Ssa-Based Changepoint Discovery Algorithms. 2011 IEEE/ SICE International Symposium on System Integration (SII),938-945.
[7] Moskvina, V. and Zhigljavsky, A. (2003) An Algorithm Based on Singular Spectrum Analysis for Change-Point De-tection. Communications in Statistics-Simulation and Computation, 32, 319-352.
http://dx.doi.org/10.1081/SAC-120017494
[8] Shinobu, K., Ryohei, U., Toru, I., Susumu, N., Norikazu, A., Takenori, K. and Kotoku, J. (2016) Makerless Respirato-ry Motion Tracking Using Single Depth Camera. Open Journal of Medical Imaging.
[9] Elsner, J.B. and Tsonis, A.A. (2013) Singular Spectrum Analysis: A New Tool in Time Series Analysis. Springer Science & Business Media.
[10] Golyandina, N. and Zhigljavsky, A. (2013) Singular Spectrum Analysis for Time Series. Springer Science & Business Media.