http://dx.doi.org/10.4236/ojemd.2014.42004
Apelin and Testosterone Levels in Men with Metabolic
Syndrome
Petya Angelova1, Zdravko Kamenov1, Adelina Tsakova2* 1
Clinic of Endocrinology, Alexandrovska University Hospital, Medical University, Sofia, Bulgaria 2
Clinic of Central Clinical Laboratory, Alexandrovska University Hospital, Medical University, Sofia, Bulgaria Email: [email protected], [email protected], [email protected]
Received December 27,2013; revised January 27, 2014; accepted February 4, 2014
Copyright © 2014 Petya Angelova et al. This is an open access article distributed under the Creative Commons Attribution License, which permits unrestricted use, distribution, and reproduction in any medium, provided the original work is properly cited. In accor-dance of the Creative Commons Attribution License all Copyrights © 2014 are reserved for SCIRP and the owner of the intellectual property Petya Angelova et al. All Copyright © 2014 are guarded by law and by SCIRP as a guardian.
ABSTRACT
Apelin is a new adipokine associated with obesity. Data about the relationship of apelin to the metabolic syn-drome (MS) are still scarce. Late-onset hypogonadism (LOH) is common in men with MS, but we did not find data about the levels of apelin in men with LOH. The aim of this study is to determine the levels of apelin in men with MS with or without LOH. Patients and Methods: 99 men are included in the study. Of them 65 have MS (IDF 2005) and they are divided according to their morning total testosterone (TT) level (cutoff 10.4 nmol/l) into two groups: MS-low T (N = 21) and MS-normal T (N = 44). The control group consists of 34 men without MS and with normal T. Apelin is determined in serum using enzyme linked immunosorbent assay. Some of the men were additionally assigned to testosterone treatment and monitored. Results: MS men are at mean age (±SD) = 50.4 ± 9.6 years and TT = 13.6 ± 5.4 nmol/l. The control group is at age = 51.5 ± 6.4 years (NS) and TT = 17.9 ± 5.6 nmol/l (p < 0.001). The levels of apelin are higher in the MS group—1.61 ± 0.53 ng/ml compared to the control one—1.38 ± 0.57 ng/ml (p < 0.05). There is no difference between MS-lowT—1.53 ± 0.52 ng/ml and MS-normal T
—1.65 ± 0.53 ng/ml sub-groups. The MS-normal T differs from the control group (p < 0.05). Significant correla-tion of testosterone with apelin levels is not found. Although apelin correlates with other laboratory parameters: LDL-levels in the MS-patients (Pearson’s = 0.311, p < 0.05); HbA1c in men with T2DM (Pearson’s = 0.285, p < 0.05); serum creatinine levels (Pearson’s = 0.257, p < 0.001). The patients that are assigned to testosterone subs-titution show a trend for lowering apelin levels. Conclusions: In this study, higher apelin levels are found in the presence of MS compared to healthy men, but do not differ between men having MS with low or normal T.
KEYWORDS
LOH; Metabolic Syndrome; Diabetes Mellitus; Apelin; Testosterone
1. Introduction
Apelin is a novel adipokine secreted by mature adipo- cytes [1]. It is a 36-amino acid peptide that was isolated for the first time in 1998 by Tatemoto et al. [2]. Its re-
ceptor—APJ, was found back in 1993 from O’Dowd et
al. [3]. The first studies demonstrated their expression in
many tissues, especially in the heart, brain, kidneys and lungs [4,5]. Recently the apelinergic system was found to interact in the pathogenesis of multiple conditions like obesity, disturbances in carbohydrate metabolism and type 2 diabetes mellitus, hypertension, heart failure [6-8].
Apelin is synthesized as pre-proapelin that is isolated in many tissues. Multiple isoforms are identified as ape- lin-36, apelin-17, apelin-13 that are considered to exist in vivo [2]. Apelin-36 is assumed to be the physiologically active one. The biological activity of apelin is focused in the myocardium, endocardium endothelium in the large vessels as well as in the small arteries and veins [6]. Sources stand for the idea that apelin plays an important role in the endothelial cell proliferation (like malignant neoplasms or diabetic retinopathy) [9]. Apelin has a hy- potensive effect when applied intravenously in rats as it lowers systolic and diastolic blood pressure by 10 mmHg [10]. Applying NO-synthetase inhibitor blocks this effect
which assumes a NO-mediated mechanism-endothelium- mediated vasodilatation [11]. Although apelin could lead to vasoconstriction in case of endothelium damage, the smooth muscle cells are the affected cells and they also have APJ-receptors [12].
Considering the expression of apelin and the APJ-re- ceptor in different areas of the central nervous system, especially in some hypothalamic nuclei, it is proposed that apelinergic system could be involved in the hypo- thalamic-pituitary axis and the water balance. It was demonstrated that 30 minutes after injecting apelin, the levels of ACTH and serum cortisol raise, and prolactine, LH and FSH drop [13]. A correlation was established with insulin and obesity as plasma apelin levels are much higher in obese mice with hyperinsulinaemia and are much lower in insulin-dependent rats with low fasting insulin levels. The correlation with insulin gets much more interesting after expression of APJ-receptor was established in the pancreas and inhibition of the glucose- dependent insulin secretion by apelin was demonstrated through direct action on mice beta-cells [14]. Signifi- cantly higher plasma apelin levels were found in obese than in normal-weight men [1]. A positive correlation of serum apelin levels and body mass index was found [15]. Also higher apelin levels were measured in diabetes mel- litus and impaired carbohydrate tolerance [16]. When applied intraperitoneally to normal and obese mice for a period of 14 days, apelin was found to reduce fat tissue without changing diet; to reduce insulin levels, leptin and triglycerides and to raise level of adiponectine [17]. De- tails about the physiologic role of apelin and its interac- tion with the elements of metabolic syndrome (MS) are to be figured.
The role of late-onset hypogonadism (LOH) wasn’t revealed so far and it is also considered as a part of MS. Most of the components of the metabolic syndrome (ob- esity, hypertension, dislipidaemia, glucose metabolism abnormalities and insulin resistance) are also found in men with hypogonadism. Epidemiologic studies have established connection between obesity and low serum testosterone levels in healthy men [18]. 20% to 64% of men with obesity have low total (TT) or free (FT) testos-
terone levels [19]. Kupelian et al. have established that
low TT and low levels of sex-hormone binding globulin are risk factors for metabolic syndrome even in symp- tomless androgenic deficit [20]. This confirms the data of
Muller et al., that endogenous levels of sex hormones are
low in MS [21]. Other authors find inverse correlation of number of components of MS and levels of TT [22]. It is assumed that the more parameters are abnormal, and lower levels of testosterone would be measured [23]. Large longitudinal studies confirm that frequency of MS is higher in elderly men and hypogonadism is a relevant factor [20,24]. The relation of hypogonadism and MS is
stable when different definitions of MS are applied in prospective monitoring of patients for more than 10 years [25]. We did not find data about the levels of apelin in men with LOH.
The aim of this study is to determine the levels of ape-lin in men with MS with low or normal testosterone le-vels and to monitor apelin lele-vels in testosterone replace-ment therapy.
2. Patients and Methods
2.1. Metabolic Syndrome
In this study are included consecutive patients of the Clinic Endocrinology of Alexandrovska University Hos- pital in Sofia for the period 03.2010-02.2011. All men signed informed consent before entering the study which was approved by the local ethics committee. At first they are clinically analyzed. Data about medical history, physical examination, height, weight, waist and hip cir- cumference, blood pressure are gathered. Standard me- tabolic markers, as well as the hormonal status of the gonadal axis are measured in the central laboratory of the hospital, which is the reference center for the country. We calculate:
• body mass index (BMI) = weight/height2 (kg/m2);
• homeostatic index of insulin resistance HOMA =
fasting blood glucose*fasting insulin/22.4;
• creatinine clearance by the formula of Cockroft-Gault
Ccr = (140 − age)*weight/0.814*serum creatinine;
• FT and bioavailable (BT) testosterone by the Ver-
meulen formula (internet calculator).
Defining the body composition—fat and fat-free body mass, body water we use bioimpedance analyzer Tanita TBF-215 (Tanita, Japan).
According the criteria of International Diabetes Feder-ation 2005 [26] abdominal obesity plus two of the other criteria are needed for the diagnosis of the metabolic syndrome. We analyzed:
• abdominal obesity (waist circumference ≥ 94 cm or
BMI > 30 kg/m2);
• carbohydrate metabolism − fasting plasma glucose ≥
5.6 mmol/l or previously diagnosed type 2 diabetes (T2DM);
• blood pressure (BP) − systolic (SBP) ≥ 130 or diastol-
ic (DBP) ≥ 85 mmHg, or already on medication for arterial hypertension;
• level of high density lipoproteins (HDL) < 1.03
mmol/l;
• level of triglycerides (TG) ≥ 1.7 mmol/l.
2.2. Late-Onset Hypogonadism—LOH
By definition low serum testosterone and clinical signs of testosterone deficiency are needed to set this diagnosis.
days in the morning on fasting state. Of this two results mean arithmetic is calculated and used as TT-level for the purposes of the study. We accept the level 10.4 nmol/l as a cut-off level for the testosterone deficiency as used by other authors [27].
For analysis of clinical signs the men filled out inter- nationally approved questionnaires—ADAM (Androgen Deficiency in Aging Males) [28] and AMS (Aging Male’s Symptoms) [29]. The probability (risk) for LOH is thus defined. Other reasons for hypogonadism were excluded—hyperprolactinaemia, pituitary, operative in- terventions and others.
The men that are to be treated with testosterone are additionally examined and contraindications for testoste- rone treatment are excluded. For the treatment is used either testosterone undecanoat (Nebido, Bayer-Schering) —1000 mg/4ml for intramuscular application every 12 weeks after the first interval being 6 weeks, or testoste- rone gel (Androgel, Laboratoires Besins International, Abbot)—50 mg in daily sachets. After starting this ther- apy the men are monitored for a period of three months, and blood samples are collected for further analysis.
2.3. Controls
А control group of men is formed by age-matched healthy volunteers without diabetes mellitus and/or obes- ity, or other known diseases that may interfere with the studied parameters. They are analyzed by the same pro- tocol. They were told to come in the clinic in fasting state in the morning for blood drawing for laboratory analysis and routine physical examination and anthropometric measurements. After getting the results some of the men are excluded because of previously unrecognized distur- bance of the carbohydrate metabolism (2), or fulfilling the criteria for MS, or low serum TT levels.
2.4. Blood Samples’ Analysis
Blood samples are taken using the forearm’s veins. Rou- tine laboratory analyses are done in the same day. For measuring the apelin levels, after centrifugation (4000 r/min) serum samples are freezed. Further apelin levels are determined by enzyme-linked immunosorbent me- thod (Phoenix pharmaceuticals, USA). TT-levels are measured by electrochemiluminiscent method (Elecsys 2010, Roche Diagnostics). The same method is used for measuring the levels of sex-hormone binding globulin (SHBG). Estradiol (E2) and luteinizing hormone (LH) are measured by chemiluminiscent method (ADVIA Centaur CP System—Siemens Healthcare).
2.5. Statistical Analysis
Statistical analysis of the data is done using appropriate methods for every analysis in the computer program
SPSS v.17.0 (SPSS Inc., Chicago, IL, USA). Defining the type of variable distribution, we used Kolmogorov- Smirnoff test. Comparing the groups, we applied the Mann-Whitney test. Correlations between variables are searched using the correlation test of Pearson. Results are accepted as statistically significant if p < 0.05.
3. Results
99 men are included in the study. The patients with MS (MS-group) are 65 and the control (C) group—34. The two groups are similar by age (MS = 50 ± 10 years vs. C = 51 ± 6 years) and height (174.8 ± 6.9 cm vs. 175.5 ± 7.0 cm), but differ significantly by their weight (102.1 ± 26 kg vs. 79.1 ± 8.7 kg; p < 0.001), BMI (33.3 ± 7.7 kg/m2 vs. 25.7 ± 2.4 kg/m2; p < 0.001), waist circumfe-rence (111.7 ± 13.9 cm vs. 89.8 ± 8.2 cm; p < 0.001), hip circumference (109.8 ± 14.5 cm vs. 97.4 ± 5.5 cm; p < 0.001), waist-to-hip (W/H) ratio (1.02 ± 0.04 vs. 0.92 ± 0.06; p < 0.001) respectively. The results are presented in
Table 1.
In the MS group 74% of men have previously been diagnosed with T2DM. They have mean glycated hae- moglobin level—7.6% ± 1.2% and this diagnosis has been set 6.44 ± 6.52 years ago. Measuring plasma glu-cose during the day (at 8-, 12-, 15-, 22-h) we estimate mean daily level of blood sugar as 8.5 ± 2.7 mmol/l. In 77.5% of the men diabetic polyneuropathy has already been diagnosed. 26.5% of the diabetic men have diabetic retinopathy and in 30% it is proliferative. Nephropathy is found only in 2% of diabetics.
The patients without T2DM have immune-reactive in- sulin (IRI)—19.9 ± 10.5 mU/l and the calculated HOMA = 3.9 ± 1.9.
Hypertension is part of the MS in 71% of patients, and 98% of them have already been assigned to antihyperten- sive medication. The rest of them are prescribed to ap- propriate medication in the clinic. The mean level of the measured SBP is 133.4 ± 17.9 mmHg; and for DBP 82.4 ± 13.7 mmHg. 32% of the men in the control group are hypertonics.
The diagnosis dyslipidemia has already been made in 25% of patients with MS and therapy has been assigned in 81% (statin) and 19% (fibrate). After measuring lipid parameters 53% of men have low HDL, 53% have high TG, and 27.3% have both lipid abnormalities. In the con- trol group 26% of men have low HDL, 23% have high TG and 9% have both abnormalities; only 3% of them have previously been diagnosed with dyslipidemia.
Table 1. Characteristic of the study groups.
Parameter Metabolic syndrome Control group
MS total MS-low T MS-normal T
Mean ± SD Mean ± SD Mean ± SD Mean ± SD
Number 65 (65.7) 21 (32.3) 44 (67.7) 34 (34.3)
Age (years) 50 ± 10 48 ± 10 52 ± 9 51 ± 6
Height (cm) 174.8 ± 6.9 176.3 ± 6.2 174.1 ± 7.2 175.5 ± 7.0
Weight (kg) 102.1 ± 26.0*** 113.0 ± 31.1$$$ 96.9 ± 21.7§§§ 79.1 ± 8.7
BMI (kg/m2) 33.29 ± 7.69***
36.5 ± 9.5$$$ 31.8 ± 6.3§§§ 25.7 ± 2.4
Waist circumference (cm) 111.7 ± 13.9*** 114.6 ± 16.7$$$ 110.4 ± 12.5§§§ 89.8 ± 8.2
Hip circumference (cm) 109.8 ± 14.5*** 113.3 ± 17.0$$$ 108.1 ± 13.0§§§ 97.4 ± 5.5
W/H ratio 1.02 ± 0.04*** 1.01 ± 0.05$$$ 1.02 ± 0.04§§§ 0.92 ± 0.06
Fat mass (%) 34.1 ± 8.4 37.7 ± 9.3 32.4 ± 7.4
LH IU/l 5.15 ± 2.62 4.4 ± 3.0#$ 5.5 ± 2.4 5.32 ± 1.77
Estradiol pmol/l 91.4 ± 32.4 89.1 ± 31.8 92.4 ± 33.1 95.1 ± 36.2
Fasting plasma glucose mmol/l 7.42 ± 2.90* 7.41 ± 2.43$ 7.42 ± 3.12§ 5.65 ± 0.85
Data are shown as mean ± SD. Data about number of patients are shown as N (percent of the total). Differences between the MS and the control groups—***p< 0.001; *p= 0.05. Differences between the subgroups with low and normal TT—###p< 0.001; #p= 0.05. Differences between the subgroup with low TT and the control group—$$$p< 0.001, $p= 0.05. Differences between the subgroup with normal TT and the control group—§§§p< 0.001, §p= 0.05.
between the levels of LH (p < 0.05), but there isn’t such one comparing their E2. Significant difference is found comparing TT-levels of the MS-group and the controls (p < 0.001), but such is not found for E2 and LH.
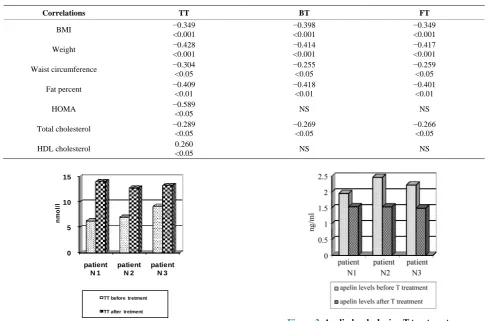
No correlation is found between TT and the age of pa- tients in the MS-group. Such is found for TT and BMI (Pearson’s = −0.349, p < 0.001), weight (Pearson’s = −0.428, p < 0.001), waist circumference (Pearson’s = −0.304, p < 0.05), fat percent (Pearson’s = −0.409, p < 0.01), HOMA index (in patients without T2DM) (Pear- son’s = −0.589, p < 0.05), total cholesterol (Pearson’s = −0.289, p < 0.05), HDL-levels (Pearson’s = 0.26, p <
0.05). Data are shown in Table 2. Correlation isn’t found
for the number of components of MS, duration of T2DM after diagnosis, HbA1c, LDL, and TG. The same correla- tions persist using the calculated levels of FT and BT, excluding that with HDL and HOMA. High correlation is found for the TT and SHBG (Pearson’s = 0.533, p < 0.001).
The questionnaire used in the study—ADAM scores the androgen deficiency in aging males. When three or more of the answers of the ten questions are positive, it is considered possible for the TT levels to be low in that patient. Our results show high correlation of the TT with the number of positive answers (Pearson’s = 0.912, p < 0.001). This correlation is preserved using FT or BT le- vels. The additional questions about morning erections and erection when watching erotic movie scenes, also show high correlation with the TT (Pearson’s = 0.533, p < 0.001 and Pearson’s = 0.825, p < 0.001). The other questionnaire—AMS that also refers to the symptoms of LOH, didn’t show correlation with the TT in our study,
neither did its part concerning the sexual function.
Apelin levels show in our study significant difference between the MS (1.61 ± 0.53 ng/ml) and the control group (1.38 ± 0.57 ng/ml, p < 0.05), as well as between the subgroup with normal TT in the MS group (1.65 ± 0.53 ng/ml) and the controls (p < 0.05). Analyzing the subgroup with low TT in the MS, the difference with the control group is insignificant. There isn’t significant cor- relation with the TT or with the FT levels in the different groups.
Significant correlations with apelin levels show other laboratory parameters:
• LDL-levels in the MS-patients (Pearson’s = 0.311, p
< 0.05), but not in the control group;
• HbA1c in men with T2DM (Pearson’s = 0.285, p <
0.05), but not with the duration of the disease;
• serum creatinine levels measured only in the MS pa-
tients (Pearson’s = 0.257, p < 0.001), but not with the calculated creatinine clearance.
We have looked for significant difference between apelin levels in MS-patients on metformin therapy (55%) and the rest in the MS-group, but such isn’t found.
Of the patients that are assigned to testosterone re- placement therapy (TRT), only three end the monitoring period, and the rest don’t mainly due to personal (mostly financial) motives. For this reason statistical analysis is not possible. One of the three patients is treated with the intramuscular injection—Nebido, and the other two with the transdermal gel—Androgel. They all have T2DM, without changing their dietary habits and therapy during the monitoring period. We establish that TT raises to
Table 2. Correlations of testosterone levels and other parameters. Data shown as Pearson’s coefficient and p value.
Correlations TT BT FT
BMI −0.349
<0.001
−0.398 <0.001
−0.349 <0.001
Weight −0.428
<0.001
−0.414 <0.001
−0.417 <0.001
Waist circumference −0.304
<0.05
−0.255 <0.05
−0.259 <0.05
Fat percent −0.409
<0.01
−0.418 <0.01
−0.401 <0.01
HOMA −0.589
<0.05 NS NS
Total cholesterol −0.289
<0.05
−0.269 <0.05
−0.266 <0.05
HDL cholesterol 0.260
<0.05 NS NS
Figure 1. TT levels during T treatment.
weight and the third doesn’t change it but does lower his fat mass, raising the lean body mass; TG after treatment are slightly lower and the total cholesterol-slightly higher; the results in the questionnaires about self-reported symptoms of androgen deficiency improve (ADAM, AMS). In all three men we establish a trend for lowering apelin levels (Figure 2).
4. Discussion
Our hypothesis in this study was that because of its tight connection with MS, LOH would influence apelin levels that are viewed to be related to the insulin resistance (IR) in the literature. Additionally we assumed that testoste- rone substitution would normalize apelin levels. As far as we know, this is the first study analyzing apelin, meta-bolic syndrome and LOH.
Our results confirm significantly higher apelin levels in men with MS compared to the controls. This is in line
with the results of Yu et al. [30]. In their study, they
analyze patients with T2DM and obesity and reveal sig- nificantly higher apelin levels in the patients compared to the control group. Furthermore, apelin levels are lower after treatment with insulin sensitizers (metformin and pioglitazone). Our data do not present significant correla-
Figure 2. Apelin levels during T treatment.
tion with BMI, as showed in other studies too [1,31,32]. Probably the reason for this is that fat tissue is not the only place of apelin synthesis, and other sources like the vascular endothelium could mask lesser secretion from there [33-35]. On the other hand, lower expression of apelin is demonstrated after weight loss [36].
We don’t find correlation between apelin, IR and hyperinsulinaemia, as some other studies reveal [30,31, 36-40]. This connection is ambiguous as higher apelin levels may be a result of IR, or a reason for it. It is estab- lished that hyperinsulinaemia leads to higher apelin se- cretion [1]. The same authors find that insulin levels are significantly lower when apelin expression is lesser in an animal model of T1DM, induced by streptozotocin. Dray
et al. [35] find better glucose utilization in peripheral tissues after apelin injection that leads to decreased IR. Other authors reveal that apelin injection inhibits glu- cose-dependant insulin secretion in mice [41]. Addition- ally lowering IR is independently associated with higher apelin levels [42].
We find correlation of serum apelin levels and gly- cated HbA1c. Some authors propose that apelin is asso- ciated more with T2DM, than with obesity [43]. Raised apelin levels could be a compensatory mechanism to insulin resistance, which is in the basis of this condition. 0
5 10 15
patient N 1
patient N 2
patient N 3
nm
ol
/l
[image:5.595.52.542.102.423.2]
Additionally there are data showing increased apelin le- vels after treatment with metformin and rosiglitazone and better glycemic control [44]. It is reported that apelin levels are unchanged in obese men with nonalchoholic steatosis without DM and hypertension [32]. Endogenous apelin may be insufficient or uncapable of reacting to the IR in diabetes or severe IR-state [43].
The literature analized gives contradictory data about apelin and IR. Limitation is the use of HOMA index to define insulin resistance as the golden standart is using euglycemic hyperinsulinaemic clamp technique. This could possibly compromise the results. A reason for the ambiguous data could be the different criteria and design in the studies.
Our work reveals significant correlation of apelin and
LDL-C in men with MS. Tasci et al. [45] report 4-fold
raise in apelin levels after 12-week programme of chang- ing lifestyle (diet and physical activity). They examine patients without diabetes or obesity, with dislipidaemia that do not use statin treatment. The participants that achieve target level for LDL-cholesterol, have also their apelin level raised. It is established that reduction of LDL-cholesterol is an independent predictive factor for the change of apelin levels in higher physical activity [42]. The same authors report no significant difference between apelin levels in patients with DM2 and normal weight, with sedentary or active lifestyle; as the sub- groups with overweight and obesity show such [42].
The etiopathogenesis of diabetic retinopathy (DRP) is not well studied. Numerous pathogenetic mechanisms are involved, one of which is the oxidative stress [46,47]. The oxidative stress plays an important role in the pa- thogenesis of the microvascular diabetic complications, decreasing the bioavailable nitric oxide (NO) [48,49]. Apelin lowers blood pressure through a NO-mediated
mechanism [11,50]. Yonem et al. report no difference in
apelin levels between patients with DRP and healthy controls [51]. Our study does not show relation of apelin and DRP.
There is a positive correlation between apelin and se- rum creatinine levels. This supports the established cor- relation with the albumin/creatinine ratio in urine sample [51]. It is reported that higher oxidative stress and lower bioavailable NO play role in the pathogenesis of diabetic
nephropathy [48,49]. Zhong et al. [52] report diminished
expression of apelin receptor and enhanced contractile response to angiotensin II in the renal arteries of diabetic mice. Apelin supplementation restores the normal vascu- lar response. Possibly the correlation with serum creati- nine may be explained by some compensatory and bene- ficial effect of apelin system on the pathogenesis of di- abetic complications [51].
Studies in prepubertal children and during puberty show different correlation of apelin and obesity [33,53].
Reinehr et al. assume that a reason for this could be the
sex hormones and possibly their effect on the apelin le- vels. The aim of our work is to look for a connection of apelin levels and sex hormones in men with MS. Our results show significant difference between the apelin levels in the group with MS and also the subgroup with normal TT levels compared to the control group. While the subgroup with low TT has apelin levels that are not significantly different from that of the controls or the subgroup with MS and normal TT level. As far as we know this is the first study concerning that interaction. Although the group with MS and the control group differ significantly by their serum apelin levels and by their TT, correlation between the last isn’t found. Anyway, the patients that are treated with testosterone, tend to have lower apelin levels after treatment. It is possibly a result of changing the body composition and weight during therapy. It is established that apelin supplement raises adrenocorticotropic hormone (ACTH) and serum cortisol and also lowers prolactine, LH and FSH up to 30 minutes after infusion in rats [13]. Our data do not show relation of apelin and LH-levels.
The part of this study focused on the effect of TRT on apelin levels may be considered only as a pilot one be- cause of the very small number of patients. In all three of them a tendency of apelin to decline was observed. Ob- viously, further larger studies are needed to clarify the effect of TRT on apelin levels and the mechanisms in- volved in this interaction. This study has also other limi-tations mainly due to the number of patients.
5. Conclusion
In this study, higher apelin levels are found in the pres-ence of MS compared to healthy men, but do not differ between men having MS with low or normal T.
Acknowledgements
This research was sponsored by Medical University— Sofia, grant № 27-D/2011 according to contract № 25-D.
Conflict of Interest Disclosure
The authors report no conflict of interests in this study.
REFERENCES
[1] J. Boucher, B. Masri, D. Daviaud, S. Gesta, C. Guigne, A. Mazzucotelli, et al., “Apelin, a Newly Identified Adipokine Up-Regulated by Insulin and Obesity,” Endocrinology, Vol. 146, No. 4, 2005, pp. 1764-1771.
http://dx.doi.org/10.1210/en.2004-1427
Communications, Vol. 251, No. 2, 1998, pp. 471-476. http://dx.doi.org/10.1006/bbrc.1998.9489
[3] B. O’Dowd, M. Heiber, A. Chan, H. Heng, L. Tsui, J. Kennedy, et al., “A Human Gene That Shows Identity with the Gene Encoding the Angiotensin Receptor Is Lo- cated on Chromosome 11,” Gene, Vol. 136, No. 1-2, 1993, pp. 355-360.
http://dx.doi.org/10.1016/0378-1119(93)90495-O
[4] A. D. Medhurst, C. A. Jennings, M. J. Robbins, R. P. Davis, C. Ellis, K. Y. Winborn, et al., “Pharmacological and Immunohistochemical Characterization of the APJ Receptor and Its Endogenous Ligand Apelin,” Journal of Neurochemistry, Vol. 84, No. 5, 2003, pp. 1162-1172. http://dx.doi.org/10.1046/j.1471-4159.2003.01587.x [5] A. M. O’Carroll, T. L. Selby, M. Palkovits and S. J.
Lolait, “Distribution of mRNA Encoding B78/APJ, the Rat Homologue of the Human APJ Receptor, and Its En-dogenous Ligand Apelin in Brain and Peripheral Tis- sues,” Biochimica et Biophysica Acta, Vol. 1492, No. 1, 2000, pp. 72-80.
http://dx.doi.org/10.1016/S0167-4781(00)00072-5
[6] I. Falcao-Pires and A. F. Leite-Moreira, “Apelin: A Novel Neurohumoral Modulator of the Cardiovascular System: Pathophysiologic Importance and Potential Use as a Thera- peutic Target,” Revista Portuguesa de Cardiologia, Vol. 24, No. 10, 2005, pp. 1263-1276.
[7] M. J. Kleinz and A. P. Davenport, “Emerging Roles of Apelin in Biology and Medicine,” Pharmacology & Thera- peutics, Vol. 107, No. 2, 2005, pp. 198-211.
http://dx.doi.org/10.1016/j.pharmthera.2005.04.001
[8] B. Masri, B. Knibiehler and Y. Audigier, “Apelin Signal-ling: A Promising Pathway from Cloning to Pharmacol-ogy,” Cell Signaling, Vol. 17, No. 4, 2005, pp. 415-426. http://dx.doi.org/10.1016/j.cellsig.2004.09.018
[9] R. Ladeiras-Lopes, J. Ferreira-Martins and A. F. Leite- Moreira, “The Apelinergic System: The Role Played in Human Physiology and Pathology and Potential Thera- peutic Applications,” Arquivos Brasileiros de Cardiolo- gia, Vol. 90, No. 5, 2008, pp. 343-349.
[10] D. K. Lee, R. Cheng, T. Nguyen, T. Fan, A. P. Kariya- wasam, Y. Liu, et al., “Characterization of Apelin, the Ligand for the APJ Receptor,” Journal of Neurochemistry, Vol. 74, No. 1, 2000, pp. 34-41.
http://dx.doi.org/10.1046/j.1471-4159.2000.0740034.x
[11] K. Tatemoto, K. Takayama, M. X. Zou, I. Kumaki, W. Zhang, K. Kumano, et al., “The Novel Peptide Apelin Low- ers Blood Pressure via a Nitric Oxide-Dependent Mecha-nism,” Regulatory Peptides, Vol. 99, No. 2-3, 2001, pp. 87-92. http://dx.doi.org/10.1016/S0167-0115(01)00236-1
[12] S. D. Katugampola, J J. Maguire, S. R. Matthewson and A. P. Davenport, “[(125)I]-(Pyr(1))Apelin-13 Is a Novel Radioligand for Localizing the APJ Orphan Receptor in Human and Rat Tissues with Evidence for a Vasocon- strictor Role in Man,” British Journal of Pharmacology, Vol. 132, No. 6, 2001, pp. 1255-1260.
http://dx.doi.org/10.1038/sj.bjp.0703939
[13] A. Reaux, N. De Mota, I. Skultetyova, Z. Lenkei, S. El Messari, K. Gallatz, et al., “Physiological Role of a Novel Neuropeptide, Apelin, and Its Receptor in the Rat Brain,”
Journal of Neurochemistry, Vol. 77, No. 4, 2001, pp. 1085-1096.
http://dx.doi.org/10.1046/j.1471-4159.2001.00320.x
[14] M. Sorhede Winzell, C. Magnusson and B. Ahren, “The APJ Receptor Is Expressed in Pancreatic Islets and Its Ligand, Apelin, Inhibits Insulin Secretion in Mice,” Regu- latory Peptides, Vol. 131, No. 1-3, 2005, pp. 12-17. http://dx.doi.org/10.1016/j.regpep.2005.05.004
[15] M. V. Heinonen, A. K. Purhonen, P. Miettinen, M. Pa-akkonen, E. Pirinen, E. Alhava, et al., “Apelin, Orexin-A and Leptin Plasma Levels in Morbid Obesity and Effect of Gastric Banding,” Regulatory Peptides, Vol. 130, No. 1-2, 2005, pp. 7-13.
http://dx.doi.org/10.1016/j.regpep.2005.05.003
[16] L. Li, G. Yang, Q. Li, Y. Tang, M. Yang, H. Yang, et al., “Changes and Relations of Circulating Visfatin, Apelin, and Resistin Levels in Normal, Impaired Glucose Toler- ance, and Type 2 Diabetic Subjects,” Experimental and Clinical Endocrinology & Diabetes, Vol. 114, No. 10, 2006, pp. 544-548.
http://dx.doi.org/10.1055/s-2006-948309
[17] K. Higuchi, T. Masaki, K. Gotoh, S. Chiba, I. Katsuragi, K. Tanaka, et al., “Apelin, an APJ Receptor Ligand, Regu- lates Body Adiposity and Favors the Messenger Ribonu- cleic Acid Expression of Uncoupling Proteins in Mice,”
Endocrinology, Vol. 148, No. 6, 2007, pp. 2690-2697. http://dx.doi.org/10.1210/en.2006-1270
[18] N. E. Allen, P. N. Appleby, G. K. Davey and T. J. Key, “Lifestyle and Nutritional Determinants of Bioavailable Androgens and Related Hormones in British Men,” Cancer Causes and Control, Vol. 13, No. 4, 2002, pp. 353-363. http://dx.doi.org/10.1023/A:1015238102830
[19] R. R. Kalyani and A. S. Dobs, “Androgen Deficiency, Diabetes, and the Metabolic Syndrome in Men,” Current Opinion in Endocrinology, Diabetes and Obesity, Vol. 14, 2007, pp. 226-234.
http://dx.doi.org/10.1097/MED.0b013e32814db856
[20] V. Kupelian, S. T. Page, A. B. Araujo, T. G. Travison, W. J. Bremner and J. B. McKinlay, “Low Sex Hormone- Binding Globulin, Total Testosterone, and Symptomatic Androgen Deficiency Are Associated with Development of the Metabolic Syndrome in Nonobese Men,” Journal of Clinical Endocrinology & Metabolism, Vol. 91, No. 3, 2006, pp. 843-850.
http://dx.doi.org/10.1210/jc.2005-1326
[21] M. Muller, D. E. Grobbee, I. den Tonkelaar, S. W. Lam- berts and Y. T. van der Schouw, “Endogenous Sex Hor- mones and Metabolic Syndrome in Aging Men,” Journal of Clinical Endocrinology & Metabolism, Vol. 90, No. 5, 2005, pp. 2618-2623.
http://dx.doi.org/10.1210/jc.2004-1158
[22] S. A. Kaplan, A. G. Meehan and A. Shah, “The Age Re- lated Decrease in Testosterone Is Significantly Exacer- bated in Obese Men with the Metabolic Syndrome. What Are the Implications for the Relatively High Incidence of Erectile Dysfunction Observed in These Men?” Journal of Urology, Vol. 176, No. 4, 2006, pp. 1524-1528. http://dx.doi.org/10.1016/j.juro.2006.06.003
and Metabolic Syndrome,” Journal of Andrology, Vol. 30, No. 4, 2009, pp. 370-376.
[24] A. Rodriguez, D. C. Muller, E. J. Metter, M. Maggio, S. M. Harman, M. R. Blackman and R. Andres, “Aging, Androgens, and the Metabolic Syndrome in a Longitudinal Study of Aging,” Journal of Clinical Endocrinology & Metabolism, Vol. 92, No. 9, 2007, pp. 3568-3572. http://dx.doi.org/10.1210/jc.2006-2764
[25] D. E. Laaksonen, L. Niskanen, K. Punnonen, K. Nyyssonen, T. P. Tuomainen, V. P. Valkonen and J. T. Salonen, “The Metabolic Syndrome and Smoking in Relation to Hypo- gonadism in Middle-Aged Men: A Prospective Cohort Study,” Journal of Clinical Endocrinology & Metabolism, Vol. 90, No. 2, 2005, pp. 712-719.
http://dx.doi.org/10.1210/jc.2004-0970
[26] ‘The IDF Consensus Worldwide Definition of the Meta- bolic Syndrome,” 2005.
http://www.idf.org/webdata/docs/Metac_syndrome_def.pdf
[27] T. Mulligan, M. F. Frick, Q. C. Zuraw, A. Stemhagen and C. McWhirter, “Prevalence of Hypogonadism in Males Aged at Least 45 Years: The HIM Study,” International Journal of Clinical Pharmacy, Vol. 60, No. 7, 2006, pp. 762-769.
[28] J. E. Morley, E. Charlton, P. Patrick, et al., “Validation of a Screening Questionnaire for Androgen Deficiency in Aging Males,” Metabolism, Vol. 49, No. 9, 2000, pp. 1239- 1242. http://dx.doi.org/10.1053/meta.2000.8625
[29] L. A. J. Heinemann, T. Zimmermann, A. Vermeulen and C. Thiel, “A New ‘Aging Male’s Symptoms’ (AMS) Rat- ing Scale,” Aging Male, Vol. 2, No. 2, 1999, pp. 105-114. http://dx.doi.org/10.3109/13685539909003173
[30] S. Yu, Y. Zhang, M. Li, et al., “Chemerin and Apelin Are Positively Correlated with Inflammation in Obese Type 2 Diabetic Patients,” Chinese Medical Journal, Vol. 125, No. 19, 2012, pp. 3440-3444.
[31] F. Soriguer, L. Garrido-Sanchez, S. Garcia-Serrano, et al., “Apelin Levels Are Increased in Morbidly Obese Subjects with Type 2 Diabetes Mellitus,”Obesity Surgery, Vol. 19, No. 11, 2009, pp. 1574-1580.
http://dx.doi.org/10.1007/s11695-009-9955-y
[32] T. M. Wallace and D. R. Matthews, “The Assessment of Insulin Resistance in Man,” Diabetic Medicine, Vol. 19, No. 7, 2002, pp. 527-534.
http://dx.doi.org/10.1046/j.1464-5491.2002.00745.x
[33] T. Reinehr, J. Woelfle and C. L. Roth, “Lack of Associa- tion between Apelin, Insulin Resistance, Cardiovascular Risk Factors, and Obesity in Children: A Longitudinal Analysis,” Metabolism—Clinical and Experimental, Vol. 60, No. 9, 2011, pp. 1349-1354.
http://dx.doi.org/10.1016/j.metabol.2011.02.005
[34] J. Beltowski and A. Kedra, “Asymmetric Dimethylargi- nine (ADMA) as a Target for Pharmacotherapy,” Phar- macological Research, Vol. 58, 2006, pp. 159-178. [35] C. Dray, C. Knauf, D. Daviaud, A. Waget, J. Boucher, M.
Buléon, et al., “Apelin Stimulates Glucose Utilization in Normal and Obese Insulin-Resistant Mice,” Cell Meta- bolism, Vol. 8, No. 5, 2008, pp. 437-445.
http://dx.doi.org/10.1016/j.cmet.2008.10.003
[36] I. Castan-Laurell, M. Vítkova, D. Daviaud, C. Dray, M.
Kováciková, Z. Kovacova, J. Hejnova, V. Stich and P. Valet, “Effect of Hypocaloric Diet-Induced Weight Loss in Obese Women on Plasma Apelin and Adipose Tissue Expression of Apelin and APJ,” European Journal of En-
docrinology, Vol. 158, 2008, pp. 905-910. http://dx.doi.org/10.1530/EJE-08-0039
[37] M. V. Heinonen, A. K. Purhonen, P. Miettinen, M. Pääkkö- nen, E. Pirinen, E. Alhava, K. Akerman and K. H. Herzig, “Apelin, Orexin-A and Leptin Serum Levels in Morbid Obesity and Effect of Gastric Banding,” Regulatory Peptides, Vol. 130, No. 1-2, 2005, pp. 7-13.
http://dx.doi.org/10.1016/j.regpep.2005.05.003
[38] I. Castan-Laurell, J. Boucher, C. Dray, D. Daviaud, C. Gui- gné and P. Valet, “Apelin, a Novel Adipokine Over-Pro- duced in Obesity: Friend or Foe?” Molecularand Cellular Endocrinology, Vol. 245, No. 1-2, 2005, pp. 7-9. http://dx.doi.org/10.1016/j.mce.2005.09.012
[39] L. Li, G. Yang, Q. Li, Y. Tang, M. Yang, H. Yang and K. Li, “Changes and Relations of Circulating Visfatin, Apelin, and Resistin Levels in Normal, Impaired Glucose Tole- rance, and Type 2 Diabetic Subjects,” Experimental and Clinical Endocrinology & Diabetes, Vol. 114, No. 10, 2006, pp. 544-548. http://dx.doi.org/10.1055/s-2006-948309
[40] M. V. Heinonen, D. E. Laaksonen, T. Karhu, L. Karhunen, T. Laitinen, S. Kainulainen, A. Rissanen, L. Niskanen and K. H. Herzig, “Effect of Dietinduced Weight Loss on Plasma Apelin and Cytokine Levels in Individuals with the Metabolic Syndrome,” Nutrition, Metabolism& Car-
diovascular Diseases, Vol. 19, No. 9, 2009, pp. 626-633. http://dx.doi.org/10.1016/j.numecd.2008.12.008
[41] M. Sörhede Winzell, C. Magnusson and B. Ahrén, “The APJ Receptor Is Expressed in Pancreatic Islets and Its Li- gand, Apelin, Inhibits Insulin Secretion in Mice,” Regulatory Peptides, Vol. 131, No. 1-3, 2005, pp. 12-17.
http://dx.doi.org/10.1016/j.regpep.2005.05.004
[42] N. P. Kadoglou, I. S. Vrabas, A. Kapelouzou, S. Lampro- poulos, N. Sailer, A. Kostakis, C. D. Liapis and N. Ange- lopoulou, “The Impact of Aerobic Exercise Training on Novel Adipokines, Apelin and Ghrelin, in Patients with Type 2 Diabetes,” Medical Science Monitor, Vol. 18, No. 5, 2012, pp. CR290-CR295.
http://dx.doi.org/10.12659/MSM.882734
[43] C. Dray, C. Debard, J. Jager, E. Disse, D. Daviaud, P. Martin, C. Attané, E. Wanecq, C. Guigné, F. Bost, J. F. Tanti, M. Laville, H. Vidal, P. Valet and I. Castan-Laurell, “Apelin and APJ Regulation in Adipose Tissue and Skeletal Mu- scle of Type 2 Diabetic Mice and Humans,” American Journal of Physiology. Endocrinology and Metabolism, Vol. 298, No. 6, 2010, pp. E1161-E1169.
http://dx.doi.org/10.1152/ajpendo.00598.2009
[44] N. P. Kadoglou, F. Iliadis, N. Angelopoulou, N. Sailer, G. Fotiadis, K. Voliotis, I. Vitta, C. D. Liapis and M. Alevi- zos, “Cardiorespiratory Capacity Is Associated with Favour- able Cardiovascular Risk Profile in Patients with Type 2 Diabetes,” Journal of Diabetes and Its Complications, Vol. 23, No. 3, 2009, pp. 160-166.
http://dx.doi.org/10.1016/j.jdiacomp.2007.12.008
lesterolemia,” Atherosclerosis, Vol. 204, No. 1, 2009, pp. 222-228.
[46] M. Brownlee, “The Pathobiology of Diabetes Complications. A Unifying Mechanism,” Diabetes, Vol. 54, No. 6, 2005, pp. 1615-1625.
http://dx.doi.org/10.2337/diabetes.54.6.1615
[47] A. Ceriello, “New Insights on Oxidative Stress and Diabe- tic Complications May Lead to a ‘Causal’ Antioxidant The- rapy,” Diabetes Care, Vol. 26, No. 5, 2003, pp. 1589-1596. http://dx.doi.org/10.2337/diacare.26.5.1589
[48] F. Palm, D. G. Buerk, P. O. Carlsson, P. Hansell and P. Liss, “Reduced Nitric Oxide Concentration in the Renal Cortex of Streptozotocin-Induced Diabetic Rats: Effects on Renal Oxygenate and Microcirculation,” Diabetes, Vol. 54, No. 11, 2005, pp. 3282-3287.
http://dx.doi.org/10.2337/diabetes.54.11.3282
[49] C. G. Schnackenberg, “Physiological and Pathophysio- logical Roles of Oxygen Radicals in the Renal Microvas- culature,” American Journal of Physiology. Regulatory,
Integrative and Comparative Physiology, Vol. 282, No. 2,
2002, pp. R335-R342.
[50] O. Grisk, “Apelin and Vascular Dysfunction in Type 2 Dia- betes,” Cardiovascular Research, Vol. 74, No. 3, 2007, pp. 339-340.
http://dx.doi.org/10.1016/j.cardiores.2007.03.026
[51] A. Yonem, C. Duran, M. Unal, O. M. Ipcioglu and O. Ozcan, “Plasma Apelin and Asymmetric Dimethylarginine Levels in Type 2 Diabetic Patients with Diabetic Retinopathy,”
Diabetes Research and Clinical Practice, Vol. 84, No. 3, 2009, pp. 219-223.
http://dx.doi.org/10.1016/j.diabres.2009.03.001
[52] J. C. Zhong, Y. Huang, L. M. Yung, C. W. Lau, F. P. Leung, W. T. Wong, S. G. Lin and X. Y. Yu, “The Novel Peptide Apelin Regulates Intrarenal Artery Tone in Diabetic Mice,”
Regulatory Peptides, Vol. 144, No. 1-3, 2007, pp. 109-114. [53] S. Tapan, E. Tascilar, A. Abaci, A. Sonmez, S. Kilic, M.
K. Erbil and O. Ozcan, “Decreased Plasma Apelin Levels in Pubertal Obese Children,” Journal of Pediatric Endo-
crinology & Metabolism, Vol. 23, No. 10, 2010, pp. 1039- 1046. http://dx.doi.org/10.1515/jpem.2010.165
Abbreviations
ACTH—adrenocorticotropic hormone ADAM—androgen deficiency in aging males AMS—aging male’s symptoms
APJ receptor—G protein-coupled receptor which binds apelin
BMI—body mass index BP—blood pressure
BT—bioavailable testosterone C—control group
DBP—diastolic blood pressure DM—diabetes mellitus DRP—diabetic retinopathy E2—estradiol
FSH—follicle-stimulating hormone FT—free testosterone
HbA1c—glycated haemoglobin HDL— high density lipoproteins
HOMA—homeostatic index of insulin resistance
LH—luteinizing hormone
IDF—International Diabetes Federation IR—insulin resistance
IRI—immune-reactive insulin LDL—low density lipoproteins LOH—late-onset hypogonadism MS—metabolic syndrome NO—nitric oxide
NS—non significant
SBP—systolic blood pressure SD—standard deviation
SHBG—sex-hormone binding globulin T—testosterone
TG—triglycerides
TRT—testosterone replacement therapy TT—total testosterone