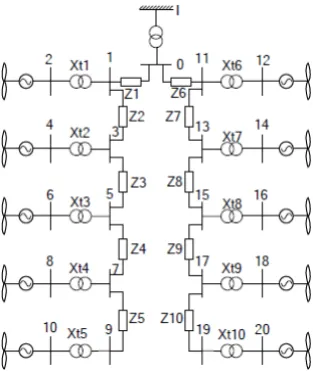
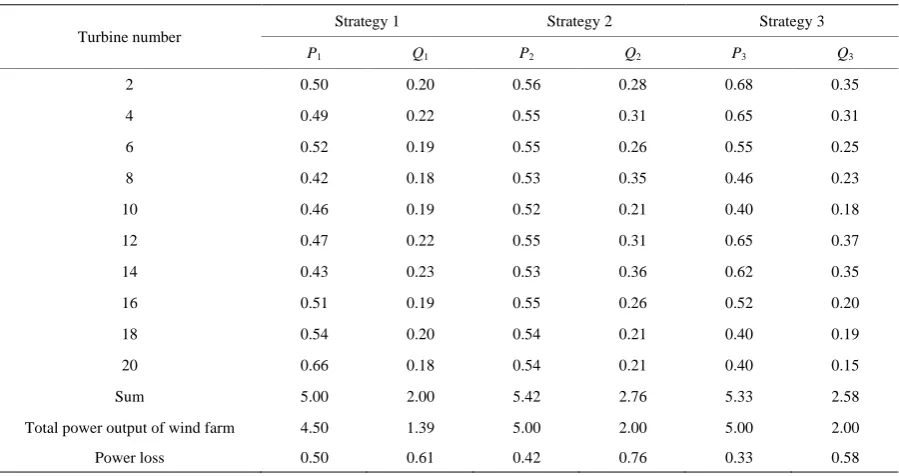
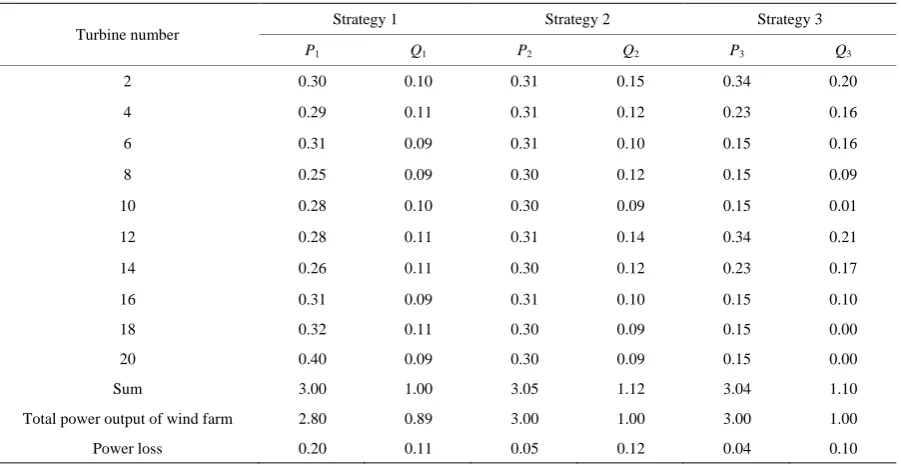
Power Distribution Strategy Considering Active Power Loss for DFIGs Wind Farm
Full text
Figure


Related documents
Findings of the study indicated that majority 172(51.3%) of the pupils reported that they parents did not always check their homework. The more the parents get involved in
We have derived the mathematical relationship between the coefficient of variation associated with repeated measurements from quantitative assays and the expected fraction of pairs
Mid-term cost-effectiveness analysis of open and endovascular repair for ruptured abdominal aortic
The experimental results for zebrafish eggs classification into three distinct classes: live egg, live embryo, dead egg show higher accuracy using the texture and
rested at base on the [Title III] court's approval of a settlement between the Commonwealth and COFINA pursuant to which the Commonwealth retained 46.35% of SUT
When a piece of chromosome situated normally in a section not affected by temperature (the part of the right of Lobe-c) is brought near to the spindle fiber by
2- Relatively lower corrosion rates of stainless steels at both high and low fluid velocity was partly due to (a) reduced oxygen solubility at high temperatures, (b) formation of
Increase in solution concentration caused a significant rise in passi- vation current density for both steels which eventually led to a progressive increase in the metastable region
