Munich Personal RePEc Archive
Indicators DZ and RDZ: essence,
methods of calculation, signals and rules
of trading
Kozmenko, Serhiy and Plastun, Oleksiy
Ukrainian Academy of Banking of the National Bank of Ukraine
15 November 2011
Online at
https://mpra.ub.uni-muenchen.de/50791/
Serhiy Kozmenko (Ukraine), Oleksiy Plastun (Ukraine)
Indicators DZ and RDZ: essence, methods of calculation
,
signals and
rules of trading
Abstract
Speculators exert more and more influence on prices on world exchange markets. Often the result of this is a formation of so-called “bubbles” with subsequent shocks to national and global economy. The purpose of speculators is earnings in a relatively short period of time using the differences in prices for exchange assets. Most of the speculators as a reference point for decision-making use technical analysis methods (prediction of future prices based on previous pric-es). Using more sophisticated methods gives advantage and opportunity to earn on a relatively short-term fluctuations in the exchange markets.
General rules of technical analysis applied to all types of exchange markets – foreign exchange and stock markets, commodity markets and markets for derivative financial instruments. Thus, developing of a new technical indicator or trading strategy for FOREX (foreign exchange market) can be applied to analyze prices of gold or oil, stock indices and stock prices.
Keywords: technical analysis, indicator, oscillator, normal distribution.
JEL Classification: C15, G10, G14.
Introduction¤
Technical indicators of oscillatory class determine overbought/oversold zones and try to signal whether price is too high or too low. Most of them in calcu-lating algorithm use price characteristics (high, low, open, close for a certain trading period). But, taking into account the main goal of oscillatory indicators – determine overbought/oversold zones, trading range (difference between maximum and minimum price during certain trading period) is a better base for calculations. As a methodological base for calcula-tion algorithm for oscillators can be used normal distribution and its rules.
So, this paper is devoted to developing of the alterna-tive oscillatory indicator based on mentioned higher assumptions.
1. Incorporation of the current situation in the market in trading strategy
A serious weakness of many trading strategies is that they were formed in certain market conditions. Accordingly, strategy parameters and sometimes it’s logic are determined by market conditions in which they were formed. The key parameters of any strategy are the entry point (price of exchange asset on which position is opened), profit per trans-action (usually called “take profit”) and maximum amount of losses per transaction (usually called “stop loss”). And if the entry point is determined by the strategy algorithm, take profit and stop loss are usually optimized in the process of strategy testing. However, the volatility dynamics of the market instruments, especially in the second half of
[image:2.595.309.535.424.594.2]
2008 (see Figure 1) shows that the fixation of these parameters in a long period of time, almost for sure, makes any working strategy unprofitable. Changes in market conditions, submitted for ex-ample by the size of daily trading range, will lead to changes in the trading strategy parameters such as take profit and stop loss, because they depend on the level of volatility.
Fig. 1. Daytime fluctuations in the currency pair EUR/USD for the period of 1998-2010 [2]
As we can see from Figure 1, the average size of daily fluctuations is constantly changing. In the beginning of 2000’s range of these fluctuations was not so big, but in 2008 it increased almost in two times (2008 is compared with 2007). That means, market conditions have changed and changed very much. So, trading strategy must be modified accord-ing to these new conditions.
Solution of this situation, we see in the definition of key parameters of a trading strategy depending
0 20 40 60 80 100 120 140 160 180 200
current market conditions may act the market volatility in the form of average daily range. To do this, statistical instruments can be applied. In our opinion, only few indicators nowadays use statistical methods in their algorithmic, instead they use rather dubious assumptions and connec-tions. In addition, a rare indicator gives clear and absolute parameters for trading (entry point, value of take profit and stop loss), because they work with the relative values. But these parameters are very essential for any trading strategy. According to this we have another very important point, which also does not take into account by current indicators and strategies, built on them, the mar-ket volatility. Under some conditions, a certain set of parameters of the trading strategy works well and can be chosen as a working one. However, once the conditions have changed, these parame-ters may quickly become unusable, and therefore strategy, based on them, become ineffective too. It means, the indicator should (in ideal) generate the trading parameters according to the current market realities.
2. The idea of oscillator indicator based on statistical analysis
Most of these problems can be solved by applying statistical instruments as a base for construction the indicator (device or element, displaying the progress of the process or state of the object of observation, its qualitative or quantitative characteristics in a form suitable for human perception [7]), which would generate necessary parameters for the current state of the market and would react and modified accordingly to the current market conditions.
Classes of indicators that can satisfy these require-ments are oscillators. Indicators of this class are ac-tually responsible for the entry point [17]. Despite the fairly extensive study of this issue, we would like to propose an alternative (or more correctly – another) approach to the construction of oscillator indicator. Today there is no common position on technical analysis and its methods. In our opinion, certain method is working only if it gives statistically sig-nificant results, for example the percentage of suc-cessful signals generated by a particular indicator, should exceed a certain value. However, each class of indicators works only in a particular type of market: oscillators are inefficient in case of trend, and trend indicators give a lot of false sig-nals in case of flat. Usually critics of technical analysis, tend to ignore these provisions, analyz-ing the effectiveness of technical analysis methods. So analyzing the effectiveness of a certain indicator,
we will take to consideration it’s class and condi-tions in which it works.
The idea of proposed alternative oscillator indicator is in including market volatility in its algorithm. As a simple variant of volatility measuring we propose to use daily ranges of a certain market instrument (difference between maximum and minimum price during daily trading session) with further calculating of it’s average range. Since the previous day’s range is more important than the range month ago, we will use in calculations the weighted average formula. So the maximum weight will be assigned to the last value of the range, and minimum to the starting period (this may be a week or a month, depending on the indicator period).
As a minimum period of indicator, we propose to take a week (for the analysis – it is five days, since the data for Saturday and Sunday, is absent because of weekend).
Thus, formula for calculating of the average range will be as follows:
¦
¦
u
n i i n i i i iW
LOW
HIGH
W
n
dz
aver
1 1)
(
)
)(
(
(1)dz
aver_ is the average daily range for the period
n; n is the averaging period, showing the number of days (periods) involved in the calculation of av-erage; Wi is the weight of the i-th element equal to (
n
i
1
); HIGHi is the maximum price for the i-th period; LOWi is the minimum price for the i-th period.3. Normal distribution as a basis for the indicator’s construction
The basis of proposed indicator is normal distribu-tion, according to which the zone formed by the average value r
V
(standard deviation) covers 68% of the random variable values. For average value r3
V
it will be 99,7%. So, normal distribution gives us opportunity, based on a statistical analysis of daily range data (in our case volatility), to deter-mine the likely range for today (with a certain prob-ability of course). That gives great opportunities for intraday trading.Normal distribution, also called the Gaussian distri-bution, is a probability distridistri-bution, where the re-sulting value can be affected by a large number of random factors [8].
Central limit theorem (CLT) states conditions under which the mean of a sufficiently large number of independent random variables, each with finite mean and variance, will be approximately normally distributed [5].
Random variable is a variable which value is deter-mined by chance with certain probability [1].
A few words about the use of the notion “random variable” for market prices. Market prices are influ-enced by a large number of different factors: eco-nomical, political, natural, etc. Since the number of factors affecting the movement of prices is so big, their influence is so different that eventually movement acquires the character of random fluc-tuations (in a limited time frame). In addition, each market day provides an occasion to assert that reaction, at least within one day, of certain news can be quite unpredictable and does not conform to the classical understanding of the reaction to this type of news. For example, the publication of good economical data for the U.S. does not mean that the dollar will strengthen í it can both rise or fall, or remain the same even without any serious changes.
The overall conclusion is that price fluctuations can be considered as random variables. Thus, the dai-ly range is quite fit the description of random variable. Nevertheless, in order to confirm our logical calculations, we have analyzed the nor-mality of daily ranges with the help of specially developed criteria.
Since the normal distribution is often encountered in practice, there are some special statistical tests on the normality:
1. Pearson’s chi-square test; 2. Kolmogorov-Smirnov test; 3. Anderson-Darling test; 4. Jarque-Bera test; 5. Shapiro-Wilk test;
6. “graphical methods” í not so much a criterion as a graphic illustration: points of a specially constructed graph should lie almost on one line [6].
To test daily ranges for normality we used the Pear-son’s chi-square test. To do this, we randomly se-lected 100 daily ranges of price changes for the pe-riod of 2006-2008 (Table 1).
Table 1. Checking daily ranges of currency pair EUR/USD for normality
2006 2007 2008 Number of values 100
Average 80,14 73,62 145,19 Standard deviation 28,37 24,5 51,67 Confidence probability 0,95
Test statistic 6,1 9,37 9.12
2
Fdistribution (F2 (p=0.95, f=7) ) 14.1
Conclusion Data obey normal distribution Thus, ranges obey to the normal distribution, so calcu-lating zone “average range r
V
sigma (standard devi-ation)”, we can actually evaluate even before the start of the day determine the upper and lower limit of price changes for today with a probability of 68% (accord-ing to the law of normal distribution). That is a good precondition for a future indicator. We named it “Di-apasonium” or abbreviated as “DZ”.4. Algorithm of construction
There are two approaches to the construction of this indicator. The first one is in relative values (to name it we will use the abbreviation RDZ) and the second one is in absolute values (abbreviation DZ).
The data used to construct the indicator: 1. Average range (AD) í aver_dz.
2. Standard deviation of the range (
V
)í sigma_dz. 3. Current daily parameters: current price (P);cur-rent maximum (maximum for today í High); current minimum (minimum for today í Low); open price (Open).
4. Current daily range (TD).
5. Period of indicator (n) í number of days in-volved in calculating the average.
Procedure of calculating:
Determination of the candle type (black or white) – Japanese candlestick is a price plotting technique that offers a quick and easy method of identifying the price movement of a currency pair [18]. Black candle describes downward motion, white – upward. (Opení P)> = 0 – black,
(Opení P) < 0 – white. If the candle is black, then
TD = P í High (TD in this case, negative).
If white then TD = P í Low (TD in this case positive). The calculation of the oscillator (RDZ):
) (
100
V
u
AD TD RDZ
(2)
Fig. 2 View of the indicator RDZ
Here + / - 100 are the upper limits of the indicator. Achievement of these borders signals of strong movement in the current period, which exceeds the average range, adjusted for standard deviation. Values 75-100 will act as an overbought zone, (-75)-(-100) – oversold zone. These values were determined based on the fact that the first entry should be made out of zone (aver_dz í sigma_dz) or (–aver_dz+sigma_dz). Rules of trading in this case are the same as for the standard oscillators – buy in the oversold zone and close opened position after entering the overbought zone. And vise versa for short positions.
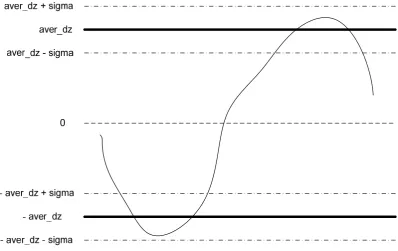
A possible alternative to this construction is to use not relative but absolute values. In this case, we have
several signal lines. Lines +/- average range (AD), as well as lines showing +/- standard deviation (sigma). Thus we get a graphic representation of 68% probability zone of current day’s range. Range (aver_dz +/-sigma_dz) is overbought zone, range (-aver_dz +/- sigma_dz) is oversold zone.
Graphically, it looks as follows (Figure 3). As for the real embodiment of the indicator DZ, then it looks as follows (Figure 4) (this figure is a screen-shot from the trading platform MetaTrader, where the indicator DZ acts as a custom setting imple-mented by the author using the internal program-ming language MQ Language).
[image:5.595.102.501.479.730.2]Fig. 4. View of indicator DZ in the trading platform MetaTrader [10]
As we can see from Figure 4, the indicator consists of
Ƈ three upper lines (sale zone (overbought): defin-ing respectively (aver_dz – sigma_dz), (aver_dz) and (aver_dz + sigma_dz));
Ƈ three lower lines (buy zone (oversold)): defining respectively (-aver_dz + sigma_dz), (-aver_dz), (-aver_dz – sigma_dz);
Ƈ middle line (determines the current range – TD). Interpretation of indicator DZ is even easier – bought zone begins from (aver_dz-sigma_dz), over-sold zone – from (-aver_dz + sigma_dz). The main difference from RDZ signals is exit point, i.e. such parameters as stop loss (the maximum amount of losses for current transaction) and take profit (value of expected profit for current transaction). Stop loss is defined as exceeding the boundaries “aver_dz + 3×sigma_dz” (this value characterizes range as a highly anomalous, in terms of statistics, in this case a strong movement out of the general track is in market, so remaining in the position may signifi-cantly increase losses, therefore it must be closed). Take profit is defined as “1.5×aver_dz” (the magni-tude of the average range, which roughly describes the size of the fluctuations required for entry into the opposite overbought/oversold zone).
Thus, we considered the basic approaches to the construction of indicators DZ and RDZ, reviewed the basics of working with them and suggested models of their view. However, the analysis would be incomplete without consideration of their effec-tiveness in comparison with the existing indicators of the oscillator class.
5. Testing
To assess the quality of proposed oscillator indica-tors, we compare the result of their work with the best known and most frequently used indicator of oscillator type – RSI (relative strengthen index) [12].
As a market instrument (asset) for the analysis, we chose currency pair EUR/USD. Trading platform MetaTrader was used as a testing tool. Algorithm of the indicators was implemented using the integrated programming language MetaLanguage (MQ lan-guage). Testing was carried out by imitation model-ing in the MetaTrader. As the testmodel-ing period, we chose 2010 as well as two months of 2011 in order to increase the representativeness of the sample. Testing period was divided into months (to analyze the behavior of the indicators on different types of market – uptrend, downtrend and flat). Parameters for the indicators: RSI period í 14, DZ/RDZ period
í 9. The overbought/oversold zones: RSI í 70/30, DZ – (aver_dz í sigma_dz)/(-aver_dz + sigma_dz), RDZí +80/-80. Position is closed after reaching the opposite overbought/oversold zone for RSI and RDZ, for DZ – stop loss = 3×sigma_dz, take profit = 1.5×aver_dz.
The overall financial result was -1,254 c.u. (continuous testing without division on months) and -1,770 c.u. (in case of monthly division – the sum of financial results for each month). The average loss per month was 126 with average probability of profitable posi-tion 46%. Condiposi-tional unit (c.u.) is U.S. dollars for the position volume of 10 000 USD.
Table 2. Test results for the RSI indicator in 2010-2011*
Period Market type Number of transactions % of successful one Financial results January 2010 Down trend 5 80 -38 February 2010 Flat 10 70 648 March 2010 Flat 10 70 520 April 2010 Flat 5 40 -371 May 2010 Down trend 5 40 110 June 2010 Up trend/ Flat 3 0 -432 July 2010 Up trend 5 40 -391 August 2010 Down trend/
Flat 2 0 -533 September 2010 Up trend 3 0 -899
October 2010 Flat 7 71 166 November 2010 Down trend 4 25 -1116 December 2010 Flat 7 85 440 January 2011 Up trend 6 50 -224 February 2011 Flat 7 71 380 Total - 79 46 -1770 Average - 6 46 -126 The whole
period - 72 57 -1254
Note: * 2011 is presented by first two months.
The next stage of testing was to evaluate the per-formance of the indicator DZ. Results are presented in Table 3.
Table 3. Test results for the DZ indicator in 2010-2011* Period Market type Number of transactions % of successful one Financial results January 2010 Down trend 9 22 -319 February 2010 Flat 11 45 465 March 2010 Flat 12 50 306 April 2010 Flat 8 38 16 May 2010 Down trend 11 46 189 June 2010 Up trend/
Flat 7 43 -238 July 2010 Up trend 7 14 -571
August 2010 Down
trend/ Flat 9 33 -44 September 2010 Up trend 10 10 -876
October 2010 Flat 10 40 262 November 2010 Down trend 12 33 1 December 2010 Flat 7 57 124 January 2011 Up trend 10 30 -620 February 2011 Flat 7 29 -25
Total - 130 35 -1330 Average - 9 35 -95 The whole
period - 118 32 -1344
Note: * 2011 is presented by first two months.
Behavior of the indicator DZ also clearly indicates it’s oscillatory nature. Positive moment, in our opi-nion, are differences in results, which suggest that we have developed fundamentally different indica-tor. It differs not only in essence and method of calculation, but by the results of testing. Overall financial results are significantly better then RSI’s results. Considering worst percentage of successful transactions (32% for DZ versus 46% for RSI) we can make conclusions about its significant potential in case of increasing percentage of successful trans-actions, that is quite possible by prohibiting indica-tor’s signals in a trend market.
[image:7.595.306.539.431.695.2]Despite the fact that principles of the indicators DZ and RDZ are identical (both are based on normal distribution), nevertheless, conditions of entry and exit the position are different, especially in case of maintenance of existing positions. Therefore, we made analysis of the indicator RDZ, which results are shown in Table 4.
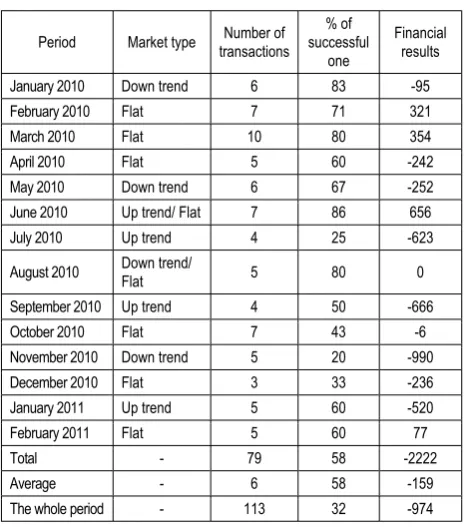
Table 4. Test results for the RDZ indicator in 2010-2011*
Period Market type Number of transactions % of successful one Financial results January 2010 Down trend 6 83 -95 February 2010 Flat 7 71 321 March 2010 Flat 10 80 354 April 2010 Flat 5 60 -242 May 2010 Down trend 6 67 -252 June 2010 Up trend/ Flat 7 86 656 July 2010 Up trend 4 25 -623 August 2010 Down trend/
Flat 5 80 0 September 2010 Up trend 4 50 -666 October 2010 Flat 7 43 -6 November 2010 Down trend 5 20 -990 December 2010 Flat 3 33 -236 January 2011 Up trend 5 60 -520 February 2011 Flat 5 60 77
Total - 79 58 -2222 Average - 6 58 -159 The whole period - 113 32 -974
Note: * 2011 was presented by first two months.
[image:7.595.60.294.545.778.2]op-posite overbought/oversold zone, without using the mechanism of stop loss and take profit, which were involved in the indicator DZ. In case of continuous testing (no monthly division), indicator showed the best results. At the same time using a monthly divi-sion í the overall financial result was, on the con-trary, the worst. This indicates on a high sensitivity of the algorithm to interfere in his work. At the same time the percentage of successful transactions averaged 58%, which is the best among the ana-lyzed results.
[image:8.595.304.537.63.275.2]The main conclusions after testing of indicators RDZ and DZ are in fact that each of them has its advantages, so combining them can be achieved synergy and test results will improve. We have pro-posed the following version of the hybrid indicator DZ/RDZ – position opening at the level of RDZ = 80, stop-loss = 3 * sigma_dz, take-profit = 1,5 * aver_dz. Tests showed the following results (Table 5).
Table 5. Test results for the hybrid DZ/RDZ indicator in 2010-2011*
Period Market type
Number of
transac-tions
% of successful
one
Financial results January 2010 Down trend 8 25 -310 February 2010 Flat 11 45 479
March 2010 Flat 12 50 309 April 2010 Flat 8 38 22 May 2010 Down trend 10 50 377 June 2010 Up trend/
Flat 6 67 382 July 2010 Up trend 7 14 -572
August 2010 Down
trend/ Flat 8 38 -47 September 2010 Up trend 8 0 -908 October 2010 Flat 9 44 270 November 2010 Down trend 12 25 -93 December 2010 Flat 6 50 -23 January 2011 Up trend 10 30 -614 February 2011 Flat 8 38 159
Total - 123 37 -569 Average - 9 37 -41 The whole period - 113 32 -974
Note: * 2011 was presented by first two months.
As we can see, hybrid indicator shows better results: the percentage of successful transactions, the aver-age result for the month, the financial result in case of a monthly breakdown and also when the conti-nuous testing was used.
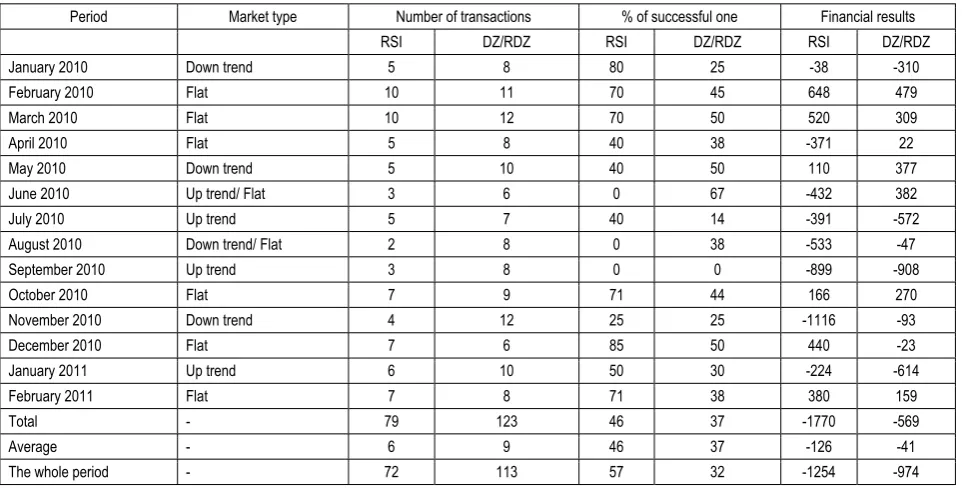
The comparison of the classical oscillator indicator RSI and proposed indicator (in this case it’s hybrid DZ/RDZ) is presented in Table 6.
Table 6. Test results for the hybrid DZ/RDZ indicator in comparison with RSI in 2010-2011* Period Market type Number of transactions % of successful one Financial results
RSI DZ/RDZ RSI DZ/RDZ RSI DZ/RDZ January 2010 Down trend 5 8 80 25 -38 -310
February 2010 Flat 10 11 70 45 648 479 March 2010 Flat 10 12 70 50 520 309 April 2010 Flat 5 8 40 38 -371 22 May 2010 Down trend 5 10 40 50 110 377 June 2010 Up trend/ Flat 3 6 0 67 -432 382 July 2010 Up trend 5 7 40 14 -391 -572 August 2010 Down trend/ Flat 2 8 0 38 -533 -47 September 2010 Up trend 3 8 0 0 -899 -908 October 2010 Flat 7 9 71 44 166 270 November 2010 Down trend 4 12 25 25 -1116 -93 December 2010 Flat 7 6 85 50 440 -23 January 2011 Up trend 6 10 50 30 -224 -614 February 2011 Flat 7 8 71 38 380 159
Total - 79 123 46 37 -1770 -569 Average - 6 9 46 37 -126 -41 The whole period - 72 113 57 32 -1254 -974
Note: * 2011 was presented by first two months.
As we can see, the effectiveness of the hybrid ver-sion DZ/RDZ indicator is significantly higher than the results of the indicator RSI (financial result in case of a monthly division for DZ/RDZ indicator is -569 against -1770 for RSI). Average result per month for
[image:8.595.57.540.432.676.2]At the same time, it is quite obvious that the use of this indicator in its pure form (as a final strategy) will not give proper effect. It is necessary to use trend indicators to enable/disable signals from the DZ/RDZ indicator.
The main advantage of this indicator is not increased probability of successful transactions, but the pres-ence of clear guidelines for the construction of a trad-ing strategy. The important thtrad-ing is that these guide-lines can be not only in relative values, but in abso-lute figures too, that gives clear instructions about stop-loss and take profit, which are very important for every trading strategy. For example, stop loss can be equated to three sigmas, so it covers 99.7% of the potential price values in the current daily range (which corresponds to essentially of stop loss í it should be executed only in an emergency, abnormal situations), and take profit í defined as the sigma multiplied by a certain factor, which can be deter-mined by testing or as the value of the average range, adjusted for a certain ratio.
Summary and conclusion
Using the statistics as a base for indicator construc-tion allows to reach some important things: consider
the market changes, get clear values of main pa-rameters of the trading strategy (stop loss, take profit), reach results which are better then existing analogues. As a base for indicator’s algorithm may act normal distribution and its rules. Operating the values of average trading ranges (in our case daily ranges) and their standard deviations (sigmas) it is possible to predict (with certain probability) range of price fluctuation for current trading period. That gives good opportunities to build indicator of oscillator class with it’s overbought/oversold zones, entry and exit points. We called this indicator DZ. Also we developed it’s relative analogue – RDZ. Acting as a typical oscillator, these indicators show better results then one of the best indicators of oscil-lator class – RSI (relative strength index). Testing shows that DZ, RDZ indicators better feel the mar-ket and faster adopt to it’s changes and have even more oscillatory nature then RSI. The best way of using indicators DZ, RDZ is their hybrid version which shows the best results.
Finally, proposed indicator(s) can be used as a basis for the trading strategy, but with necessarily trend checking before generating the signal.
References
1. Anderson, Sweeney, Williams, Freeman, Shoesmith (2010). Statistics for Business and Economics, 2nd Edition, Cengage Learning
2. Archive of quotations MetaQuotes [electronic resource] / í Mode of access: http://www.metaquotes.net.
3. Cory Janssen, Chad Langager and Casey Murphy (2006). Technical Analysis: Indicators And Oscillators, Website paper: Available at: http://www.investopedia.com/university/technical/techanalysis10.asp.
4. DeMark, Thomas R. (1994). The New Science of Technical Analysis, New York: John Wiley & Sons.
5. Fischer, H. (2010). A History of the Central Limit Theorem: From Classical to Modern Probability Theory, Springer.
6. Henry C. Thode, Jr. (2002). Testing for Normality, New York: Marcel Dekker, Inc., p. 479.
7. Indicator. Material from Wikipedia. [electronic resource] / í Mode of access: http://ru.wikipedia.org/wiki/%D0% 98%D0%BD%D0%B4%D0%B8%D0%BA%D0%B0%D1%82%D0%BE%D1%80.
8. Krishnamoorthy, K. (2006). Handbook of statistical distributions with applications. Website paper: Available at: http://reslib.com/book/Handbook_of_Statistical_Distributions_with_Applications__Krishnamoorthy_K__.
9. Lukacs, Eugene; King, Edgar P. (1954). A property of normal distribution, The Annals of Mathematical Statistics, 25 (2), pp. 389-394.
10. MetaTrader Trading Platform [electronic resource] / í Mode of access: http://www.alpari.org/.
11. Miner, R. High Probability Trading Strategies, Wiley; Har/Cdr edition (October 20, 2008). í 288 pages. 12. New Concepts in Technical Trading Systems, J. Welles Wilder, Trend Research, 1978.
13. Programming in the MQL4 Algorithmic Language [electronic resource] / í Mode of access: http://alpari-forex.com/download/mt/mql4bookrussian.chm.
14. Schwager, J. Getting Started in Technical Analysis, Wiley (February 4, 1999). í 352 pages.
15. Technical Analysis Explained: The Successful Investor’s Guide to Spotting Investment Trends and Turning Points, Martin J. Pring, McGraw Hill, 2002.
16. Technical Analysis of Stock Trends, 9th Edition (Hardcover), Robert D. Edwards, John Magee, W.H.C. Bassetti (Editor), American Management Association, 2007.
17. Technical Analysis of the Financial Markets, John J. Murphy, New York Institute of Finance, 1999.
![Fig. 1. Daytime fluctuations in the currency pair EUR/USD for the period of 1998-2010 [2]](https://thumb-us.123doks.com/thumbv2/123dok_us/7832783.732969/2.595.309.535.424.594/fig-daytime-fluctuations-currency-pair-eur-usd-period.webp)
![Fig. 4. View of indicator DZ in the trading platform MetaTrader [10]](https://thumb-us.123doks.com/thumbv2/123dok_us/7832783.732969/6.595.65.532.63.311/fig-view-indicator-dz-trading-platform-metatrader.webp)