Munich Personal RePEc Archive
Impact of Global Growth Fluctuations
on India: An Empirical Study
Jayaraman, T. K. and Choong, Chee-Keong
University of the South Pacific, Universiti Tunku Abdul Rahman
2011
Online at
https://mpra.ub.uni-muenchen.de/33685/
Impact of Global Growth Fluctuations on India: An Empirical Study
T. K. Jayaraman* <jayaraman_tk@usp.ac.fj> School of Economics
Faculty of Business and Economics The University of the South Pacific
Fiji Islands
Chee-Keong Choong <choongck@utar.edu.my> Centre for Economic Studies
Faculty of Business and Finance
Universiti Tunku Abdul Rahman (Perak Campus) Malaysia
Abstract
The article examines how growth fluctuations in major trading partner countries of the world have affected the Indian economy since its liberalization from the mid 1990s. This empirical study confirms that domestic output of India was strongly influenced by global shocks. The findings are not surprising as India’s trade and financial integration with the rest of the world has been on the rise.
Keywords: Economic integration, global shock, regional shock, India
JEL Classification – F15, O24
1. Introduction
The financial and banking crises originating in the United States (US) in late 2007, which later spread to other advanced countries in Europe in the next two years, eventually affected developing countries as well in varying degrees. Consequently, the subject of macroeconomic interdependence of developing countries including India in a globalised world has been receiving wide attention. The paper seeks to investigate how far growth fluctuations in major countries of the world with which India has developed trade and financial relations since its economic liberalisation from the mid 1990s have been impacting the country.
This article, which employs a variable autoregression (VAR) modeling procedure for estimating the degree of impact of economic activities of selected major countries on India, is organised as follows: the next section provides a brief background by tracing the progress in India’s trade and financial relations with the rest of the world; the third section outlines the methodology adopted and presents the empirical results; and the fourth and last section presents conclusions with policy implications.
2. Background
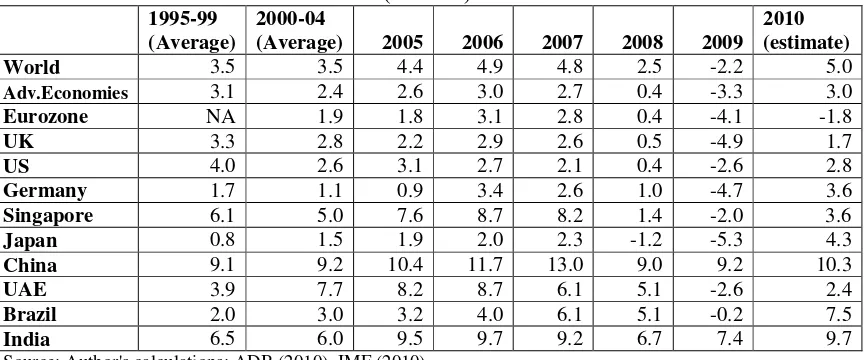
Economic growth in developed and developing countries, as reflected in the annual growth rates since the beginning of 2000 has been remarkable (Table 1). The devastating effects of the Asian financial crisis of 1997 were quickly overcome and the emerging economies led by China were marching towards growth and prosperity, which was well supported by rise in trade volumes and flow of funds between nations. Soon after the failure of some of the leading banking and financial institutions in the US and UK in 2007, the recessionary effects began to be felt across the continents commencing from early 2008 (Ram Mohan 2009).
However, there was some initial optimism, which was based on the ‘decoupling’ theory that emerging economies would be spared of the adverse impact of the crisis. It was argued that that even if the developed countries would experience a decline in economic activities as a fallout of the financial crisis, it would be a shallow crisis; and that emerging economies including India, because of their better financial regulations and control over financial sector institutions with much less exposure to the sub-prime mortgage assets of the failed institutions, and because of larger foreign exchange holdings as well, would be spared of the impact. Further, it was held that India’s growth was mainly domestic demand driven and its exports were increasingly directed to other economies and there was declining reliance on US (Boorman 2009; Boorman et al. 2010).
Table 1. Growth Rates of the World and Selected Advanced and Developing Countries (Percent)
1995-99 (Average)
2000-04
(Average) 2005 2006 2007 2008 2009 2010 (estimate) World 3.5 3.5 4.4 4.9 4.8 2.5 -2.2 5.0
Adv.Economies 3.1 2.4 2.6 3.0 2.7 0.4 -3.3 3.0 Eurozone NA 1.9 1.8 3.1 2.8 0.4 -4.1 -1.8
UK 3.3 2.8 2.2 2.9 2.6 0.5 -4.9 1.7
US 4.0 2.6 3.1 2.7 2.1 0.4 -2.6 2.8
Germany 1.7 1.1 0.9 3.4 2.6 1.0 -4.7 3.6 Singapore 6.1 5.0 7.6 8.7 8.2 1.4 -2.0 3.6 Japan 0.8 1.5 1.9 2.0 2.3 -1.2 -5.3 4.3 China 9.1 9.2 10.4 11.7 13.0 9.0 9.2 10.3
UAE 3.9 7.7 8.2 8.7 6.1 5.1 -2.6 2.4
Brazil 2.0 3.0 3.2 4.0 6.1 5.1 -0.2 7.5 India 6.5 6.0 9.5 9.7 9.2 6.7 7.4 9.7
Source: Author's calculations; ADB (2010), IMF (2010)
Observing that subsequent developments proved the optimistic expectations of mild slow-down were wrong, the Reserve Bank of India Governor Subbarao (2008) confirmed in a policy speech that there had been steady contractions with slumping demand, declining production and rise in unemployment in developed countries, which resulted in fall in trade and financial integration between developed and developing countries. Thus, the US financial crisis spread to the real sector not only in America but also in Europe and in emerging countries (Goldstein and Xie 2009). There have been events of capital flow reversals, sharp widening of spreads on sovereign and corporate debt and abrupt currency depreciations. Governor Subbarao (2008) confirmed that “in a globalized world no country can be an island”. In a subsequent speech, Governor Subbarao (2009a) noted that transmission channels of severe impact on India were through trade, financial and confidence channels, making it clear that globalisation is a double edged sword.
India’s trade relations
Over the last 50 years, world trade as a ratio of GDP more than doubled from 24 per cent in 1960 to 57 per cent in 2006, just before the financial crisis hit the world. Economic liberalization began in India in the mid 1990s as the country opened the economy to foreign and domestic competition in a number of directions. These included international trade, telecommunication and privatisation (Panagaria 2008) and progressive financial market integration from the late 1990s (Dua et al. 2004). India's integration into the world economy over the last decade has been remarkably rapid (Subbarao 2008, 2009b). Table 2, which shows the directions of trade over a two decade period, indicates that besides the steady trade with traditional partners, there were new partners of trade as well: China in Asia and countries in the Middle East and Southeast Asia.
Table 2. India's Trade in Commodities with Major Trading Partners: Shares of Total trade (in percent)
1990-1999 (Average)
2000-2004
(Average) 2005 2006 2007 2008 2009 United States 12.3 12.4 10.6 10.0 10.0 8.7 9.3 UAE 3.9 4.2 5.3 6.3 6.9 8.9 8.4 China 1.2 4.1 6.9 8.0 9.0 8.7 9.0 Singapore 2.3 3.0 3.5 3.7 3.7 3.4 3.7 United
Kingdom 1.0 1.3 2.1 2.0 1.8 1.7 1.2 Hong Kong,
China 2.1 2.3 1.8 1.6 1.5 1.4 1.5 Germany 3.4 2.1 2.3 2.4 2.4 2.4 3.0 Netherlands 0.9 0.9 0.9 0.9 1.2 1.3 0.9 Belgium 0.5 1.4 1.2 1.1 1.0 1.0 0.8 Italy 2.7 8.8 6.9 6.2 5.2 4.5 4.9 Euro area 12.5 13.1 11.4 10.6 9.8 9.2 9.6
Source: Author's calculations; ADB (2010), IMF (2010)
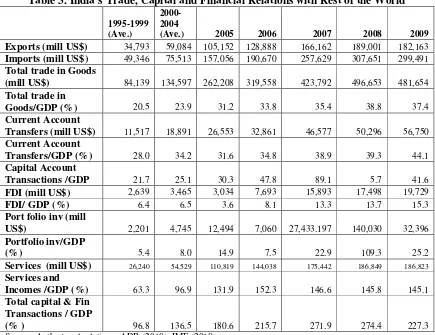
Table 3. India's Trade, Capital and Financial Relations with Rest of the World
1995-1999 (Ave.)
2000-2004
(Ave.) 2005 2006 2007 2008 2009
Exports (mill US$) 34,793 59,084 105,152 128,888 166,162 189,001 182,163
Imports (mill US$) 49,346 75,513 157,056 190,670 257,629 307,651 299,491
Total trade in Goods
(mill US$) 84,139 134,597 262,208 319,558 423,792 496,653 481,654
Total trade in
Goods/GDP (%) 20.5 23.9 31.2 33.8 35.4 38.8 37.4
Current Account
Transfers (mill US$) 11,517 18,891 26,553 32,861 46,577 50,296 56,750
Current Account
Transfers/GDP (%) 28.0 34.2 31.6 34.8 38.9 39.3 44.1
Capital Account
Transactions /GDP 21.7 25.1 30.3 47.8 89.1 5.7 41.6
FDI (mill US$) 2,639 3,465 3,034 7,693 15,893 17,498 19,729
FDI/ GDP (%) 6.4 6.5 3.6 8.1 13.3 13.7 15.3
Port folio inv (mill
US$) 2,201 4,745 12,494 7,060 27,433.197 140,030 32,396
Portfolio inv/GDP
(%) 5.4 8.0 14.9 7.5 22.9 109.3 25.2
Services (mill US$) 26,240 54,529 110,819 144,038 175,442 186,849 186,823 Services and
Incomes /GDP (%) 63.3 96.9 131.9 152.3 146.6 145.8 145.1
Total capital & Fin Transactions / GDP
[image:5.612.89.524.333.668.2]Globalisation of finance has been of much greater intensity. The ratio of total foreign assets and foreign liabilities to GDP rose from 45 per cent in 1970 to over 350 percent in 2006. Intensity of India's financial integration with the world has also been growing over the period. The ratio of total external transactions to GDP, which is an expanded measure denoting this ratio has more than doubled from average 97 percent during 1995-99 to 227 percent in 2008.
Remittances
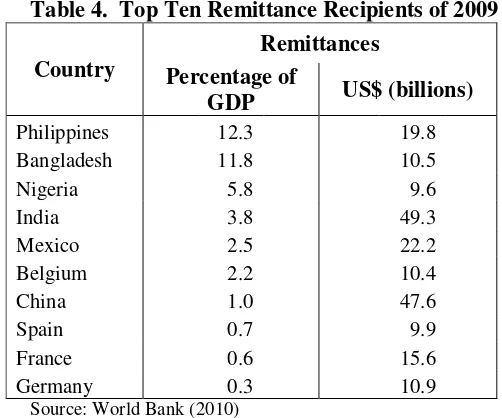
[image:6.612.180.431.264.473.2]The impact of globalisation on labour, which is reflected in the growing mobility of people over the last two decades, seeking jobs outside their countries of origin is more striking. Asia added nearly three billion to the world’s pool of labour as it integrated with the rest of the world over the last two decades. As a result, inflows of remittances to all developing countries rose. India received the highest amount of remittances in absolute terms ($49.3 billion) in 2009, which is about 3.8 percent of GDP, ranking at world number four (Table 4).
Table 4. Top Ten Remittance Recipients of 2009
Country
Remittances Percentage of
GDP US$ (billions)
Philippines 12.3 19.8 Bangladesh 11.8 10.5
Nigeria 5.8 9.6
India 3.8 49.3
Mexico 2.5 22.2
Belgium 2.2 10.4
China 1.0 47.6
Spain 0.7 9.9
France 0.6 15.6
Germany 0.3 10.9
Source: World Bank (2010)
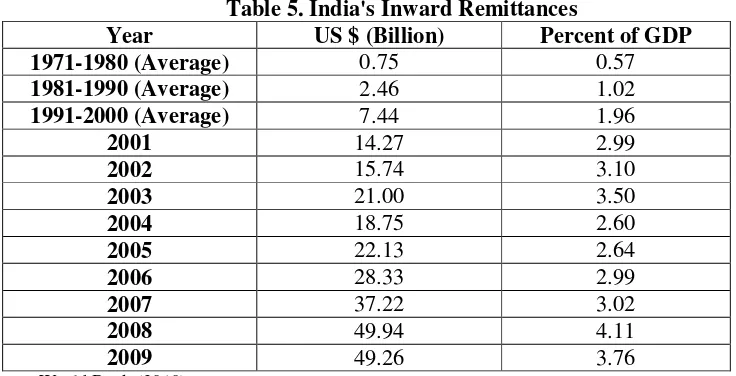
Table 5 presents the trend in India’s remittance inflows, which are of sizeable support to the country’s foreign reserves. Thus, we have been witnessing a three dimensional expansion of globalisation: trade, finance and labour. With the rapid integration of India’s economy with global economy, economic fluctuations in the major countries of the world, with which India has developed deeper trade and financial relations during the last two decades, are bound to affect India's national output. The next section deals with empirical aspects of investigation and to what extent growth fluctuations in the world affected India's growth, influencing the macroeconomic interdependence of global economy.
3. Methodology, Modeling and Results
Nature of Shocks
productivity. On the other hand, negative supply shocks dent supply. The usual external negative shocks for economies in South Asia include a rise in oil price or fall in terms of trade. Domestic negative supply shocks arise from natural disasters, such as floods and cyclones or man-made disasters, including social unrest.
Table 5. India's Inward Remittances
Year US $ (Billion) Percent of GDP
1971-1980 (Average) 0.75 0.57
1981-1990 (Average) 2.46 1.02
1991-2000 (Average) 7.44 1.96
2001 14.27 2.99
2002 15.74 3.10
2003 21.00 3.50
2004 18.75 2.60
2005 22.13 2.64
2006 28.33 2.99
2007 37.22 3.02
2008 49.94 4.11
2009 49.26 3.76
Source: World Bank (2010).
Demand shocks are also of two kinds. Positive ones are those stepping up aggregate demand, including the rise in private sector activities or fiscal stimulus during periods of depressed domestic demand. Negative demand shocks, which reduce aggregate demand usually emanate from fall in investor confidence that decreases capital formation. These shocks might originate either within a country or outside the country.
Our study seeking to investigate impacts of rising global interdependence on India, since its liberalization from the early nineties, adopts a vector autoregression (VAR) modeling methodology, which has been utilized by notable studies, including Kawai and Motonishi (2005) and Takagi (2008). The study specifically focuses on examining how shocks from one particular country to another are transmitted each quarter. However, the choice of period of study and of variables for econometric modeling to study the impact of shocks on India is dictated by the number of quarterly observations available. First, the national income data series for India on a quarterly basis are available only from 1996 onwards. Secondly, as the degrees of freedom for econometric analysis are affected by the limited number of observations as well as the number of lags employed, we have to restrict the number of countries as well. While the US (being the largest economy) and the Eurozone (the third largest economic entity) automatically choose themselves as the candidate countries, we also choose UK for its historical importance to India as the traditional major trade and investment partner.
output data series, which are expressed in respective local currency units, are first converted into index numbers, so as to eliminate the influences of exchange rate fluctuations and then transformed into respective logs before entering them into analysis.
The Model
The VAR model comprises six variables and the moving average representations are given below: − − − − − − + + + + + = j t i i j t i i j t i i j t i i j t i j t i t LIND UAE L LSGP LEURO LUK LUSA LUSA , 6 , 5 , 4 , 3 2 1 α α α α α α (1) − − − − − − + + + + + = j t i i j t i i j t i i j t i i j t i j t i t LIND UAE L SGP L LEURO LUK LUSA LUK , 6 , 5 , 4 , 3 2 1 β β β β β β (2) − − − − − − + + + + + = j t i i j t i i j t i i j t i i j t i j t i t LIND UAE L LSGP L LEURO LUK LUSA LEURO , 6 , 5 , 4 , 3 2 1 δ δ δ δ δ δ (3) − − − − − − + + + + + = j t i i j t i i j t i i j t i i j t i j t i t LIND UAE L LSGP LEURO LUK LUSA LUAE , 6 , 5 , 4 , 3 2 1 φ φ φ φ φ φ (4) − − − − − − + + + + + = j t i i j t i i j t i i j t i i j t i j t i t LIND LUAE LSGP LEURO LUK LUSA LSGP , 6 , 5 , 4 , 3 2 1 γ γ γ γ γ γ (5) − − − − − − + + + + + = j t i i j t i i j t i i j t i i j t i j t i t LIND LUAE LSGP LEURO LUK LUSA LIND , 6 , 5 , 4 , 3 2 1 η η η η η η (6) where
USA = RGDP of USA;
EURO = RGDP of Eurozone;
UK = RGDP of United Kingdom
UAE= RGDP of UAE
SGP= RGDP of Singapore
IND= RGDP of India
As noted by Takagi (2008), the estimation of a VAR system is sensitive to the choice of particular strategy such as the ordering of the variables and lag length. We assume that initially, in the first round a shock to output of USA affects the outputs of UK, Eurozone, and India; a shock to USA’s output affects the outputs of UK, Eurozone, Singapore, UAE, and India; a shock to the output of UK affects the outputs of Eurozone, Singapore, UAE, and India; a shock to the output of Singapore affects the outputs of UAE and India; and a shock to the output of UAE affects the output of India, whereas the output of India affects none.
Accordingly, we enter the variables in that order, namely: USA, UK, EURO, SGP, UAE and
IND. We employ the Akaike information criterion for determining the lag length.
Variance decomposition
Eurozone, Singapore and UAE. Specifically, it enables us to conclude about the proportion of changes in a variable resulting from its own shocks as well as shocks to other variables in the system (Enders 1995: 311). For instance, if shocks or innovations to outputs of USA, UK, Euro area, Singapore and UAE explain none of the forecast error variance of India at all periods in the time horizon, it would mean economic growth of India might have evolved independently of the global shocks.
4. Results and interpretations
Unit root tests
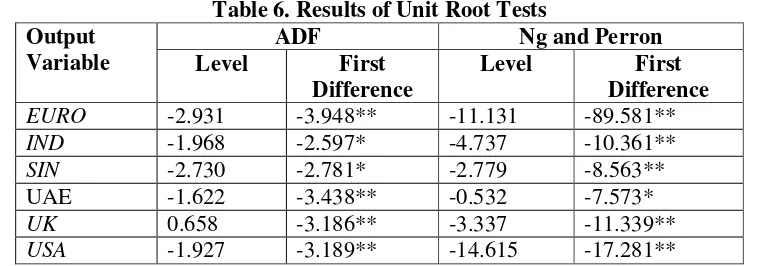
[image:9.612.116.495.277.410.2]We used two testing procedures for examining the order of integration of each series, namely Augmented Dickey-Fuller (ADF) and Ng and Perron (2001) unit root tests. The results by both tests indicate that the time series are non-stationary in levels (Table 6). After first differencing, however, unit root tests reveal that the series are of I(1).
Table 6. Results of Unit Root Tests Output
Variable
ADF Ng and Perron
Level First
Difference
Level First
Difference
EURO -2.931 -3.948** -11.131 -89.581**
IND -1.968 -2.597* -4.737 -10.361**
SIN -2.730 -2.781* -2.779 -8.563** UAE -1.622 -3.438** -0.532 -7.573*
UK 0.658 -3.186** -3.337 -11.339**
USA -1.927 -3.189** -14.615 -17.281**
Notes: The ADF critical values are based on Mckinnon. The optimal lag is chosen on the basis of Akaike Information Criterion (AIC). The null hypothesis for both ADF and Ng-Perron tests is a series has a unit root (non-stationary) while the null hypothesis of the KPSS test is it does not have unit root problem and it is stationary. The asterisk ** denotes the rejection of the null hypothesis at the 5% level of significance.
Cointegration analysis
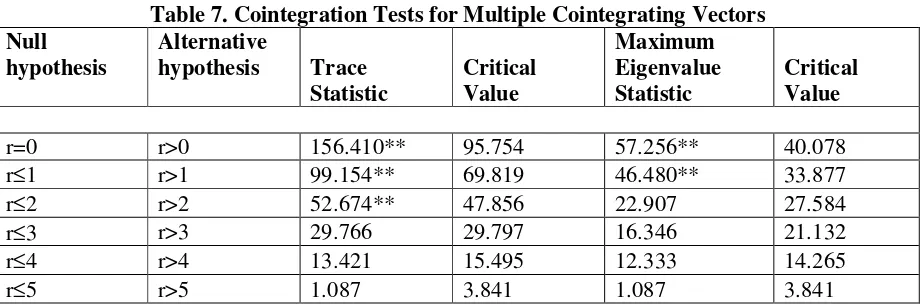
Given the variables are all of I(1), the next stage is to examine for the presence of cointegration. In this analysis, we use the Johansen and Juselius (1990) procedure of examining the existence of cointegration. Results of the cointegration procedure, using an optimal lag structure for the VAR, are reported in Table 7 for these six countries. The maximum eigenvaluestatistics suggest that there are two cointegrating vectors while the trace statistics show that there appear three cointegrating vectors for these countries. These results suggest that there is a common long-term trend which binds together all six countries.
Granger causality analysis
run relationship between outputs of the six countries studied. The results thus show that fluctuations in economic performance in the rest of the world did affect India in the long run.
Table 7. Cointegration Tests for Multiple Cointegrating Vectors Null
hypothesis
Alternative
hypothesis Trace Statistic
Critical Value
Maximum Eigenvalue Statistic
Critical Value
r=0 r>0 156.410** 95.754 57.256** 40.078 r≤1 r>1 99.154** 69.819 46.480** 33.877 r≤2 r>2 52.674** 47.856 22.907 27.584 r≤3 r>3 29.766 29.797 16.346 21.132 r≤4 r>4 13.421 15.495 12.333 14.265 r≤5 r>5 1.087 3.841 1.087 3.841
Notes:
** Significance at the 5% level.
[image:10.612.92.547.389.459.2]In the short run, the coefficient of Singapore output which is a proxy for ASEAN output is not statistically significant. However, the coefficients of all other countries are statistically significant indicating that fluctuations in the outputs of USA, UK, Eurozone and UAE did affect India’s output in the short-run as well.
Table 8. Causality Results for India based on Vector Error Correction Model Dependent
Variable
F-statistics ECT
(t-stat) ∆
∆∆
∆USA ∆∆∆∆UK ∆∆∆∆EURO ∆∆∆∆UAE ∆∆∆∆SIN ∆∆∆∆IND
∆ ∆∆
∆IND
18.511*** 34.598*** 2.350* 17.001*** 2.155 - -0.740*** (-7.493)
* Significance at the 10% level. *** Significance at the 1% level.
Variance decomposition analysis
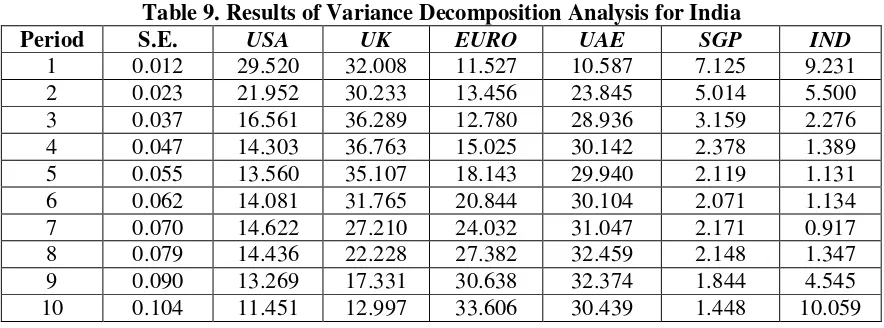
Variance decomposition analysis is based on Cholesky factorization with the following ordering, namely: USA, UK, EURO, UAE, SGP and IND, as noted earlier. The analysis is done up to 10-year horizon.
Table 9. Results of Variance Decomposition Analysis for India
Period S.E. USA UK EURO UAE SGP IND
1 0.012 29.520 32.008 11.527 10.587 7.125 9.231 2 0.023 21.952 30.233 13.456 23.845 5.014 5.500 3 0.037 16.561 36.289 12.780 28.936 3.159 2.276 4 0.047 14.303 36.763 15.025 30.142 2.378 1.389 5 0.055 13.560 35.107 18.143 29.940 2.119 1.131 6 0.062 14.081 31.765 20.844 30.104 2.071 1.134 7 0.070 14.622 27.210 24.032 31.047 2.171 0.917 8 0.079 14.436 22.228 27.382 32.459 2.148 1.347 9 0.090 13.269 17.331 30.638 32.374 1.844 4.545 10 0.104 11.451 12.997 33.606 30.439 1.448 10.059
5. Conclusions and Policy Recommendations
The article examined the impact of global economic fluctuations on India, whose trade and financial integration with rest of the world has been growing ever since Indian economy was liberalised with reforms in several sectors since the mid 1990s. Using theVAR methodology, the empirical study finds that in the long run shocks to the five countries chosen for investigation significantly impacted India’s output. The results are not surprising given that there is strong evidence India seems to be well integrated regionally and globally in both trade and finance with these countries.
The policy implication is that since there is every likelihood of the intensity of trade and financial integration growing stronger in the near future, it would be appropriate that India and its partners should strive towards achieving a high degree of synchronisation of their monetary and exchange rate policies, which would eventually minimise volatility in growth rates.
References
Asian Development Bank (2010): Key Indicators of Developing Asia and Pacific (Manila: Asian Development Bank).
Boorman, J. (2009): “The impact of financial crisis on Emerging Market Economies: The Transmission Mechanism, Policy Response and Lessons”, Discussion Draft (Washington, D.C: Emerging Markets Forum).
Boorman, J., J. Fajgenbaum, M. Bhaskaran, H. Alberto and D. Arnold (2010): “The New Resilience of Emerging Market Countries: Weathering Recent Crisis in the Global Economy”, Paper presented at the Regional Forum on the Impact of Global Economic and Financial Crisis, November (Manila: Asian Development Bank). Dua, P., N. Raje and S. Sahoo (2004): “Interest Rate Modeling and Forecasting in India”,
Goldstein, M. and D. Xiew (2009): “The Impact of Financial Crisis on Emerging Asia”, Working Paper No.09-11, Washington, D.C.: Peterson Institute of International Economics.
International Monetary Fund (2007): World Economic Outlook, April.
International Monetary Fund (2010): World Economic Outlook, October.
Johansen, S. and K. Juselius (1990): “Maximum likelihood estimation and inference on cointegration with applications to money demand”, Oxford Bulletin of Economics and Statistics, 52: 169-210.
Kawai, M. and T. Motonishi (2005): Macroeconomic Interdependence in East Asia: Empirical Evidence and Issues, Asian Economic Cooperation and Integration
(Manila: Asian Development Bank).
Ng, S. and P. Perron (2001): “Lag Length Selection and the Construction of Unit Root Tests with Good Size and Power”, Econometrica, 69: 1519-54.
Panagaria, A. (2008): India: The Emerging Giant (New York: Oxford University Press).
Ram Mohan, T.T (2009): “The Impact of the Crisis on the Indian Economy”, Economic and Political Weekly, XLIV(13), March 28, 2009, 107-14.
Subbarao, D. (2008): “The Global Financial Turmoil and Challenges for the Indian Economy”, Speech delivered at the Bankers' Club, Kolkata, December 10, 2008.
Subbarao, D. (2009a): “Impact of the Global Financial Crisis on India: Collateral Damage and Response”, Speech delivered at Tokyo, February 18, 2009.
Subbarao, D. (2009b): “Global Financial Crisis Questioning the Questions”, JRD Tata Memorial Lecture delivered at the Associated Chambers of Commerce and Industry of India, New Delhi on July 31, 2009.
Takagi, S. (2008): “Managing Macroeconomic Interdependence”, Chapter 5, Emerging Asian Regionalism (Manila: Asian Development Bank).
World Bank (2010): World Development Indicators (Washington,D.C: World Bank).