Munich Personal RePEc Archive
Short-term Dependence in Time Series
as an Index of Complexity: Example
from the SP-500 Index
Dominique, C-Rene and Rivera-Solis, Luis Eduardo
Laval University, Dowling College
1 March 2012
SHORT-TERM DEPENDENCE IN TIME SERIES AS AN INDEX OF COMPLEXITY:
EXAMPLE FROM THE S&P-500 INDEX
C-René Dominique* and Luis Rivera Solis**
* Professeur Titulaire d’économie appliqué (ret), Laval University, Canada. E-mail: [email protected]
** Professor of Finance, Townsend School of Business, Dowling College, New York. E-mail: [email protected].
ABSTRACT:
The capital market is a reflexive dynamical input/output construct whose output (time series) is usually assessed by an index of roughness known as Hurst’s exponent (H). Oddly enough, H has no theoretical foundation, but recently it has been found experi-mentally to vary from persistence (H > 1/2) or long-term dependence to anti-persistence (H < 1/2) or short-term dependence. This paper uses the thrown-offs of quadratic maps (modeled asymptotically) and singularity spectra of fractal sets to characterize H, the alternateness of dependence, and market crashes while proposing a simpler method of computing the correlation dimension than the Grassberger-Procaccia procedure.
KEY WORDS: Hurst Exponent, Persistence, Anti-persistence, Fractal Attractors, SDP, SDIC, Chaos, Inherent Noise, Market Crashes, Renyi’s Generalized Fractal Dimensions
1-INTRODUCTION
In response to the failure of the ordinary Brownian motion to characterize time series in economics and finance, Mandelbrot and van Ness (1968) introduced the stochastic motion known as the fractional Brownian motion (fBm). It is a special centered Gaussian field with stationary increments, vanishing at zero, indexed and characterized by the Hurst’s (1951) exponent, H (0, 1). In financial economics, H > 1/2 is taken to be an indicator of long-term depend-ence or persistdepend-ence in time series, i. e., the relative tendency of the time series to cluster in a given direction, while H < 1/2 is associated with short-term dependence, i. e., to regress to the mean. To account for changes in dependence, this analysis will posit Zt as the observed output of the stochastic process, the fBm’s as the inputs and the r’s as
pa-rameters characterizing changes in inputs (see Section 2.4)..
The Hurst exponent can only be determined experimentally because it has no theoretical foundation. However, in most cases, its computed values vary inexplicably with series’ lengths, with sampling intervals, and over time (Cut-land, et al., 1993; Kaplan and Jay Kuo, 1993; Greene and Fielitz, 1997; Alvarez-Ramirez, et al., 2008). This in itself is baffling enough, but as a consequence nonetheless, after close to 50 years of application, the question as to whether financial time series are persistent, anti-persistent or both cannot elicit a conclusive answer.
There have been some advances in recent times, however. Chief among them is the introduction of the so-called Mixed fractional Brownian motion (MfBm) (Zili, 2006; Thale, 2009; Dominique and Rivera, 2011, among others). Dominique and Rivera have used an MfBm (see definition in Section 2.4) to show that the S&P-500 Index, for ex-ample, is persistent over some segments and anti-persistent over others. But the reason for this alternateness is in need of reinforcement. To that effect, we are proposing a very efficient and simple approach which consists of link-ing the index to other modern concepts such as the geometry of ‘strange’ attractors, and the multifractal formalism.
to study the dimensional properties of the level sets of non-uniform and non-homogenous systems using either the Hausdorff dimension or topological entropy in the sense of Bowen; there, the H index, or equivalently the Hausdorff dimension (H), plays an important role in characterizing the singularity spectrum of time series. Then the paper will next use the clues thrown-off by the analysis of attractors and the features of singularity spectra to establish the H index as a reliable index of complexity, de-fanging thus the notion of anti-persistence as well as the cause of the alternateness of persistence and anti-persistence.
2- THE H INDEX AS A DISCREET FEATURE OF STRANGE ATTRACTORS
There is ample evidence that the evolution of both economic and financial time series is governed by strange attrac-tors (Invernizzi and Medio, 1991; Medio, 1992; Peters, 1991), but strangely enough, most studies of time series in these disciplines seem to omit that essential connection. This section will attempt to mitigate that omission. But for tractability and completeness, we first review a few basic concepts.
2-1 The Features of Strange Attractors
Let: g: E E be a diffeomorphism of a smooth Riemanian manifold E n; let t (.) be the flow, and U (B) be a
neighborhood of B E. If t (.) U (B) at time t 0 and t (.) B as t , then B is a compact hyperbolic
attrac-tor for g. Bowen has shown that the evolution of the Lebesque measure in U (B) converges to the Bowen-Ruelle-Sinai measure as it describes the orbit distribution of points in U (B), which are typical with respect to the Lebesque measure. The distribution is not uniform, however. There exist zero volume regions of high and low densities of visits by different orbits. This is made explicit immediately below.
B is a strange invariant set if it contains a countable subset of periodic orbits of large periods (denoted p), an
un-countable subset of non-periodic orbits ( np), and a dense orbit ( d). To simplify, these orbits are next labeled
“sta-ble”, “unsta“sta-ble”, and “dense”. Furthermore, these orbits reside in B which consists of a multitude of branched and interleaved surfaces or subsets that do intersect. Trajectories ( ), on the other hand, do not intersect, but may move from one branched subset to another as they circulate.
Stable orbits are tangent to the direction of contraction. Unstable orbits are tangent to the direction of stretching. And a dense orbit is defined as:
Definition 1: If C is a subset of B, C is said to be dense in B if for every point b B and a > 0, there is a point c
C such that b - c < .;
And:
Definition 2: In the Eckmann-Ruelle’ (1985) sense, if any two points y1, y2 U (B) at t 0 becomes exponentially
Thus, the presence of s, u, establishes that B is a hyperbolic invariant set; the presence of s, u and d establishes
that B is strange. If additionally there is SDIC, then B is chaotic. Moreover, due to the loss of energy, the volume of U (B) shrinks, turning B into a multifaceted “thin” set that comprises all these interleaved subsets of points of zero volume (reminiscent of a Cantor point-set), depending on parameter values. The sections following will show that the subsets of points of zero volume that are visited by depend on both the values of the parameters of g, and the number of equilibria at those parameter values. Put differently, parameter values represent different levels of reality.
To make this last assertion clearer, g is restricted to 3 (where stands for the real line) and rewritten as:
= f (y; a )
(1) + (y0) = {y E y = t (y0), t 0}, ,
- (y0) = {y E y = t (y0), t 0}
where the parameter a , + is a positive half trajectory or a stable orbit passing through y0; - is a negative
half-trajectory or an unstable orbit through y0, both defined by (1), such that = + -, and y0 is any point in U (.)..
To distinguish between conservative and dissipative systems, it must be emphasized that (1) is a dissipative systems characterized by volume contraction. That is, if all orbits that cross U (B) do so in an inward direction, then B is positively invariant and its divergence is:
(2) div (f ) = i=1 fi (.) / yi < 0, i = 1, 2, 3;
that is, div (f) is a strictly negative constant.
This implies that all orbits that begin in U (B) at time t will end up in some new image set of B (denoted (B)) at time t + under the transformation f. Integrating forward from all initial values in U (B) from t to t + yields:
(3) (.) = y (t + ) = y (t) + tt+ f (y (t)) d ,
where the integral is a vector with 3 components (fi).
Let V (t) be the volume of U (B) at time t, V (t + ) be the volume of (B) at t + , and let D be the determinant of the Jacobian matrix of the transformation (.), where,
(4) D = det (y (t)) / (y (t)) .
It can then be shown, after some extensive manipulation of which the reader is spared, that:
(5) V (t + ) =
D dy1 dy2 dy3,
where is the Jacobian matrix of f evaluated at y (t). After differentiating (5), we have:
(8) dV (t) / dt = lim 0 dV (t + ) / d =
=
div (f) dy1 dy2 dy3.
Since div (f) < 0, it follows that dV/dt = div (f). V < 0, as V is similar to a Lyapunov function.. Integrating, we have:
(8) V (t) = m e div(f) t , where m is a positive constant.
Obviously, volume shrinks to zero, and all orbits reside in B, the attractor. It should also be noted that the “thin” set in 3 is not a single point or a closed orbit. As remarked above, subsets of points of zero volume ( s, u, d) will
appear as the parameter a is varied. Additionally, in the social sciences, such as economics and finance, the attractor contains a subset of inherent noise, n, which cannot be filtered out since it is due to the incompleteness of
informa-tion sets of traders at the instant of exchange. The observed output of f (henceforth, Zt), as a reflexive dynamical
process, can be filtered for white noise and measurement errors, but the noisy subset n cannot. Obviously,
incom-plete information leaves room for false signaling or even price manipulation by big traders, which becomes patho-logical when the attractor becomes strange, as we will explain shortly. For the time being, however, let us say that all is not lost. As alluded to above, B is a collection of branched and interleaved zero volume subsets that are visited by different orbits depending on parameter values, but the impacts of n are restricted to specific values of the
parame-ter. The branched and interleaved attractor may also be written as =
0( (B)). To make this last assertion
constructive, we now turn to the quadratic map.
2.2 The H Exponent as a Measure of Complexity
Quadratic maps are well-studied prototypical strange attractors in (0, 1) (0, 1) that happen to characterize the
uni-versal law of growth. Ex hypothesi, their thrown-offs should effectively characterize H as well.
Suppose that the future size of a growing entity (yn+1) is a linear function of its actual size (yn). That is:
yn+1 = a yn, where a > 1 is a growth factor. This is obviously not a realistic growth model as nature forbids outcomes
such as yn by imposing an inverse relationship between the actual growth factor [a (1 –yn)] and the size of the
growing variable (yn). Substitution gives:
(9) yn+1 = f (y) = a (1- yn) yn , where a (0, 4), y (0, 1).
Experimental work carried by Los (2000) shows that H varies from 0.98 to almost zero over the span of a. For our purpose, however, the span of a can be divided into 3 specific zones:
I- 1 < a < [1 + (6)1/2 ] ( -20, -21, -22) f (.) is in a persistent regime (H = 0.92) or monofractality; II- [1 + [(6)1/2] < a < 1 + (8.0738)1/2] -2k, -3x2k, k = 2, 3, 4,… f (.) is anti-persistent or a multifractal ; III- [1 + (8.0738)1/2] < a 4 is the chaotic region according to Definition 2, f (.) is again persistent.
In general, at 1 < a 3, only fixed-point orbits of period 1 exist and are visited, but at exactly a = 3, the fixed point becomes marginally stable. At a = 3.14 or there about, + jumps to - until a = 3.23 where it jumps back to + again, producing two equilibria: y* = 0.500, and y* = 0.809….At that point, the orbit travels 0.309 in one direction, but another leave is added in the other direction. At a = 3.34, the orbit jumps to the unstable manifold again until a = 3.498561where 4 equilibria result; the orbit must now travel a distance equal to 0.874 – 0.383 = 0.491…. and more leaves are added. Clearly, the size of B has increased and continues on increasing until a = 3.84, but with a bust of persistence at a = 3.75due to the appearance of a stable orbit. Between 3 < a 3.569446, equilibrium points will be visited by orbits of periods 2k, k = 1, 2, 4, 8, etc. And 3.569446… < a 4, known as the “chaotic regime” (different from the chaotic region), there exist an infinity of equilibrium points to be visited; in fact, at a = 3.569446…, de-noted a , the motion of f (.) is aperiodic, comprising a Cantor point-set of infinitely many values of y that never re-peat. And within the chaotic regime, up to the period 3 window (according to Li and Yorke (1975)), there exist an infinite number of a values for which motion is stable and unstable. Within the period-3 window, there are 3 chaotic intervals followed by renewed period doubling, but orbits are of period 3x2k, k = 1, 2, 3,…. For example, just before reaching the period-3 window, intermittent period-3 pulses will be observed. Inside the window, there are 6 fixed-points by virtue of the up and down movements of the hills and valleys of the third iterate; 3 are stable and 3 are unstable. But once period-3 cycles appear, there will be cycles of all orders, some will be stable, others will not. Be-yond the period-3 window, but up to a = 4, there is SDIC; therefore, motion is chaotic in the sense of Definition 2. Even though orbits are mostly chaotic and unstable in that interval, there are however a few stable orbits depending on values of a. And at a = 4, there is a countable number of periodic cycles, an uncountable number of aperiodic ones, and a dense orbit.
What Los’ analysis reveals is that the process is anti-persistent in zone II, and persistent elsewhere. Using the Haus-dorff measure, Plate 1 reveals a similar story. The process is anti-persistent from the second bifurcation to the end of period-3 window; that is, over the interval: 3.498561… < a < 3.841499…. In that interval, variations of H with re-spect to a are reminiscent of a Weierstrass function, and this is precisely the region of multiple equilibria (stable and unstable) and where the process becomes more sensitive to the parameters (SDP). The presence of a greater number of equilibria that must be visited and the fact that the iterates of the map tend to migrate toward the Cantor point-set and other accumulation points, cause compression and stretching , thereby increasing not only the size of B but the level of complexity as well. Whereas in the interval 1 < a < 3.49…., H (or H) is persistent; over the interval 3.84…<
period-doubling. It is a phenomenon whereby more and more stable fixed-points ( +) lose their stability ( -) and bifurcate to more fixed-points ( +, -) that are now crowded in the same unit interval; this occurs over the intervals 3.49… < a
< 3.56…, and within the period-3 window. From a = 3.56… to a = 3.84…, another phenomenon occurs. It is re-ferred to as intermittency whereby a local bifurcation increases the size of the existing attractor, but preserving the locus of the previous one. The larger attractor may or may not be chaotic depending on the phase space prevailing
before the bifurcation. Examples of this are seen at a = 3.63, a = 3.75, a = 3.87, etc.
Plate 1:The Hausdorff Dimension vs Variations of the Tuning Coefficient a. The Persistence subset H [1, 1.5), the Anti-persistence subset H (1.5, 2].
In other words, as shown in Plate 1, H is anti-persistent in Zone II and persistent elsewhere. Then:
Assertion 1:Anti-persistence is a consequence of the conjunction of period doubling and intermittency (a. s.).
Assertion 2: As a stochastic process moves from persistence to anti-persistence, every element of the set of Renyi’ s (1970) generalized fractal dimensions undergo an increase in size (a. s.).
We will substantiate Assertion 2 in Section 4; in particular, we will show a general increase in the Hausdorff dimen-sions which measure how the attractor fills up space.
number of reasons. For example, due to the fact that chaotic and non-chaotic values of a are interwoven, giving rise to SDIC, to increased SDP, to an infinite number of unstable orbits, or due to the fact that the logistic map is not strictly self-similar. What is more compelling though is that an experiment carried out by Medio (1992) has shown that the addition of a small amount of noise suffices to make all values of computed trajectories in the whole chaotic regime spurious. This then confirms that n intersects other subsets at a lower level of reality. It also means that in
the capital market where the noise floor of the attractor is not empty, the accuracy of computed values in anti-persistence mode as well as statistical predictions thereof are questionable.
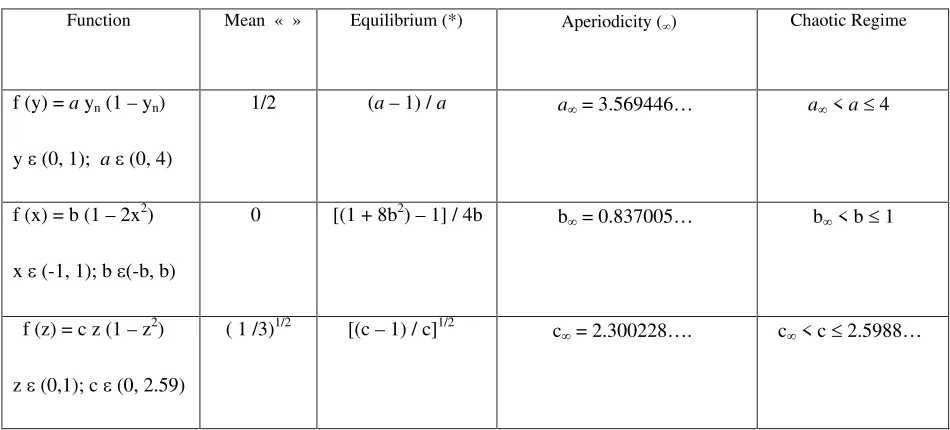
The clues thrown-off by the iterative construction of (9) are to be taken seriously, because they are generic. The only difference between (9) and other quadratic maps stems from the differences of interval values. Table 1 below exam-ines the logistic parabola in (9) and two other maps studied by Grassberger (1981). It can be seen that at the point of aperiodicity (in 1-D), the three maps have the same Hausdorff measure (H) (seebelow andAppendix 1). That is,
(10) dim H(f ((y)) = dim H ((f(x)) = dim H ((f(z)) = 0.5388…. 0.002,
2.3-The Centrality of the Hausdorff Dimension
In Appendix 1, to which the reader is referred, the Hausdorff dimension is shown to be not only a more efficient measure than either the topological or the box-counting dimensions, but also a more natural measure within the mul-tifractal formalism. To be more explicit: If du (b) exists (see A.1.3), then B = {b: the limit du (b) = } is the set for which the limit exists and is equal to , where a is the Lipshitz-Holder mass exponent; then there is a decomposition of B by level sets for which the limit does not exist. Therefore, the dimension spectrum is a function fu : (0, d),
given by fu ( ) = dim H(B ). Then the multifractal analysis of the measure u describes the size of the set B through
the behavior of fu. Hence, dim H(B ) is a natural measure characterizing the multifractal properties or quantifying the
non-uniformity of the multifractal spectrum.
As regards i) and ii) in Appendix 1, consider a cover u = {ui} for a given set X by open sets. For a > 0 and diam ui
, then it is shown in Warwick (2012) that dimH (X) = inf { : H (X) = 0}. Therefore, dimH satisfies both i) and ii).
It follows that dim H (B) is the appropriate measure for the set B whether in persistence or an-persistence mode. In
addition, it is a central element in the set of Renyi’s generalized fractal dimensions to which the next section is de-voted.
2.4- The Multifractal Spectrum
spatial distributions of singularities of multifractal measures. Naturally, the tendency is to just transfer it to financial series analyses (Lux, 1996; Lobato and Savin, 1998; Calvert and Fisher, 2002, Kesterner and Arneodo, 2003, among others) without however paying heed to the fact that the capital market is a reflexive construct that is neither glob-ally self-similar nor governed by a noise free attractor.
The singularity spectrum of a non-linear input/output process, generating an output Zt with fractal properties,
de-pends on input conditions. This then suggests that the appropriate process for financial analysis is the Mixed frac-tional Brownian motion (MfBm) (see, Zili, 2006; Maio, et al., 2008; Thale, 2009; Dominique and Rivera, 2011).:
Function Mean « » Equilibrium (*) Aperiodicity ( ) Chaotic Regime
f (y) = a yn (1 – yn)
y (0, 1); a (0, 4)
1/2 (a – 1) / a a = 3.569446… a < a 4
f (x) = b (1 – 2x2)
x (-1, 1); b (-b, b)
0 [(1 + 8b2) – 1] / 4b b = 0.837005… b < b 1
f (z) = c z (1 – z2)
z (0,1); c (0, 2.59)
( 1 /3)1/2 [(c – 1) / c]1/2 c = 2.300228…. c < c 2.5988…
Table 1: Three quadratic maps with the same properties over different intervals. Values indexed by mark the end of Period-Doubling.
Definition 3: Zt = in (ri XHi), where r , i n. and Hi (0,1), i n.
Zt is an observed combination of Gaussian processes (XHi), each with its own H index. XHi are the unobserved
Man-delbrot- van Ness (1968) inputs into Zt, arriving as “cars” or “trains” in the terminology of Sottinen (2003). Zt not
[image:9.612.71.546.230.445.2]3- THE DATA AND METHOD OF COMPUTATION OF RENYI’s DIMENSIONS
We use the grand Microsoft Excel Data set of closing prices of the S&P-500 Index, from January 3rd, 1950 to Febru-ary 28th, 2011, sampled at daily intervals, and expressed as an MfBm of Definition 3. The whole index was divided into 12 segments, but for the present purpose, it was convenient to consider 7 segments which were next de-trended using logarithmic differences and filtered for white noise. That is, 3 segments during which the index was persistent and 4 when the index was anti-persistent; their lengths vary from 29 to 211.
The analysis is done in two stages. In the first, we use the wavelet multi-resolution software of Trusoft International, the Benoit version, to determine the boundaries of the Hurst exponents (H) as well as the Hausdorff dimensions (D0
= dim H). In the second stage, D0 is used as the starting point in the determination of the generalized fractal
dimen-sions and the singularity spectra of each segment.
The Mandelbrot Method (MM) (see Appendix 2) is a simple iterative construction that asymptotically models strange attractors. It consists of an “initiator” (the unit interval) and a “generalized generator” ( ) with two intervals (ei), i (1, 2). The initiator is first divided into two bins with equal probability (pi). Next, the exponent q is assigned
to the probabilities, while the exponent is assigned to the support intervals.
Quadratic maps have the same structure, but different intervals. Hence, the sizes of generators vary with interval sizes. Experimentally, Schroeder (2009, 276) has found an interval size e1 = 0.4000 to be a good approximation of ei
for the logistic map. But using (A.2.1’’) in Appendix 2, e1 = 0.408903… which is equivalent to a generalized
genera-tor of = 2. 445564… instead of the experimental value of 2.5 approximated by Schroeder; again this is due to the fact that the maps are not exactly self-similar. Since the appropriate map of a given process may not be known in advance, one should appeal to (A.2.1’’) to yield the sizes of the generator and intervals from the Hausdorff dimen-sion obtained from the wavelet multi-resolution analysis. Once e1 is known, all the Renyi’ generalized fractal
dimen-sions, except of course for D1, can be computed using a handheld calculator. Next, from the Legendre Transform:
(q) = - d (q) / dq; df ( ) / d = q; f ( ) = q d / dq - (q), the multifractal spectrum can be constructed. Thus, the generality of D0 in this approach cannot be over-emphasized; it is valid for any set B as shown in (10).
4 – THE RESULTS
The results of the first stage are given in Table 2. It shows that the index fluctuated between persistence (1961-72, 1983-87, and 1998-02) and anti-persistence (1972-83 and from 2003-11) , but at no point the so-called “efficient market” value (H = 0.5) was observed.
reports the generalized dimensions in successive time intervals, drawn from the affine profile of the index. Later on, we will comment on the meaning of these dimensions and on how they may be converted into 3-D.
Period
Number of
observations
Hurst Exponent H Hausdorff Dimension H
1961-72 211 0.5220… 0.00321 1.4780
1972-80 211 0.2209… 0.0359 1.7791
1983-87 210 0.5590… 0.0501 1.4410
1998-02 210 0.6100… 0.0612 1.3900
2003-07 210 0.1101… 0.0310 1.8899
2007-08 29 0.2811… 0.0326 1.7189
2009-11 29 0.1430… 0.0339 1.8570
Table 2: Properties of Locally self-similar segments of the S&P-500 Index, sampled daily from January 1950 to February 2011.
The arrangement of Table 4 is different. The first 4 columns represent the state of anti-persistence. As shown, for the higher value of the Hausdorff dimensions, the spans of the singularity spectra are also larger, characterizing the state of anti-persistence. In the last 3 columns, Hausdorff dimensions are lower, and the spans are smaller, depicting the state of persistence. It can then be concluded that if: dim Hi > dim Hj, ( max i - min i) > ( max j - min j), then j is more
persistent than i. In other words, the lower is dimH, the smaller is the convex set of HGf , where HGf is the
hypog-raph of f ( ), defined as:
(11) HGf = {( , f) 2 f ( )}.
As the index jumps from persistence (H > 1/2) to anti-persistence (H < 1/2), both spans and maxima of multifractal spectra, which are equal to the Hausdorff dimensions, increase in accordance with Assertion 2.
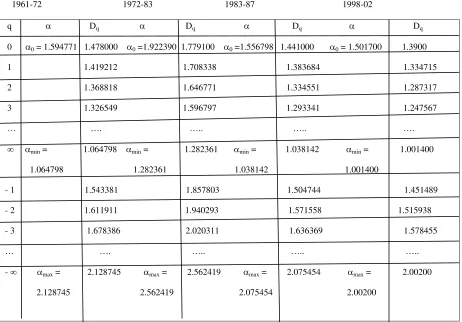
As shown in Table 3, at q = 0, the Hausdorff dimension, identified as D0 = dimHis recovered. As discussed in
Ap-pendix 1, D0 is robust and natural enough in the singularity spectrum to describe many different aspects of the
attrac-tor.
Some authors claim that D0 describes the geometry of the fractal set while others prefer to describe it as the
dimen-sion of the measure (u) which weighs all portions of the attractor equally. And there are those who describe it as a space filling measure. However defined, it is important to stress that it is a universal element in all singularity spectra of strange attractors.
The subset D (q < 0) ( or the negative Renyi’s dimensions) measures the degree of emptiness of empty subsets. They are
used mainly to analyze super samples in turbulence and in diffusion-limited aggregation (DLA); the latter addresses the motion of molecules in biological growth patterns which are beyond the scope of this study. The other subset D (q > 0) describes the densest part of the attractor. To wit:
D1 is a function of the entropy of the probabilities (pi), and an element of Claude Shannon’s formula. The entropy
and D1 describes the loss of information as a non-linear dynamic system, which may be chaotic, evolves in time.
From the function f ( ), df ( ) / d =1, hence D1 = f ( 1) (= 1) lies on the tangent of the f ( ) curve with slope = 1
through the origin. It may also describe the frequency with which orbits visit different part of the attractor.
1961-72 1972-83 1983-87 1998-02
q Dq Dq Dq Dq
0 0 = 1.594771 1.478000 0 =1.922390 1.779100 0 =1.556798 1.441000 0 = 1.501700 1.3900
1 1.419212 1.708338 1.383684 1.334715
2 1.368818 1.646771 1.334551 1.287317
3 1.326549 1.596797 1.293341 1.247567
… …. ….. ….. ….
min = 1.064798 min = 1.282361 min = 1.038142 min = 1.001400
1.064798 1.282361 1.038142 1.001400
- 1 1.543381 1.857803 1.504744 1.451489
- 2 1.611911 1.940293 1.571558 1.515938
- 3 1.678386 2.020311 1.636369 1.578455
… …. ….. ….. …..
- max = 2.128745 max = 2.562419 max = 2.075454 max = 2.00200
2.128745 2.562419 2.075454 2.00200
[image:13.612.85.547.73.395.2]2003-07 2007-08 2009-11
q Dq Dq Dq
0 0 = 2.041360 1.888900 0 = 1.856594 1.718900 0 = 2.005709 1.857000
1 1.814900 1.650632 1.783247
2 1.750450 1.592015 1.719921
3 1.696224 1.542697 1.666641
…. …. …. …..
min = 1.360630 1.360630 min = 1.237478 1.237478 min = 1.336900 1.336900
- 1 1.971447 1.793009 1.937063
- 2 2.060801 1.874276 2.024859
- 3 2.146308 1.952043 2.108875
…. ….. ….. …..
- max = 2.722090 2.722090 max = 2.475710 2.475714 max = 2.674614 2.674714
Table 3 continued.
Period 2003-07 2009-11 1972-80 2007-08 1961-72 1983-87 1998-02
dim H 1.8899… 1.8570… 1.7791… 1.7180… 1.4780… 1.4410… 1.3900…
Spectrum 1.361460 1.337714 1.280058 1.238232 1.063947 1.037312 1.000600
Span
ANTI-PERSISTENCE PERSISTENCE
Table 4:The impact of persistence on the singularity spectrum of the S&P-500 Index, 1950-2011.
D2 is determined by the correlation function of the fractal set; that is, the probability of finding a given member of
ness in a set if the number of points is sufficiently large, evenly distributed, and if the generating mechanism is not too complex and free from noise (De Coster and Mitchell, 1991). The main difference between the value of D2 in
Table3 and the Grassberger-Procaccia measure is that in the latter one must guess the dimension of the unknown attractor and seek convergence on some embedding dimension. This then introduces an additional variable in the process. For example, Medio (1992, 209- 210) uses that procedure on slightly modified logistic map and arrives at a value of approximately 2.15. If we were to compare that value with the D2 found in Table 3, when the Hausdorff
dimension was 1.3900…, we would get D2 = 1+ 1.287319 = 2.28…. To take another example, consider the finding
of Peters (1991). He used the Grassberger and Procaccia procedure to compute D2 of the S&P-500 Index, sampled
monthly from January 1980 to July 1989, and found a value of 2.33. In Table 3, our value of D2 from 1983-87 is D2
= 1 + 1.334551= 2.334551…. In fact, 3 seem to be a limiting value for strange attractors (see Section 2.1). Experi-mental findings consistently indicate to that effect that chaotic attractors have non-integer dimensions 2 < D < 3, regardless of the size of the phase space (for more on this, see Invernizzi and Medio, 1991; Medio, 1992, 130-133).
Finally, D measures the densest part of the attractor, while D- describes the sparsest part. Thus, the set of
general-ized dimensions is very useful for quantifying the non-uniformity of the fractal set and for characterizing its multi-fractal properties at the same time. However, the fact that some of our values are carried out to six decimal places is to recall their asymptotic characters and not a claim to precision. In general, the goal of dimension estimation is a qualitative assessment to distinguish chaos from random determinism. Hence, a robust and simple estimate of dimen-sions is more useful than a precise estimate.
5- CONCLUSIONS
The MfBm process of Definition 3 reveals that the S&P-500 Index exhibits short and long-term dependence. While the thrown-offs of quadratic maps indicate that anti-persistence results from intermittence and the period-doubling scenarios. As a consequence, the sizes of all the elements of the set of Renyi’s generalized fractal dimensions, which through the Legendre Transform yield the singularity spectrum of a fractal set, undergo an increase. The compelling conclusion is that anti-persistence increases the hypograph of the singularity spectrum of a multifractal. This is dem-onstrated in Tables 3 and 4.
Effectively, a significant fall in H occurred in mid-1972. That fall must be seen in retrospect as a precursory sign of the market crash of 1972-73. The reason seems to have been a change in investors’ behavior following the abrogation of the Bretton Woods Agreements and the oil embargo of 1973. During the period of 1972-80, the index remained in flicker noise territory until the crash of 1981-82. It did recover by mid-1997 because the IT bubble was ongoing, but imbalances continued to accumulate until the crash came in 2000-01 and beyond. In June 2002, the index became even more anti-persistent and remained there until the 2007-08 crash. Table 4 shows that the index had not emerged from anti-persistence by February 2011, which is the last period for which we have data. These developments show that almost surely, anti-persistence is a consequence of investors’ behavior as their expectations collapse (see Table 2).
As indicated at the outset, theorists have found that the computed values of the H exponent were varying with series lengths, with sampling intervals, and over time. Plate 1 above explains these variations.
The attempt to characterize anti-persistence has thrown off a number of additional conclusions. First, the noisy subset of the attractor is due to incomplete information such as uncertainty, false signaling or price manipulations (think of the rate of interest). As such, the noisy subset seems to reflect a double half-Heisenberg’s dilemma. Theoreticians would like to know “true” prices which are not knowable except in perfectly competitive settings, while practitioners would like to eliminate the noisy subset which is not doable. One way to make this dilemma mitigable is an increased surveillance of the Hausdorff dimensions of markets in non perfect competitive settings. That is, the minute dimH>
1.5, steps should be taken to restore participants’ confidence in the market.
Man-made constructs are not globally self-similar. The impact of noise is pervasive in anti-persistence mode. The second thrown-off indicates that the best that can be done to mitigate such constraints is a greater use of fBm’s con-jointly with the wavelet multi-resolution, while emphasizing the qualitative aspects of measures from the multifractal formalism.
Finally, the application of the Mandelbrot Method makes it simpler to estimate the correlation dimension of a fractal set than does the Grassberger-Procaccia procedure (see Section 4.1).
APPENDIX 1
According to Warwick’s ac.uk (2012) lecture on Fractals and Dimension Theory, the Hausdorff dimension is a de-scription of the geometry of a fractal set. If B is a fractal set whose dimension is sought, then let C (e, C) = [c1, c2,,
…,cu] be a finite covering of B into sets whose diameters are less than e. Then B Ui ci and the dimension of its set
satisfy some I = (ci). If the function:
(A.1.1) f (B, D, e) = inf c( B, e) i iD,
where the infimum (over all coverings satisfying I < e) defines a measure for the set B. Then f (B, D, e) decreases
so that DH = inf [ D: f (B, D, e)] = 0 ( DHis henceforth denoted, (dim H).
For a greater ease of exposition, one might wish to define a probability u on B and consider upper and lower dimen-sions of u as measurable functions du and du-, where
(A.1.3) du (b) = lim supe 0 log [ ball (b, e)] / log e = d , b B, then dimH (u) = d; and
du-(b) = lim infe 0 log u [ ball (b, e)] / log e d, b B, then dimH (u) d,
where ball (b, e) is a ball of radius e > 0 about b.
Moreover, if a closed bounded set B n is a manifold, the value of its dimension must satisfy the Warwick criteria. That is, its dimension must be:
i) either an integer or a non-integer; and
ii) points and countable unions of points of zero volume must have zero dimension. It can then be seen that the topological dimension (dim T), for example, fails on both criteria since it is always an
integer, giving 0 for the Cantor set, which is not true. By a similar argument, the Box-counting measure fails on ii), whereas dim H(B) satisfies both i) and ii), and dim H (B) dim Box (B). ,
APPENDIX 2
The unit interval, the initiator, is divided into two bins of equal probabilities, pi (i = 1, 2) with exponent q. The
gen-erator has intervals ei to which the exponent is assigned. Then the partition function can be written as:
(A.2.1) I piq ei = 1, i = 1, 2.
Positing e1 = ( -1), e2 = ( -1) 2, and (q) = (1 – q) Dq, where Dq = dim H(.) at a given q (Schroeder, 2009; Dominique
and Rivera, 2011). It can then be shown that:
(A.2.1’) dim H (.) = D0 = log [(5)1/2 – 1] / log e1,
and
(A.2.1’’) e1 = log-1 [(5)1/2 – 1 / D0 ].
The Renyi’s (1970) generalized dimensions of order q are given by:
(A,2.2) / (1 – q) = Dq = log lim e1 0 {[(1 + 4 (2) q )1/2 – 1]} / (1 – q) log e1, for q 1.
For q = 1, D and D- , we have:
(A.2.3) D1 = 2 log 2/ 12 log (1/ei)
D lim q , e1 0 = (- 1/ log2e1)
D- lim q - , e2 0 = ( - 1/ log2 e2) .
REFERENCES
Arneodo, A., De Coster, N. & Roux, S. G. (2000). A wavelet-based method for multifractal image analysis. European Physical Journal B, 15, 567-600.
Arneodo, A. et al. (1995). The thermodynamics of fractals revisited with wavelets. Physica A, 213, 232-275. Calvert, Laurent. E. & Fisher, Adlai, J. (2002). Multifractal in asset returns: theory and evidence. Review of Econom-ics and StatistEconom-ics, 84, 381-406.
Cutland, N. J. et al. (1995). Stock price returns and the Joseph effect. A fractal version of the Black-Scholes model.
Progress in Probability, 36, 327-351.
De Coster, G. P.. & Mitchell, D. (1991). The efficiency of the correlation dimension technique in detecting determin-ism in small samples. Journal of Statistical Computation and Simulation. 39, 221-229.
Dominique, C-R. & Rivera, S L. (2011). Mixed fractional Brownian motion, short and long-term dependence and economic conditions: The case of the S&P-500 Index. International Business and Management, 3, 1-6.
Frish, U. (1995). Turbulence. Cambridge University Press: Cambridge.
Eckmann, J. P. & Ruelle, D. (1985). Ergotic theory of chaos and strange attractors. Review of Modern Physics, 57, 617-656.
Grassberger, Peter (1981). On the Hausdorff dimension of fractal attractors. Journal of Statistical Physics, 26, 173-179.
Grassberger, Peter & Procaccia, I. (1983). Characterization of strange attractors. Physical Review Letters, 50, 346-349.
Greene, M. T. & Fielitz, B. D., (1977). Long-term dependence in common stock returns. Journal ofFinancial Eco-nomics, 4, 339-349
Hurst, E. et al. (1951). Long-term storage: An Engineering study. Transactions of the American Society of Civil Engi-neers, 116, 770-790.
Invernizzi, S. & Medio, A. (1991). On lags and chaos in economic dynamic models. Journal of Mathematical Eco-nomics. 20, 521-550.
Kaplan, L. M. & Jay Kuo, C. C., (1993). Fractal estimation from noisy data via discrete fractional Gaussian noise and the Haar Basis. IEEE Transactions, 41, 3554-3562.
Kesterner, P. & Arneodo, A. (2003). Three-dimensional wavelet-based multifractal method: The need for revisiting the multifractal description of turbulence dissipation data. Physical Review Letters, 91, 194501.
Li, Y. L & Yorke, A. (1975). Period three implies chaos. American Mathematical Monthly, 82, 985-992.
Lobato, I. N.,& Savin, N. E. (1998). Real and spurious long-memory properties of stock market data. Journal of Business and Economic Statistics, 16, 261-268.
Los, Cornelis, A. (2000). Visualization of chaos for finance majors. Working Paper 00-7, School of Economics, Adelaide Univer-sity.
Lux, T. (1996). Long-term stochastic dependence in financial prices: evidence from the German stock market. Applied Econom-ics Letters, 3, 701-706.
Maio, Y. , Ren, W. & Ren, Z. (2008). On the fractional mixed fractional Brownian motion. Applied Mathematical. Science, 35, 1729-1738.
Mandelbrot, B. & van Ness, J., W. (1968). Fractional Brownian motions, fractional noises and applications. SIAM Review, 10, 422-437.
Medio, Alfredo (1992). Chaotic dynamics: Theory and applications to economics. Cambridge University Press: Cambridge, uk.
Peters, Edgar (1991). A chaotic attractor for the S&P-500. Financial Analyst Journal, March/April.
Renyi, A. (1970). Probability Theory. North-Holland: Amsterdam.
Schroeder, Manfred (2009). Fractals, Chaos, Power Laws, Dover Pub., Inc.: New York.
Sottinen, T. (2003). Fractional Brownian motion in finance and queuing. (Doctoral dissertation, University of Hel-sinki, Finland, 2003).
Thale, C. (2009). Further remarks on mixed fractional Brownian motion. Applied Mathematical Sciences, 3, 1-17. Warwick. ac.uk (2012). Lectures on fractals and dimension theory. Homepages.warwick.ac.uk/mas dbl/dimension-total.pdf.
Zili, M. (2006). On the mixed fractional Brownian motion. Journal of Applied Mathematics and Stochastic Analy-ses, 2006, 1-9.