Munich Personal RePEc Archive
Structural convergence among selected
European countries. Multidimensional
analysis
Olczyk, Magdalena and Lechman, Ewa
Gdańsk University of Technology
2011
Online at
https://mpra.ub.uni-muenchen.de/33656/
Ewa Lechman1
Magdalena Olczyk2
Structural convergence among selected European countries.
Multidimensional analysis.
Abstract
The main aim of the paper to test for structural convergence among arbitrary selected European countries. The authors choose four transition economies: Poland, Czech Republic, Hungary and Slovak Republic which are widely recognized as structurally similar economies. All four countries` economy structures are consequently compared with the structure of German economy – here selected as the reference country. The authors want to find out whether it is possible to confirm the hypothesis about the structural convergence between the four selected economies and Germany. The data sample covers the period of 2000-2007. The empirical part of analysis bases on 18 different indicators connected with the economy structure. To verify the hypothesis the authors apply multidimensional taxonomy methods.
Introduction.
The Polish economy is subject to more than 20 years continuous process of
transformation, which in the opinion of many economists is still ongoing. Inherent in this
process are structural changes in the economy. Therefore, knowledge of the mechanism, the
direction and importance of structural changes in the transformations of the Polish economy
in enhancing economic growth and development, has in according to the authors the
fundamental importance for shaping economic policy. Structural change is not only
indispensable element accompanying the process of transformation of the Polish economy,
but also an element of the adjustment of our economy to the requirements of the European
Union.
On his way to full integration with the European Union and particularly in the context
of the planned entry into the euro zone, Poland has to go through the difficult process of
convergence in inflation rates, budget deficits and exchange rate. But more importantly is that
these processes are inevitably accompanied by changes in the real sector. The process of
integration of the Polish economy with the European Union is inevitably associated with
1
Ph.D., Faculty of Management and Economics, Gdansk University of Technology
2
major structural changes in consumption, investment, foreign trade, but mainly in the
production of goods and services. Therefore, today it is important to attempt to answer the
question, whether the process of catching-up to the EU15 by the new EU countries such as
Poland, Hungary, Slovakia, the Czech Republic is accompanied by processes of convergence
or divergence in the structural sphere of production of goods and services. In this context, the
purpose of this article is to identify the direction and intensity of processes of structural
convergence or divergence (both inter-sectoral and inter-industry convergence) between
selected transforming countries of UE 27 and old countries of the EU-15.
1. Structural changes in economics- definition problems.
The crucial question is what processes in the economy can be called the structural
changes and what does not.
The concept of "structural changes" is one of those concepts in economics that are
repeatedly used but ambiguously defined. According to Silva (2008) in the economic
literature, there are at least nine well-known, but differently understood connotation of the
term "structural changes". Four of them dominate in economic literature.
Firstly, this term refers to changes in economic structure, understood as a change in
the distribution of production activity in the economy, in particular changes in the distribution
of production factors in different sectors, employment, economic regions, types of goods and
services produced (Machlup 1991). An example of such understanding of the structural
change’s definition can be the definition created by Jackson (Jackson et al, 1990), who
understands structural changes as “temporal changes in interactions among economic sector”.
Secondly, equally often structural changes are considered as changes in the meaning of
components / constituents (which like consumption, investment, export, import) creating
aggregate economic indicators (such as gross domestic product) (Ishikawa (1987)). An
example of such an understanding of structural changes can be the definition proposed of
M.SyrquinHe defines structural changes in economics as ”a long-term persistent changes in
the composition of an aggregate”(Syrquin 2010).
Thirdly, it should also pay attention to the use of the term "structural changes"
understood as a composition that is difficult to change and are often treated as a constant
phenomenon in many econometric models.
Fourthly, last dominant approach to defining the structural changes focuses on
simultaneously in institutions. Especially Nelson treats “institutions as an integral part of any
structural changes in the economy” (Nelson 2005).
The above-listed the most common ways of defining the structural changes in the
economic literature shows how different and how widely is the term of structural changes
understood. The multi aspects of the concept of "structural changes" indicate the connotation
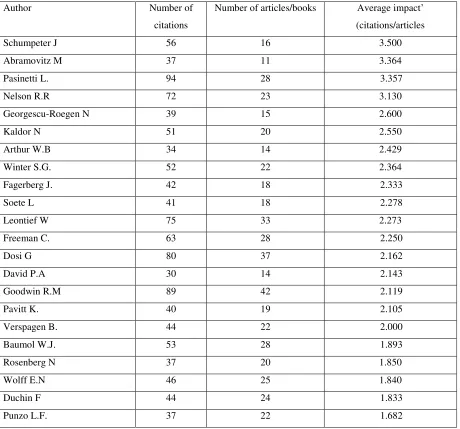
to the other economic categories. The bibliometric analysis conducted by EG Silva (2008)
shows that the most popular publication related to structural changes in the economy are
related to concepts of the development, technological change and innovation, convergence
and growth, foreign trade, employment, migration, and growth of industrial production (see
[image:4.595.73.533.335.764.2]table1 and table 2).
TABLE 1.
The most cited authors in the literature of structural change (ordered by average impact)
Author Number of
citations
Number of articles/books Average impact’
(citations/articles
Schumpeter J 56 16 3.500
Abramovitz M 37 11 3.364
Pasinetti L. 94 28 3.357
Nelson R.R 72 23 3.130
Georgescu-Roegen N 39 15 2.600
Kaldor N 51 20 2.550
Arthur W.B 34 14 2.429
Winter S.G. 52 22 2.364
Fagerberg J. 42 18 2.333
Soete L 41 18 2.278
Leontief W 75 33 2.273
Freeman C. 63 28 2.250
Dosi G 80 37 2.162
David P.A 30 14 2.143
Goodwin R.M 89 42 2.119
Pavitt K. 40 19 2.105
Verspagen B. 44 22 2.000
Baumol W.J. 53 28 1.893
Rosenberg N 37 20 1.850
Wolff E.N 46 25 1.840
Duchin F 44 24 1.833
Dum´enil G 32 25 1.280
Orsenigo L. 30 24 1.250
Eliasson G 36 31 1.161
Source: E.G. Silva, A.A Teixeira (2008): Survey structural change: seminal contributions and a bibliometric
account. Structural Change and Economic Dynamics pp.276.
Silva analyses citation and co-authoring of papers published in the journal “ Structural
Change and Economic Dynamics” and all abstracts and articles on structural change
analysis published over 40 years in the economic journals (in the Econlit database). The
analysis of table 1 with the most cited authors allows to conclude that in economic literature
dominate a Schupeterian, neo-Schumpeterian and evolutionary approaches to study structural
changes. In the top 10 most cited authors, the first place goes to J. Schupeter, then three
authors R.Nelson, N. Georgescu-Roegen, S. Winter represent the group of evolutionary
economists, the next three C.Freeman, J.Fragerberg, L.Soete can be classified as
new-Schupeterians and the last three authors N.Kaldor, L.Passinetii, M.Abramowitz are the
economists of the Post-Keynesians school.
The analysis of table 2 with the most cited studies in the literature of structural changes
indicates the most popular approach to the analysis of economic changes. Among papers
listed below, the publications of three authors i.e L.Pasinetti, G.Dosi, J. Schumpeter occur
most frequently. L. Pasinetti developed the theory of structural change in conjunction with
economic growth, G. Dosi and J. Schumpeter in turn focus on structural changes related to
technical progress and innovation. Detailed studies suggest that convergence and growth are
still most often associated with the analysis of structural changes, although this approach is
slowly losing ground to study structural changes in the context of technical change and
innovation. In the 1980's 27.6% of all analyzed publications on structural changes related to
the convergence and growth, and in 2000's it was only 18.0%. At the same time two other
topics have grown in popularity i.e. technical changes and innovation (an increase from 6.9 %
TABLE 2.
The most cited studies in the literature of structural changes
Author(s) Date Title Number of
citations Pasinetti L 1981 Structural Change and Economic Growth. A Theoretical
Essay on the Dynamics of the Wealth of Nations
27
Nelson R. 1982 An Evolutionary Theory of Economic Change 23 Pasinetti L 1993 Structural economic dynamics; A Theory of the
Consequences of Human Learning
17
Georgescu-Roegen
1971 The Entropy Law and the Economic Process 16
Schumpeter J.A 1934 Theory of Economic Development 16
Smith A. 1776 An Inquiry into the Nature and Causes of the Wealth of Nations
16
Sraffa P 1960 Production of Commodities by Means of Commodities 16 Arthur W.B. 1989 Competing technologies, increasing returns, and lock-in
by historical events
14
Goodwin R.M. 1967 A growth cycle 14
Keynes J.M 1936 The general theory of employment, interest and money 13
Dosi, G 1988 Sources, Procedures and Micro-economic Effects of Innovation 12
Marx K. 1867 Das Kapital 12
Dosi G 1982 Technological paradigms and technological trajectories 11
Arrow K.J. 1962 The economic implications of learning by doing 11
David P 1985 Clio and the economics of QWERTY 10
Baumol W.J 1967 Macroeconomics of unbalanced growth: the anatomy of urban crisis 10
Freeman C. and Perez C 1988 Structural crisis of adjustment: business cycles and investment behaviour 10
Leontief W 1941 The structure of the American economy, 1919–1929 9
Rosenberg N 1982 Inside the Black Box: Technology and Economics 9
Freeman, C. and Soete, L 1997 The Economics of Industrial Innovation 9
Kaldor N 1966 Causes of the slow rate of economic growth in the UnitedKingdom 9
Ricardo D. 1817 The Principles of Political Economy and Taxation 9
Schumpeter J.A 1942 Capitalism, Socialism and Democracy 9
Source: Source: E.G. Silva, A.A Teixeira (2008): Survey structural change: seminal contributions and a
bibliometric account. Structural Change and Economic Dynamics pp.277.
Taking into account the purpose of this article the authors focus on the structural
changes associated with the convergence process. Recently in the economic literature appears
a new notion which describes the mutually overlapping processes of convergence and
structural changes in the economy, known as “the structural convergence”
2. Structural convergence.
By convergence we mean the process of equalization of economic variables between
convergence, understood as a process of equalization of nominal economic variables and real
convergence, defined as the tendency to equalize the real economic variables. In addition, the
literature distinguishes the concept of sigma convergence ( process of decreased dispersion of
analyzed variables among different countries over time) and beta convergence (process of
approaching analyzed variables to the one point).
In the global economy both the processes of convergence and divergence are observed.
In studies of convergence, the most often they relate to real convergence, measured by GDP
per capita in purchasing power parity. In the last decade across the world economy strong
divergence trends are observed i.e. in 100 countries (covering 90% of the world's population)
the income gap increases. In turn, within countries, members of integration groups, the
process of decreased dispersion of the level of income between countries is noticed
(Matkowski Z.,Próchniak M. (2006). It follows that integration fosters convergence, and that
at least three reasons. Firstly, in the integration group poorer countries are characterized by
higher productivity of capital, which allows these countries to grow faster than rich countries.
Secondly, an intensive process of technological catch-up allows poor countries to decreases a
gap to the leaders countries. And thirdly, the accession country to the integration group is
associated with the intensification of foreign trade turnover between the two sides, and its
benefits flow primarily to the acceding country. All this fosters convergence among members
of the integration group. The essential question is whether among the countries (partners of
integration groupings) real convergence is accompanied by the phenomenon of structural
convergence.
Structural convergence can be viewed at two levels, i.e. as an inter-sectoral
convergence and inter-industry convergence. Sector is defined as the most aggregated
division of the national economy (agriculture, industry, services), while the industry is less
aggregated part of the economy (such as mechanical equipment and leather goods).
As a precursor of theoretical research on inter-sectoral convergence can be
considered Fourastié (Fourastié 1949) and his economic theory known as the three sector
hypothesis. He divides the whole economy into three sectors i.e. extraction of raw materials
(primary), manufacturing (secondary), and services (tertiary). Moreover, he believes that each
economy on its growth path will change the sector, on which will be based. In countries with
low national income, economic activity will focus on the production of raw materials, in the
middle stage of development of the country on manufacturing, in turn, when the country
reaches the highest level of development will probably be a service economy. Three sector
characterized by a similar inter-sectoral structure. Therefore, the structure of sectors in
countries with lower level of development should converge to the structure of countries with
higher levels of development.
Additional arguments for the occurrence of inter-sectoral convergence provides
Kuznets. In his research he finds a negative correlation between the share of the agriculture
sector and the income per capita, simultaneously finding a positive correlation between the
shares of the other two sectors and income per capita (Kuznets, 1972). Of course, the process
of structural convergence between the countries will never be completed. A certain degree of
structural differentiation between countries will always present due to differences in: size of
country, factor endowments, culture or in differences in institutional framework (Chenery,
1960). Also, with increasing degree of integration between the economies appear the
processes of divergence. The more developed countries are, the more specialized they
become, the more structural divergence process will be present between them (Wacziarg
2004).
In turn, few analyses of inter-industry convergence don’t show clearly the strength
and direction of this phenomenon among economies. Economic theories (both traditional and
modern) rather points a number of conditions that one side should lead to inter-industry
convergence, on the other hand, indicate the conditions contributing to the inter-industry
divergence. It appears that, the formed structure of industries in each country largely depends
on individual characteristics of particular industries, as well as the individual characteristics of
the economy. It is essential for inter-industry structure, if in particular industries exist
differences in productivity, externalities, economies of scale or if the analyzed economy is
large, have non-tariff barriers or high mobility of workers. Based on economic theories N.
Palan, C. Schmiedeberg identifies the following driving forces of inter-industry convergence
and divergence. The most important convergence determinants be them are ”:
• cost-differential in production between core and periphery (i.e. high wages and rents in the center) letting firms spread to the periphery at very low costs of trade
• increases in labor productivity in lagging countries, i.e. technological catch-up, imitation of new techniques, combined with the slow-down of increase in labor productivity in the
leading countries
• outsourcing of agricultural and labor-intensive production in the manufacturing sector from Southern Europe to other countries, i.e. increase in trade with low-wage countries (leading
• convergence in demand structures leading to convergence in production, especially in the service sector
• increasing demand for non-standardized products, customized products leading to less specialization and concentration than under mass production
• structural funds for lagging countries by the EU fostering firm localization in the periphery”
In turn, structural’s divergence determinants are”:
technological gap (differences in productivity), implying comparative advantages of
advanced countries in high tech industries.
externalities (technological and pecuniary) and input-output-linkages, leading to
concentration of production at the center
high spatial concentration of one specific input factor (natural resources, special skills)
different industrialization and/or tertiarization patterns
economies of scale: in large countries the market area is larger and firms can exploit
economies of scale better than in smaller countries.
hub effect, i.e. lower transport costs for economic centers than for peripheries
home market effects, i.e. more sales in big markets where demand is large.
economic integration, leading to lower transaction costs and better possibilities to exploit
economies of scale
inter-industry trade caused by economic “ (Palan, Schmiedeberg, 2010).
Empirical studies on inter-industry convergence point to the dominance of the processes of
specialization and concentration, which mainly contribute to the structural divergence among
the industries. However, among the countries of the European Union, where we come to the
increased technological catching-up process between the EU15 and other EU countries, one
can expect structural convergence within the medium-technology industries. In turn, within
the high tech industries, capital intensive as well as within the services will be dominated by
the phenomenon of divergence.
3. Structural convergence among selected European countries – quantitative analysis.
In the final section, authors verify the hypothesis about existing structural convergence
among selected European countries. The main study concentrates on analyzing the case
The authors chose the mentioned countries, relying on the assumption on general
similarities of their national economies. As it is widely know solely countries with the
recognized similar economies shall be compared. The four selected economies belong to the
so called transition economies, and all of them are undergoing permanent structural changes
since 1990s. The structural changes usually are noticed in the main economy sectors. As
mentioned in the article of Giovanni Andrea Cornia “Structural divergence in economies in
transition”3, the four countries belong to the group of countries depended on the export of
manufactured goods. As for that the authors` choice is fully justifiable.
The main aim of the analysis run is to learn about the structural adjustments of the
cited economies to the arbitrary selected European country. In the case author have decided to
chose Germany4 as the reference country, meaning the one to which the comparisons will be
completed.
The analysis covers the time period of 2000-2007. For the years 2008-2010 some
essential lacks in data are noted disabling to complete the study. All statistical data is drawn
from the OECD STAN Database for Structural Analysis and OECD STAN Bilateral Trade.
The authors have arbitrary decided to chose the following indicators to verify the
hypothesis about structural convergence, these are:
1) Value added in selected sectors as share of total value added generated in a given
economy,
2) Value added per one person employed in selected sectors of national economy,
3) Share of persons employed in selected sectors to total employment,
4) Share of export value in selected sectors to total export value in a given economy.
There have been made a general division on three widely accepted economy sectors:
agriculture, manufacturing and services. Additionally the sector of low technology
manufacturing was selected for the analysis. In the case of export values, authors have also
chosen – apart from the sectors mentioned above – export value in high technology
manufacturing, medium-high technology manufacturing, medium-low technology
manufacturing sectors. The full data set covers 18 different indicators5.
The main aim of the following section is to check the process of structural
convergence of Poland’s, Czech’s, Hungarian’s and Slovak’s economy with the Germany
3
Full text of the article is available on
http://www.developmentandtransition.net/Article.35+M5fb9c4aa2e3.0.html.
4
Authors do not claim that Germany is the only one correctly chosen reference country. However, having in mind, that Germany is rather treated as a typical European Union country, and at a time highly developed, authors have decided Germany to be the reference country.
5
economy, taking into account preselected indicators. the authors want to verify whether the
structure of Polish, Czech, Hungarian and Slovak economy is getting more and more similar
to the structure of the German economy.
For the hypothesis verification the authors apply the multidimensional analysis using
basic taxonomy methods. The authors calculate the Euclidean metric in 18-dimensional6
Euclidean space. As different indicators are expressed in different units, all data was
standardized. As the result we obtain the so called distance matrix, which let us to know about
the relative differences – also understood as inequalities – among objects (countries). The
methodology is easily applied when a multidimensionality of analysis is required. It let us to
embrace any number of different indicator which are considered to be deceive for the
analysis outcomes.
The analysis results have been divided into two parts. In the first one the authors check
on the structural convergence on the most aggregate level, while in the second part we check
on the structural convergence in particular areas.
a) Structural convergence on the aggregate level.
As it was stated before, the authors have chosen 18 structural indicators for Poland,
Czech Republic, Hungary, Slovakia and Germany. We apply the taxonomy methodology to
get the results on structural differences among the mentioned economies in the year 2000 and
then in 2007.
The indicators included in the analysis are following: VA7 in agriculture as share of
total VA, VA in manufacturing as share of total VA, VA in services as share of total VA, VA
in low technology manufacturing as share of total VA, VA in agriculture per person
employed, VA in manufacturing per person employed, VA in serviced per person employed,
VA in low technology manufacturing per person employed, employment in agriculture as
share of total employment, employment in manufacturing as share of total employment,
employment in services as share of total employment, employment in low technology
manufacturing as share of total employment, export value in agriculture to total export value,
export value in manufacturing to total export value, export value in high technology
manufacturing to total export value, export value in medium-high technology manufacturing
6
As there are maximum 18 indicators applied in the joint analysis.
7
to total export value, export value in medium-low technology manufacturing to total export
value, export value in low technology manufacturing to total export value. The final results of
[image:12.595.116.481.205.360.2]estimations are put in tables 3 and 4 (see below).
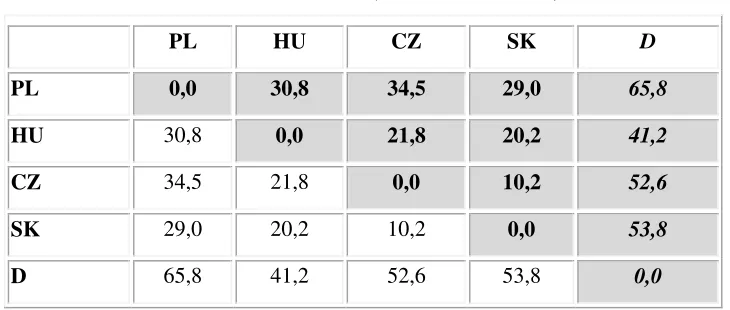
TABLE 3.
Aggregate structural differences among selected countries. Reference country – Germany. Year
2000. Distance matrix (Euclidean distance).
PL HU CZ SK D
PL 0,0 30,8 34,5 29,0 65,8
HU 30,8 0,0 21,8 20,2 41,2
CZ 34,5 21,8 0,0 10,2 52,6
SK 29,0 20,2 10,2 0,0 53,8
D 65,8 41,2 52,6 53,8 0,0
Source. Own calculations using STATISTICA 9.0.
Numbers is the matrix above present relative and composite distance among countries.
The higher the number the greater differences are observed between two countries. The
countries structural convergence is always interpreted in the relation to the German economy
(the reference object). As can be concluded from the Table 3, in the year 2000, Poland was
the country which differed mostly to Germany – the distance was 65,8. The second worst
country is Slovakia with the result of 53,8.We could state that in 2000, between Poland and
Germany the structural differences were at the highest level of all cases included in the study.
The country with the greatest structural similarity to Germany was Hungary – the distance
was 41,2. From the table we can also conclude that in the group of four analyzed countries the
greatest structural similarities are observed between Czech Republic and Slovak Republic –
the distance only at 10,2; while the greatest structural differences were between Poland and
Czech Republic – the distance at 34,5.
As following, the authors run analogues analysis for the data in 2007. The results are
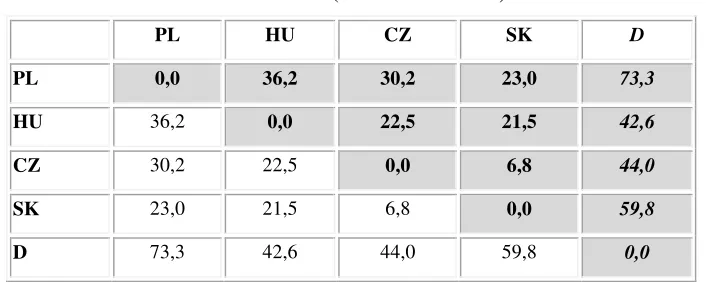
TABLE 4.
Aggregate structural differences among selected countries. Reference country – Germany. Year 2007.
Distance matrix (Euclidean distance).
PL HU CZ SK D
PL 0,0 36,2 30,2 23,0 73,3
HU 36,2 0,0 22,5 21,5 42,6
CZ 30,2 22,5 0,0 6,8 44,0
SK 23,0 21,5 6,8 0,0 59,8
D 73,3 42,6 44,0 59,8 0,0
Source. Own calculations using STATISTICA 9.0.
In the year 2007, as in the 2000, the greatest structural differences were noted between
Poland and Germany – the metric at 73,3. What is also worth to underline, the composite
structural difference is greater in 2007, than it was in 2000. The change in the metric is (+7,4)
– see chart X, which proofs that the relations between the two economies have diverged
during the period of 2000-2007. Such change can be interpreted as growing divergence on the
field of economy`s structure between Poland and Germany. Such “negative” change is also
noted in case of Slovak Republic. In 2000, the Slovak Republic, was the second worst
country, and in the 2007 it still not managed to change its position in the ranking. The change
in metric for Slovak Republic is at (+6,0), which proofs the same worsening relation between
Slovak Republic and Germany, like in the case of Poland and Germany. The country where
the structural convergence can be easily observed is Czech Republic. The country in the
period of 2000-2007 improved its relative position to German economy. The change in metric
was at (-8,5), which proofs that the two economies are getting more and more similar in terms
of their economies structures.
The Hungarian economy was slightly worse off in the 2007, than it was in 2000, when
the relation to Germany is considered. The change in metric is at (+1,3). On such basis we
cannot conclude about the crucial divergence or convergence when overall structure of the
CHART 1.
Changes in the structural distance of Poland, Czech Rep., Hungary and Slovak Rep., with Germany as
reference country. Changes in period 2000-2007.
Source: own elaboration.
As it is clearly visible from the results presented above, in case of 3 (out of 4)
countries – namely Poland, Hungary and Slovak Republic, the structural convergence was not
proofed. The distance between Germany and the three countries is growing in terms of
structural similarities. Poland`s economy structure differs mostly, and what is even worst –
the changes are not going the expected direction. In 2000 Poland`s economy structure was
more similar to the German one, than after 8 sequent years. Only Czech Republic, has
adjusted in terms of the economy structure to the Germany`s economy structure.
b) Structural convergence on disaggregate level
In the final part of the paper, the authors present results of some more detailed
analysis. The structural convergence is tested in four separate dimensions. These are: value
added in selected sectors as share of total value added generated in a given economy (1),
value added per one person employed in selected sectors of national economy (2), share of
persons employed in selected sectors to total employment (3), and share of export value in
selected sectors to total export value in a given economy (4). For the analysis we apply
analogous methodology. The country and data set are the same as applied in the previous
section (a).
Firstly the authors test the structural convergence in terms of value added in sectors as
share of total values added. In the following tables 5 and 6, there are presented metrics
(distances) for the years 2000 and 2007 respectively.
7,44838
1,38935
-8,52693
6,02817
-10 -5 0 5 10
PL HU CZ SK
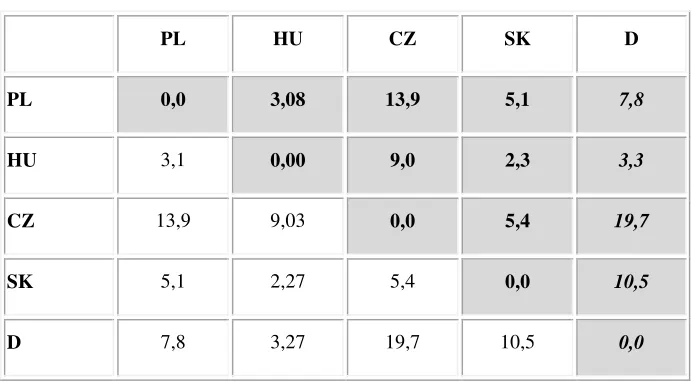
TABLE 5.
Structural differences among selected countries – VA in selected sectors as share of total VA. Reference
country – Germany. Year 2000. Distance matrix (Euclidean distance).
PL HU CZ SK D
PL 0,0 3,08 13,9 5,1 7,8
HU 3,1 0,00 9,0 2,3 3,3
CZ 13,9 9,03 0,0 5,4 19,7
SK 5,1 2,27 5,4 0,0 10,5
D 7,8 3,27 19,7 10,5 0,0
Source. Own calculations using STATISTICA 9.0.
TABLE 6.
Structural differences among selected countries – VA in selected sectors as share of total VA. Reference
country – Germany. Year 2007. Distance matrix (Euclidean distance).
PL HU CZ SK D
PL 0,0 5,84 10,5 6,0 14,7
HU 5,8 0,00 8,2 6,3 5,8
CZ 10,5 8,22 0,0 1,3 9,3
SK 6,0 6,26 1,3 0,0 12,0
D 14,7 5,75 9,3 12,0 0,0
Source. Own calculations using STATISTICA 9.0.
As an it can be concluded from the two tables 5 and 6, in 2000 the highest differences
were observed between Germany in Czech Republic – the metric at 19,7. This year, Poland
was the second best country in the ranking. After, in year 2007 Poland`s relative position
changed significantly. In 2007 the country was in the last place in the ranking. The metric
change was at (+6,9), which means that the Poland`s position has worsened crucially. Among
[image:15.595.121.473.416.604.2]the structural convergence when the share of value added of total VA is taken into account. In
case of the rest three countries, we would rather say about the divergence. Their structures, in
2007, were less similar than in 2000. The average distance for all country from Germany in
2000 was at 10,35, and in 2007 – (10,45). So on the average, the analyzed countries have not
approached in term of the structural similarities to Germany.
Secondly, the structural convergence on the field of valued added in sectors per person
employed was detected. In the following tables 7 and 8, there are presented results of the
[image:16.595.132.464.306.443.2]selected estimations.
TABLE 7.
Structural differences among selected countries – VA per person employed in sectors. Reference country –
Germany. Year 2000. Distance matrix (Euclidean distance).
PL HU CZ SK D
PL 0,0 0,1 0,1 1,0 17,4
HU 0,1 0,0 0,0 0,9 17,2
CZ 0,1 0,0 0,0 1,1 16,3
SK 1,0 0,9 1,1 0,0 25,8
D 17,4 17,2 16,3 25,8 0,0
Source. Own calculations using STATISTICA 9.0.
TABLE 8.
Structural differences among selected countries – VA per person employed in sectors. Reference country –
Germany. Year 2007. Distance matrix (Euclidean distance).
PL HU CZ SK D
PL 0,0 0,6 0,4 2,0 16,4
HU 0,6 0,0 0,1 3,2 13,1
CZ 0,4 0,1 0,0 3,3 12,4
SK 2,0 3,2 3,3 0,0 28,5
D 16,4 13,1 12,4 28,5 0,0
[image:16.595.146.451.529.667.2]In tables 7 and 8, there are presents results of estimations structural convergence on
the field of value added per person employed in selected sectors. As compared to other cases
the metrics reported are relatively very high. That proofs that in terms of valued added per
person employed in selected sectors, the four analyzed countries are lagging far behind
Germany. The overall results seem to be the worst of the rest of cases. However the distances
are pretty high, it shall be stressed that in case of Poland, Czech Republic and Hungary, in the
analyzed period the differences have diminished. Only in case of Slovakia we note worst
results in 2007 than it was in 2000.
Next, there are presented results of structural convergence when employment in sectors to
[image:17.595.136.463.341.487.2]total employment is taken into account. In tables 9 and 10, there are results of estimations.
TABLE 9.
Structural convergence among selected economies – employment in sectors to total employment.
Reference country – Germany. Year 2000. Distance matrix (Euclidean distance).
PL HU CZ SK D
PL 0,0 7,06 11,9 8,72 20,1
HU 7,1 0,00 2,2 0,24 8,8
CZ 11,9 2,20 0,0 1,06 11,4
SK 8,7 0,24 1,1 0,00 8,4
D 20,1 8,85 11,4 8,43 0,0
Source. Own calculations using STATISTICA 9.0.
TABLE 10.
Structural convergence among selected economies – employment in sectors to total employment.
Reference country – Germany. Year 2007. Distance matrix (Euclidean distance).
PL HU CZ SK D
PL 0,0 5,94 10,7 7,84 20,6
HU 5,9 0,00 3,7 0,72 6,6
CZ 10,7 3,67 0,0 1,32 13,8
SK 7,8 0,72 1,3 0,00 8,8
D 20,6 6,57 13,8 8,81 0,0
[image:17.595.139.461.569.705.2]In the case of structural convergence on the field of share of persons employed in
sectors to total employment, Poland`s position is relatively the worst of rest of cases. The
metric for Poland in 2000, was at 20,1, and in 20007 – (20,6), while in case of Hungary the
results were 8,8 and 6,6, respectively. Three out of four countries have worsened its relatively
position to Germany, metrics reported in 2007 are higher than in 2000.
Finally, the authors have tested the structural convergence on the field of export value in
[image:18.595.133.467.282.420.2]selected sectors to total export value. In tables 10 and 11, there are put results of estimations.
TABLE 10.
Structural convergence among selected economies – export value in sectors to total export value.
Reference country – Germany. Year 2000. Distance matrix (Euclidean distance).
PL HU CZ SK D
PL 0,0 20,5 8,6 14,2 20,5
HU 20,5 0,0 10,6 16,8 12,0
CZ 8,6 10,6 0,0 2,7 5,1
SK 14,2 16,8 2,7 0,0 9,1
D 20,5 12,0 5,1 9,1 0,0
Source. Own calculations using STATISTICA 9.0.
TABLE 11.
Structural convergence among selected economies – export value in sectors to total export value.
Reference country – Germany. Year 2007. Distance matrix (Euclidean distance).
PL HU CZ SK D
PL 0,0 23,9 8,6 7,2 21,5
HU 23,9 0,0 10,5 11,4 17,2
CZ 8,6 10,5 0,0 0,8 8,5
SK 7,2 11,4 0,8 0,0 10,5
D 21,5 17,2 8,5 10,5 0,0
Source. Own calculations using STATISTICA 9.0.
In case of export value in sectors to total export value, still the Poland`s positions
results to be the worst of all. In 2000 the metric for Poland was at 20,5, while in 2007 –
(21,5),comparing to the results of Czech Republic – (5,1) and (8,5) in respective years. That
[image:18.595.130.470.506.646.2]In final part of the last section, the authors test for changes in metrics on 4 disaggregation
[image:19.595.72.529.414.645.2]level. The results of estimation are put in table 12 and also presented in chart 2.
TABLE 12.
Changes in metrics on different disaggregation levels. Start year – 2000, end year – 2007.
Country A B C D
Poland 6,9 -1 0,5 1
Hungary 2,5 -4,1 -2,2 5,2
Czech Republic -10,4 -3,9 2,4 3,4
Slovak Republic 1,5 2,7 0,4 1,4
Legend:
(A) – Value added in sectors as share of total value added – changes in metrics; start year – 2000, end year – 2007. (B) – Value added in sectors per person employed in sectors – changes in metrics; start year – 2000, end year – 2007. (C) – Share of persons employed in selected sectors to total employment – changes in metrics; start year – 2000, end
year – 2007.
(D) – Share of export value in selected sectors to total export value - changes in metrics; start year – 2000, end year – 2007.
Source: own calculations.
CHART 2.
Structural convergence on disaggregate level. Changes in metrics. Start year – 2000, end year – 2007.
Source: own elaboration.
The negative values in Table 12, proof that a given country is better off in relation to
Germany. Also on that basis we can conclude about the process of convergence or divergence
among countries. The country which converges mostly with the German economy is Czech
Republic. In three cases we note the negative changes in metric, which means that the country
6,9
-1
0,5 1
2,5
-4,1
-2,2
5,2
-10,4
-3,9
2,4 3,4
1,5
2,7
0,4 1,4
-12 -10 -8 -6 -4 -2 0 2 4 6 8
A B C D
is approaching Germany in terms of economic structure in selected dimensions. Also it must
be stressed that in terms of dimension (A), Czech Republic has made the greatest progress, the
change in metrics is at (-10,4). Hungary is the second best country in terms of convergence
with Germany. Hungary improved their results in 2 out of 4 dimensions. Polish economy
structure has hardly changed in relation to the German one in the analyzed period. In
dimension (A), we note a significant and negative change – the metric has increased at (+6,9),
which proofs greater divergence between these two countries. In the rest 3 dimensions the
changes are slightly visible, that can be interpreted as if the structures of the two countries are
at the comparable level of similarity. The Slovak Republic is the country which performs
worst out of the 4 analysed. In all 4 dimensions we note an increase in metrics, which means
that the country’s relative position to Germany is rather worse in 2007, than in 2000. That
proofs no convergence in terms of economy structure between Germany and Slovak Republic.
4. Final remarks.
The main aim of the paper was to test for structural convergence between four selected
transition economies and Germany as the selected reference object. The authors purpose was
also to learn about the structural convergence – or divergence – on disaggregate level. The
results of multidimensional analysis, based on some arbitrary selected indicators, are the
following:
- in the year 2000 the overall cohesion of the four countries with Germany was
higher than in 2007,
- during the first decade of transformation (till 2000), the transition economies
tented to converge structurally with the European countries, which was probably
causes mainly by the high foreign direct investments inflows,
- among the four analyzed countries, Czech Republic economy converged
structurally with Germany – concluded from the negative change in metrics`
values,
- countries like: Poland, Hungary and Slovak Republic diverged structurally, in the
analyzed period, with Germany – concluded from the positive changes in metrics`
values,
- Poland was the country which economy structure diverged most significantly with
Germany, compared to the rest of countries in the sample.
As a general conclusion it can be stated that in the period of 2000 – 2007, selected economies`
structure of Poland, Hungary and Slovak Republic was more similar to the Germany’s once in
2000 than in 2007.
Bibliography
1. Jackson R., Rogerson P., Plane D., (1990): A causative matrix approach to interpreting
structural changes. Economic System Research no 2, pp. 259-269.
2. Syrquin M (2010): Kuznets and Pasinetti on the study of structural transformation: Never
the Twain shall meet?.Structural change and Economic Dynamics, no 21, p.248-257.
3. Machlup F. (1963): Essays in Economic Semantics. Prentice-Hall, Englewood Cliffs.
4. Nelson R.(2005): Technology, Institutions and Economic Growth. Harward University
Press, Cambridge.
5. Hagemann H., Landesmann M., Scazzieri R. (Eds) (2003): The Economics of Structural
Changes. Elgar, Cheltenham.
6. Kuznets S (1930): Secular Movements in Production and Prices: Their Nature and their
Bearing upon Cyclical Fluctuations. Houghton Mifflin Boston, MA, New York.
7. E.G. Silva, A.A Teixeira (2008): Survey structural change: seminal contributions and a
bibliometric account. Journal of Structural Change and Economic Dynamics pp.276.
8. Matkowski Z.,Próchniak M. (2006) Real Economic convergence in the EU Accession
countries. International Journal of Applied Econometrics and Quantitative Studies,
July-August, vol.1-3.
9. Palan N., Schmiedeberg C (2010) Structural convergence of European countries. Journal of
Structural Change and Economics Dynamics, pp.3.
10. Fourastié, J., (1944) Le Grand Espoir du XXe Sičcle: Progres Technique –Progres
Economique – Progres Social. Paris.
11. Clark, C., (1940) The Conditions of Economic Progress. Macmillan.
12. Kuznets, S. (1972) Economic Growth of Nations. Total Output and Production Structure.
Cambridge, MA.
13. Chenery, H.B., 1960. Patterns of industrial growth. The American Economic
Review 50, 624–654.
14. Wacziarg, R., 2004. Structural convergence. CDDRL Working Papers, No.8.
15. N.Palan, C. Schmiedeberg (2010), Structural convergence of European countries,
STATISTICAL ANNEX
Table 1. Value added (VA) in selected sectors as share of total value added in Polish economy. Current prices. Years 2000-2007.
2000 2001 2002 2003 2004 2005 2006 2007 VA in
agriculture8/total VA 5,0% 5,1% 4,5% 4,4% 5,1% 4,5% 4,3% 4,3% VA in
manufacturing/total VA
18,5% 16,8% 16,5% 17,7% 19,1% 18,5% 18,8% 18,9%
VA in services9/total
VA 63,3% 65,4% 66,8% 66,0% 64,1% 64,8% 64,6% 64,0%
VA in low technology sector10/total VA
8,1% 7,5% 7,1% 7,2% 7,3% 7,4% 7,4% 7,3%
[image:22.595.69.504.315.469.2]Source: own calculations based on data drawn from OECD STAN Database for Structural Analysis, www.oecd.org, 2011
Table 2. Value added per one person employed in selected sectors. Expressed in Euro, current prices. Data for Poland. Years 2000-2007.
2000 2001 2002 2003 2004 2005 2006 2007 VA in
agriculture11/employment in agriculture
3160 3739 3034 3254 4150 4157 4564 5549
VA in
manufacturing/employment in manufacturing
10442 11796 11424 12633 14043 14708 15380 17234
VA in
services12/employment in services
14936 18224 16661 16994 17655 19314 19934 22146
VA in low technology sector13/employment in low technology sector
8434 9702 9222 9655 10151 11299 11971 13506
Source: own calculations based on data drawn from OECD STAN Database for Structural Analysis, www.oecd.org, 2011
Table 3. Share of persons employed in selected sectors to total employment. Poland. Years 2000-2007. 2000 2001 2002 2003 2004 2005 2006 2007 Employment in
agriculture14/total employment
18,4% 19,1% 19,3% 18,4% 18,0% 17,4% 15,8% 14,7%
Employment in manufacturing/total employment
20,8% 20,0% 18,7% 19,1% 19,9% 20,1% 20,5% 20,7%
Employment in services/total employment
49,7% 50,4% 52,1% 53,0% 53,2% 53,5% 54,4% 54,6%
Employment in low
technology sector/total 11,3% 10,8% 10,0% 10,2% 10,6% 10,5% 10,3% 10,3%
8
Refers to agriculture, hunting, forestry and fishing 9
Post-aggregation data 10
Refers to agriculture, hunting, forestry and fishing 11
Refers to agriculture, hunting, forestry and fishing 12
Post-aggregation data 13
Post-aggregation data 14
[image:22.595.69.502.521.678.2]employment
[image:23.595.70.500.140.413.2]Source: own calculations based on data drawn from OECD STAN Database for Structural Analysis, www.oecd.org, 2011
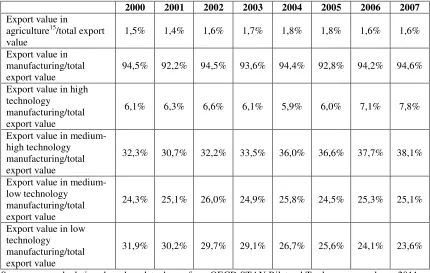
Table 4. Share of export value in selected sectors to total export value. In USD, current prices. Poland. Years 2000-2007.
2000 2001 2002 2003 2004 2005 2006 2007 Export value in
agriculture15/total export value
1,5% 1,4% 1,6% 1,7% 1,8% 1,8% 1,6% 1,6%
Export value in manufacturing/total export value
94,5% 92,2% 94,5% 93,6% 94,4% 92,8% 94,2% 94,6%
Export value in high technology
manufacturing/total export value
6,1% 6,3% 6,6% 6,1% 5,9% 6,0% 7,1% 7,8%
Export value in medium-high technology manufacturing/total export value
32,3% 30,7% 32,2% 33,5% 36,0% 36,6% 37,7% 38,1%
Export value in medium-low technology
manufacturing/total export value
24,3% 25,1% 26,0% 24,9% 25,8% 24,5% 25,3% 25,1%
Export value in low technology
manufacturing/total export value
31,9% 30,2% 29,7% 29,1% 26,7% 25,6% 24,1% 23,6%
[image:23.595.72.509.466.609.2]Source: own calculations based on data drawn from OECD STAN Bilateral Trade, www.oecd.org, 2011
Table 5. Value added (VA) in selected sectors as share of total value added in Hungarian economy. Current prices. Years 2000-2007.
2000 2001 2002 2003 2004 2005 2006 2007 VA in
agriculture16/total VA
5,4% 5,2% 4,6% 4,3% 4,8% 4,2% 4,0% 4,0%
VA in
manufacturing/total VA
23,1% 22,4% 21,5% 21,8% 22,4% 22,3% 22,8% 22,2%
VA in
services17/total VA 62,8% 64,1% 65,5% 66,0% 64,7% 65,6% 65,7% 66,2% VA in low
technology sector18/total VA
7,0% 7,3% 6,9% 6,2% 5,6% 5,1% 5,0% 4,7%
Source: own calculations based on data drawn from OECD STAN Database for Structural Analysis, www.oecd.org, 2011
15
Refers to agriculture, hunting, forestry and fishing 16
Refers to agriculture, hunting, forestry and fishing 17
Post-aggregation data 18
Table 6. Value added per one person employed in selected sectors. Expressed in Euro, current prices. Data for Hungary. Years 2000-2007.
2000 2001 2002 2003 2004 2005 2006 2007 VA in
agriculture19/employment in agriculture
9138 11611 12133 12286 17093 16223 17217 18693
VA in
manufacturing/employment in manufacturing
10595 12584 14209 14517 18170 19246 21629 21994
VA in
services20/employment in services
11752 15045 17984 16934 19457 20111 21794 23177
VA in low technology sector21/employment in low technology sector
6727 8914 9981 9220 10566 10419 11504 11864
[image:24.595.71.501.289.445.2]Source: own calculations based on data drawn from OECD STAN Database for Structural Analysis, www.oecd.org, 2011
Table 7. Share of persons employed in selected sectors to total employment. Hungary. Years 2000-2007. 2000 2001 2002 2003 2004 2005 2006 2007 Employment in
agriculture22/total employment
6,6% 6,3% 6,2% 5,5% 5,3% 5,0% 4,9% 4,7%
Employment in manufacturing/total employment
24,3% 24,9% 24,8% 23,6% 22,9% 22,3% 22,0% 22,2%
Employment in services/total employment
59,6% 59,5% 59,7% 61,2% 61,9% 62,7% 62,9% 62,8%
Employment in low technology sector/total employment
11,5% 11,5% 11,4% 10,5% 9,9% 9,4% 9,0% 8,8%
Source: own calculations based on data drawn from OECD STAN Database for Structural Analysis, www.oecd.org, 2011
Table 8. Share of export value in selected sectors to total export value. In USD, current prices. Hungary. Years 2000-2007.
2000 2001 2002 2003 2004 2005 2006 2007 Export value in
agriculture23/total export value
2,6% 2,9% 2,8% 2,6% 2,4% 2,2% 2,1% 2,9%
Export value in manufacturing/total export value
96,6% 95,3% 95,7% 95,9% 96,3% 96,1% 91,3% 95,0%
Export value in high technology
manufacturing/total export value
29,6% 27,0% 28,7% 30,9% 33,5% 30,6% 29,3% 28,8%
Export value in medium-high technology manufacturing/total export value
38,1% 38,5% 38,2% 38,8% 38,1% 39,0% 40,2% 41,5%
19
Refers to agriculture, hunting, forestry and fishing 20
Post-aggregation data 21
Post-aggregation data 22
Refers to agriculture, hunting, forestry and fishing 23
[image:24.595.69.503.512.697.2]Export value in medium-low technology
manufacturing/total export value
10,8% 10,7% 10,3% 10,6% 10,8% 11,4% 11,1% 11,4%
Export value in low technology
manufacturing/total export value
18,0% 19,0% 18,3% 15,6% 13,7% 12,5% 10,7% 10,4%
[image:25.595.69.501.70.169.2]Source: own calculations based on data drawn from OECD STAN Bilateral Trade, www.oecd.org, 2011
Table 9. Value added (VA) in selected sectors as share of total value added in Czech economy. Current prices. Years 2000-2007.
2000 2001 2002 2003 2004 2005 2006 2007 VA in
agriculture24/total VA
3,9% 3,9% 3,3% 3,1% 3,3% 3,0% 2,6% 2,5%
VA in
manufacturing/total VA
26,8% 26,4% 25,4% 24,7% 26,8% 26,3% 26,3% 26,5%
VA in
services25/total VA 58,0% 58,3% 60,0% 61,0% 58,1% 59,1% 59,2% 59,1% VA in low
technology sector26/total VA
8,7% 8,7% 8,7% 7,8% 8,0% 7,5% 7,0% 6,7%
[image:25.595.70.503.408.564.2]Source: own calculations based on data drawn from OECD STAN Database for Structural Analysis, www.oecd.org, 2011
Table 10. Value added per one person employed in selected sectors. Expressed in Euro, current prices. Data for Czech Republic. Years 2000-2007.
2000 2001 2002 2003 2004 2005 2006 2007 VA in
agriculture27/employment in agriculture
9249 11505 10924 10981 13858 14623 14488 15675
VA in
manufacturing/employment in manufacturing
11104 12619 12999 13203 16477 17726 19863 22206
VA in
services28/employment in services
11858 13945 15026 15587 16999 18851 21235 23155
VA in low technology sector29/employment in low technology sector
9578 11232 12054 11507 13757 14740 16178 17691
Source: own calculations based on data drawn from OECD STAN Database for Structural Analysis, www.oecd.org, 2011
24
Refers to agriculture, hunting, forestry and fishing 25
Post-aggregation data 26
Refers to agriculture, hunting, forestry and fishing 27
Refers to agriculture, hunting, forestry and fishing 28
Post-aggregation data 29
Table 11. Share of persons employed in selected sectors to total employment. Czech Republic. Years 2000-2007. 2000 2001 2002 2003 2004 2005 2006 2007
Employment in agriculture30/total employment
4,8% 4,6% 4,3% 4,2% 4,0% 3,8% 3,7% 3,6%
Employment in manufacturing/total employment
27,7% 28,1% 27,8% 27,4% 27,4% 27,5% 27,6% 27,3%
Employment in services/total employment
56,0% 56,2% 56,9% 57,5% 57,6% 57,9% 58,0% 58,3%
Employment in low technology sector/total employment
10,4% 10,4% 10,3% 10,0% 9,8% 9,4% 9,0% 8,7%
[image:26.595.73.500.304.571.2]Source: own calculations based on data drawn from OECD STAN Database for Structural Analysis, www.oecd.org, 2011
Table 12. Share of export value in selected sectors to total export value. In USD, current prices. Czech Republic. Years 2000-2007.
2000 2001 2002 2003 2004 2005 2006 2007 Export value in
agriculture31/total export value
1,6% 1,1% 1,0% 1,1% 1,0% 1,3% 1,1% 1,2%
Export value in manufacturing/total export value
95,9% 96,4% 96,4% 96,1% 96,1% 95,5% 95,6% 95,8%
Export value in high technology
manufacturing/total export value
9,1% 11,6% 14,3% 14,2% 15,8% 14,6% 16,4% 18,0%
Export value in medium-high technology manufacturing/total export value
43,6% 43,3% 42,4% 43,0% 42,7% 43,0% 43,3% 43,4%
Export value in medium-low technology
manufacturing/total export value
23,5% 22,6% 22,1% 22,0% 21,8% 21,2% 20,3% 20,0%
Export value in low technology
manufacturing/total export value
19,7% 18,8% 17,6% 17,0% 15,8% 15,7% 14,6% 14,5%
Source: own calculations based on data drawn from OECD STAN Bilateral Trade, www.oecd.org, 2011
Table 13. Value added (VA) in selected sectors as share of total value added in Slovak economy. Current prices. Years 2000-2007.
2000 2001 2002 2003 2004 2005 2006 2007 VA in
agriculture32/total VA
4,5% 4,7% 5,1% 4,5% 4,1% 3,7% 3,6% 3,5%
VA in
manufacturing/total VA
24,7% 25,3% 22,8% 23,4% 24,0% 24,1% 24,1% 24,2%
30
Refers to agriculture, hunting, forestry and fishing 31
Refers to agriculture, hunting, forestry and fishing 32
VA in
services33/total VA 59,3% 60,4% 60,9% 60,5% 59,3% 59,8% 57,4% 57,7% VA in low
technology sector34/total VA
8,5% 9,0% 7,5% 7,3% 7,1% 7,2% 7,1% 6,7%
[image:27.595.72.500.69.131.2]Source: own calculations based on data drawn from OECD STAN Database for Structural Analysis, www.oecd.org, 2011
Table 14. Value added per one person employed in selected sectors. Expressed in Euro, current prices. Data for Slovakia. Years 2000-2007.
2000 2001 2002 2003 2004 2005 2006 2007 VA in
agriculture35/employment in agriculture
244 304 396 431 456 462 609 733
VA in
manufacturing/employment in manufacturing
303 351 358 398 486 547 673 750
VA in
services36/employment in services
311 353 391 426 494 539 625 706
VA in low technology sector37/employment in low technology sector
241 291 272 290 345 400 498 565
[image:27.595.71.504.396.551.2]Source: own calculations based on data drawn from OECD STAN Database for Structural Analysis, www.oecd.org, 2011
Table 15. Share of persons employed in selected sectors to total employment. Slovakia. Years 2000-2007. 2000 2001 2002 2003 2004 2005 2006 2007 Employment in
agriculture38/total employment
5,7% 5,4% 5,0% 4,5% 4,5% 4,4% 4,0% 3,6%
Employment in manufacturing/total employment
25,4% 25,4% 24,9% 25,2% 25,0% 24,5% 24,3% 24,5%
Employment in services/total employment
59,4% 60,2% 60,9% 60,9% 60,9% 61,6% 62,1% 62,1%
Employment in low technology sector/total employment
11,0% 10,8% 10,7% 10,7% 10,4% 9,9% 9,6% 9,1%
Source: own calculations based on data drawn from OECD STAN Database for Structural Analysis, www.oecd.org, 2011
33
Post-aggregation data 34
Refers to agriculture, hunting, forestry and fishing 35
Refers to agriculture, hunting, forestry and fishing 36
Post-aggregation data 37
Post-aggregation data 38
Table 16. Share of export value in selected sectors to total export value. In USD, current prices. Slovakia. Years 2000-2007.
2000 2001 2002 2003 2004 2005 2006 2007 Export value in
agriculture39/total export value
1,3% 1,3% 1,2% 1,0% 1,1% 1,7% 1,6% 1,4%
Export value in manufacturing/total export value
97,3% 97,2% 96,9% 97,2% 96,4% 95,9% 94,3% 95,5%
Export value in high technology
manufacturing/total export value
5,0% 5,9% 5,3% 5,6% 7,3% 11,0% 14,1% 16,4%
Export value in medium-high technology manufacturing/total export value
43,5% 41,4% 42,3% 47,8% 44,7% 39,9% 40,2% 42,0%
Export value in medium-low technology
manufacturing/total export value
28,7% 28,4% 27,6% 24,9% 26,9% 27,9% 25,6% 24,0%
Export value in low technology
manufacturing/total export value
20,1% 21,4% 21,7% 18,9% 17,5% 17,0% 14,4% 13,3%
[image:28.595.71.495.408.553.2]Source: own calculations based on data drawn from OECD STAN Bilateral Trade, www.oecd.org, 2011
Table 17. Value added (VA) in selected sectors as share of total value added in German economy. Current prices. Years 2000-2007.
2000 2001 2002 2003 2004 2005 2006 2007 VA in
agriculture40/total VA
1,3% 1,4% 1,1% 1,0% 1,1% 0,9% 0,8% 1,0%
VA in
manufacturing/total VA
22,9% 22,8% 22,4% 22,4% 22,6% 22,7% 23,3% 23,8%
VA in
services41/total VA 68,5% 69,0% 69,7% 70,2% 69,6% 70,0% 69,3% 68,6% VA in low
technology sector42/total VA
5,5% 5,3% 5,1% 4,9% 4,9% 4,8% 4,7% 4,6%
Source: own calculations based on data drawn from OECD STAN Database for Structural Analysis, www.oecd.org, 2011
Table 18. Value added per one person employed in selected sectors. Expressed in Euro, current prices. Data for Germany. Years 2000-2007.
2000 2001 2002 2003 2004 2005 2006 2007 VA in
agriculture43/employment in agriculture
49703 56391 48811 42494 47921 39728 40782 4705 6
VA in
manufacturing/employm ent in manufacturing
54614 55519 56594 58597 61785 63840 68798 7174 5
39
Refers to agriculture, hunting, forestry and fishing 40
Refers to agriculture, hunting, forestry and fishing 41
Post-aggregation data 42
Refers to agriculture, hunting, forestry and fishing 43
VA in
services44/employment in services
52602 53703 54858 55905 56436 57259 58092 5867 7
VA in low technology sector45/employment in low technology sector
44286 44394 44284 45002 46731 47517 49461 5003 0
[image:29.595.73.490.70.149.2]Source: own calculations based on data drawn from OECD STAN Database for Structural Analysis, www.oecd.org, 2011
Table 19. Share of persons employed in selected sectors to total employment. Germany. Years 2000-2007. 2000 2001 2002 2003 2004 2005 2006 2007 Employment in
agriculture46/total employment
1,3% 1,3% 1,3% 1,3% 1,3% 1,3% 1,3% 1,3%
Employment in manufacturing/total employment
22,1% 22,2% 21,8% 21,5% 21,1% 20,8% 20,5% 20,5%
Employment in services/total employment
68,6% 69,2% 70,0% 70,6% 71,1% 71,7% 72,2% 72,3%
Employment in low technology sector/total employment
6,5% 6,4% 6,3% 6,1% 6,0% 5,9% 5,7% 5,7%
[image:29.595.73.500.420.687.2]Source: own calculations based on data drawn from OECD STAN Database for Structural Analysis, www.oecd.org, 2011
Table 20. Share of export value in selected sectors to total export value. In USD, current prices. Germany. Years 2000-2007.
2000 2001 2002 2003 2004 2005 2006 2007 Export value in
agriculture47/total export value
0,9% 0,8% 0,8% 0,7% 0,7% 0,8% 0,7% 0,7%
Export value in manufacturing/total export value
96,0% 96,1% 96,5% 93,0% 92,5% 94,5% 95,2% 91,2%
Export value in high technology
manufacturing/total export value
19,1% 19,6% 18,5% 17,6% 18,5% 19,0% 18,7% 17,3%
Export value in medium-high technology manufacturing/total export value
48,0% 48,1% 49,1% 47,9% 47,0% 48,3% 47,4% 46,7%
Export value in medium-low technology
manufacturing/total export value
14,1% 13,9% 14,2% 13,5% 14,0% 15,0% 16,0% 15,9%
Export value in low technology
manufacturing/total export value
13,4% 13,2% 13,4% 12,7% 12,0% 12,6% 12,2% 11,9%
Source: own calculations based on data drawn from OECD STAN Bilateral Trade, www.oecd.org, 2011
44 Post-aggregation data 45 Post-aggregation data 46
Refers to agriculture, hunting, forestry and fishing 47
Table 21. Exchange rates applied for converting national currencies into Euros. European Central Bank. Exchanges rates for period 2000-2007 (December). 1 Euro = [X] units of national currency.
2000 2001 2002 2003 2004 2005 2006 2007
Poland 3,84 3,49 4 4,01 4,074 3,86 3,82 3,59
Czech
Republic 35,06 31,96 31,48 32,41 30,39 29,01 27,48 26,62 Hungary 265,1 245,18 235,95 262,5 245,63 252,51 251,77 253,73 Slovak