Munich Personal RePEc Archive
Intangible training capital and
productivity in Europe
O’Mahony, Mary and Peng, Fei
2011
Online at
https://mpra.ub.uni-muenchen.de/38648/
1
Intangible Training Capital and Productivity in Europe*
Mary O’Mahony
Fei Peng
University of Birmingham
*
This paper was funded by the FP7 project SERVICEGAP and builds on a project titled ‘Education, Training and Productivity’, which was carried out for the European Commission DG-Enterprise and Industry. The opinions expressed are those of the authors only and do not represent the European Commission's official position. We acknowledge the comments from participants at the Royal Economic Society and Scottish Economic Society annual conferences, seminars at the University of Birmingham and Middlesex University, and from participam and support from other members of the research team at Birmingham – Fiona Carmichael, Marco Ercolani. Thanks are also due to and to Lili Kang, Michael Peneder, Catherine Robinson and Yasheng Maimaiti.2
Abstract
This paper employs industry data, derived from linking the EU LFS to
productivity accounts from EU KLEMS, to examine workforce training and
productivity in European Union original members states. Training activities are
modelled as intangible investments by firms and cumulated to stocks so their
impact can be evaluated within a production function framework, including
links to the use of information and communications technology (ICT). The
results suggest significantly positive effects of training on productivity, both
direct and interacted with ICT, with different impacts in services than in
production industries. These results are robust to the use of instrumental
variables methods, both lagged instruments and a set of variables that capture
features of the operation of labour markets.
Keywords: Training, Intangible Capital, EUKLEMS, EU LFS
3
1.
Introduction
Remaining competitive in an increasingly globalised world requires that European
nations maintain their comparative advantage in producing high quality output. This requires
not only a highly skilled labour force, but also one that adapts fast to change. In the face of
rapidly changing technology (for example, changes arising from information and
communications technology - ICT), it is imperative that skills are appropriate and up to date.
Providing basic skills is mostly the responsibility of the general education system but
changing education provision is often time consuming. Firms or workers can instead make up
for any skill shortfall by engaging in workplace training.
This paper investigates the impact of training on productivity, linking to a recent
literature that emphasizes the need to invest in intangible assets when reorganising production
following adoption of ICT. Organisational change alters the nature of work and is associated
with retraining requirements. This paper utilises a new measure of firm specific human
capital, which is richer than conventional measures of the proportion of the workforce that
receives training, which combines both probability and duration of training with information
on the characteristics of those trained.
The paper examines variation across EU15 members states and across industries,
focusing especially on production versus market service sectors. It first reviews the literature
on training, education, their links with use of information technology and their impacts on
productivity. Section 3 presents a descriptive overview of training in the EU using the data
from the EU Labour Force Survey (EU LFS)1. This section presents basic data by industry
and country on the extent of training, who receives training and its duration. Section 4
presents details of the measurement of intangible training investments and capital stocks and
1
European Commission, Eurostat, European Union Labour Force Survey, quarterly data. Eurostat has no
4
presents growth accounting estimates. Section 5 is an econometric analysis of the impact of
training on productivity. It tackles the important issue of endogeneity using a variety of
instruments. Section 6 concludes.
2.
Training, Education and Productivity
The importance of education and training as drivers of firm performance has long
been recognised by both the human resource management and economics disciplines.
Workplace learning and continuous improvement are considered essential for an organization
to remain competitive (Salas and Cannon-Bowers 2001). When training does result in
improvements in relevant knowledge and the acquisition of relevant skills, employee job
performance should improve, provided that the skills learned in training transfer to the job
(Baldwin and Ford 1988). In general, research finds that workplace training promotes good
working practices. For example, Krueger and Rouse (1998) find that training had a positive
association with the incidence of job bids, upgrades, performance awards, and job attendance.
Many studies find a positive association between workplace training and productivity (Bartel
1994; Black and Lynch 1996; Conti 2005; Dearden et al. 2006; Vignoles et al, 2004, Zwick,
2006).
Human capital has long been seen as important in determining economic growth and
countries may adopt and utilise technologies differently, depending on their skill endowments
(Lewis 2005; Acemoglu 1998). Much research effort has been devoted to the issue of
whether technical change is skill-biased and on the impact of information and
communications technology (ICT) on the demand for skilled labour (e.g. Bartel and
Lichtenberg 1987; Autor, Katz and Krueger 1998; Machin and van Reenen 1998). In a
similar vein research has highlighted that organisational changes and other forms of
5
productivity benefits from using ICT (Bertschek and Kaiser 2004; Bresnahan, Brynjolfsson
and Hitt 2002; Brynjolfsson, Hitt and Yang 2002; Black and Lynch, 2001).
It is now well known that the acceleration in US productivity growth that emerged in the mid 1990s was not matched in the EU, O’Mahony and van Ark (2003), and that the
differing performance in the two regions is linked to the knowledge economy, including use of ICT and skilled labour (van Ark, O’Mahony and Timmer, 2008). A comprehensive
analysis of sources of productivity growth by country and industry is now possible following
the construction of the EU KLEMS growth and productivity accounts database (see O’Mahony and Timmer, 2009, and Timmer et al. 2007 for details). This analysis suggests
that much of the failure of Europe to match the US growth spurt can be traced to
developments in market service sectors (Timmer et al. 2009), although the extent of this
varies by country within the EU. These authors also highlight that the source of much of the
difference between the US and EU labour productivity growth can be attributed to underlying
multi-factor productivity (MFP), after accounting for the use of inputs of various kinds.
Since MFP is measured as a residual, less is known about the underlying drivers of
productivity. A recent literature has tried to get beneath these differences by focusing on
unmeasured intangible investments as sources of growth. The pioneering work in this respect
is the paper by Corrado, Hulten and Sichel (2005) who attempted to measure intangibles for
the US. These authors defined a number of types of intangible investments including software,
scientific and non-scientific R&D, brand equity and firm specific expenditures such as on the
job training and managing organisational changes. Estimates by the above authors suggest
that these investments combined account for about 11% of US GDP and have been growing
rapidly. Similar studies for the UK (Giorgio Marrano and Haskel 2006), Finland (Javala,
Aulin-Amhavarra and Alanen 2007), Canada (Baldwin et al. 2008), the Netherlands (van
6
(2009) for EU countries suggest also that intangibles are sizeable, although most account for
lower proportions of GDP than in the US. Capitalisation of these assets and incorporating
them in a growth accounting framework reduces MFP growth (e.g. Corrado, Hulten and
Sichel, 2006, Giorgio Marrano, Haskel and Wallis, 2007), but this is true across all countries
so that estimates to date suggest that unmeasured intangible inputs are unlikely by themselves
to explain the EU-US productivity growth gap.
The above studies on intangible investments mainly refer to the aggregate economy,
although a few report results by industry. Nevertheless comprehensive estimates by country
and industry are some way off. As with the conventional sources of growth, it is likely that
an examination of intangible investments by industry would be particularly beneficial in
explaining why Europe failed to experience a US type productivity surge. This paper adds to
the above literature by focusing on one type of intangible investment, work force training,
using a harmonised data set, the EU LFS, that allows an investigation of cross industry and
cross country differences.
3.
Workforce Training in the EU
This section briefly examines the prevalence of workforce training across EU
countries – further detail is given in Carmichael et al. (2009). The discussion employs the EU
LFS as the main data source and presents an overview on training in the EU15. In 2007 in the
EU as a whole approximately 11% of employees received some training in the 4 weeks prior
to the quarterly survey (Table 1). The figures for the EU aggregate hide large variation across
countries with high proportions in the Scandinavian countries, the Netherlands and the UK,
and considerably lower proportions in the large continental EU-15 countries of France,
Germany, Spain and Italy. The training proportion has been rising over time in the EU as a
whole. Dividing by industry group shows that the percent of workers receiving training is
7
services. The underlying data suggest that training proportions are particularly high in
[image:8.595.83.511.152.335.2]financial services – see Carmichael et al. (2009).
Table 1. Proportion of the workforce receiving training in the past four weeks, EU15.1
Year Worker characteristic
(2007)
Skill Group
1995 8.5 High5 18.3
1999 9.1 Intermediate6 9.5
2003 10.9 Low7 5.2
2007 11.2 Gender
Male 9.7
Female 12.8
Industry group (2007) Age Group
Production2 7.0 15-29 13.1
Market Services3 10.1 30-49 11.0
Non-market services4 16.2 50+ 9.4
Notes: 1. From 2003 this is based on the variable ‘COURATT’ which ask respondents ‘did you attend any courses, seminars, conferences or received private lessons or instructions outside the regular education system in the past 4 weeks. Time series are constructed by linking in an overlapping year to the variable ‘EDUC4WN’ – education or training received during the previous 4 weeks.
2. Agriculture, Forestry & Fishing; Mining; Manufacturing; Electricity, Gas & Water and Construction;
3.Distribution; Hotels & Catering; Transport and Communications; Financial Services; Business Services; Other Personal Services; 4. Public Administration; Education; Health and Social Services.
5.(ISCED 5-6) University degree or equivalent; 6. (ISCED 3-4) Academic and vocational qualifications above intermediate secondary; 7. (ISCED 1-2) secondary qualifications at age 16 or below
Source EU LFS
Training is also varies by worker characteristic. The figures in Table 1 suggest that
females are more likely to receive training than males, training proportion decline with age
and rise with skill level. The division by skill group is particularly pronounced – in fact in the
EU-15 the share of all workers receiving training who have ‘high’ qualification levels was
much higher (44%) than this group’s share of the total workforce (15%).
The proportion of workers trained is a crude measure of countries propensity to invest
in training not least because training durations can vary considerably. On average workers
who receive training in the past 4 weeks are trained for about 17 hours which is a sizeable
length of time. Thus workplace training is not dominated by relatively short courses but
rather represents activities that are likely to add substantially to the human capital of those
8
are borne by firms. An important indicator of the commitment of firms to training, and of the
cost to firms as used in the intangible investment calculations below, is the extent to which
training occurs during normal working hours. The EULFS asks respondents if the training
occurred always or mostly during working hours. In the EU countries for which data were
available, about 67% of respondents said training occurred wholly or mostly during working
hours. Similar proportions were observed in production and services sectors but the variation
was greater across countries. In Finland, France and the UK more than 75% of training
occurred during working hours whereas in Belgium, Ireland, Italy and the Netherlands the
proportion was about 50% and was under 40% in Greece.
4.
Training as Intangible Capital
As noted in section 2, much of the recent literature on the productivity effects of new
technologies emphasises the need to invest in organisational changes and other firm specific
changes in production processes. These changes required firms to expend some resources,
which collectively are termed intangible investments. The literature frequently referred to
these intangible investments as the ‘missing input’ that potentially could explain the apparent
rise in MFP growth some time after the introduction of technologies such as ICT. As
intangibles are difficult to observe and measure by definition, their impact was mainly
captured by the MFP component in analyses of sources of growth.
This section analyses training as an intangible investment, using the information on
proportions of workers trained and the duration of training. It first sets out a brief description
of the methodology employed – further details and sensitivity analysis are given in O’Mahony (2010). This is followed by a description of the importance of these intangible
9
we only present estimates for the market economy since non-market services are not included
in our regressions due to well known problems in estimating real output in these sectors.2
Estimating intangible investments by firms requires a monetary valuation of the
number of hours of training received by workers. The estimates presented here are calculated
as hours trained multiplied by the average hourly cost to firms aggregated to industry level as
the source data on training does not have information on wages. Therefore intangible
investments by firms in training in industry i, country j and time period t are calculated by:
(1) TIi,j,t HTRi,j,tCi,j,tPRC(firm)i,j,t
Where TI = nominal expenditures on investments in training, HTR = total hours spent training per worker, C is the cost of an hour’s training and PRC is the proportion of training
costs borne by firms. Hourly costs C will have two elements, the direct costs of training
(costs of running courses or external fees) and the opportunity costs of the time foregone due
to time spent training. Time away from production is valued at the market wage, as in
Jorgenson and Fraumeni (1992). In this analysis hourly costs were estimated as:
(2) Ci,j,t DRwadj
Information on hourly direct costs (DR) was taken from the Eurostat Continuous
Vocational Training Surveys (CVTS) surveys, which were carried out in 1999 and 2005,
averaged across the two years to take account of small sample sizes. We used the variable ‘the ratio of direct to opportunity costs (wages)’ in these surveys. This variable is available by
country and industry. Examination of the data suggests that these ratios vary significantly
across industry so we calculate just two ratios for each country, dividing into production
industries (NACE C to F) and market services (NACE G to K and O). The first component in
equation (2) was estimated as the average labour compensation of employees, taken from EU
KLEMS, multiplied by the ratio of direct to opportunity costs from CVTS.
2
10
The second term in the hourly costs equation is the opportunity cost. This is set equal
to the average wage but adjusting for the composition of those being trained; data are again
taken from EU KLEMS. Due to small samples we estimate proportions trained by skill, age
and gender groups for the two broad sectors, production industries and market services, and
we apply the average proportion for 2003-2007 to all years. In most countries the proportions
of workers with university degrees or equivalent is higher for those trained than for
employment so this adjustment is positive. The one exception appears to be Italy. The
adjustments are positive for both production industries and market services but much lower in
the latter reflecting the relatively greater employment of females in services industries. On
average, taking account of the characteristics of those trained leads to an upward adjustment
of the opportunity cost terms by 10%-15% for EU15 countries and by closer to 25% for new
member states.
Finally, in a measure of intangible investments by firms it is important to exclude any
cost borne by the workers themselves. Although there is no direct evidence on this it is
assumed that it can be proxied by the extent to which training occurs during working hours.
Training occurring outside usual hours arguably has zero opportunity cost for the firm;
therefore PRC (firm) is estimated as the proportion of respondents who replied that training
occurred entirely or mostly during working hours.3
Table 2 presents intangible investments as a share of value added, averaged across the
years 2003-2007. In the EU15, intangible investments in training represent 1.55 of GDP.
These investments represent a lower share of production industry value added than in market
services. Table 2 also shows the results for individual countries, sorted from highest to lowest
for the total market economy. It shows the UK as the country most willing to spend on
3
This variable was not reported for a few countries, most notably Germany and Spain. The EU15 average
11
training. In general intangible investment in training is a lower share of GDP in smaller
[image:12.595.105.490.123.467.2]countries but the share is much smaller for Italy than other large EU15 countries. .
Table 2. Intangible investments in Training as a % of GDP, average 2003-07 Market
Economy
Production Industries
Market Services
EU15 0.98 0.86 1.06
UK 2.45 2.21 2.57
Denmark 1.62 1.45 1.74
Sweden 1.40 1.15 1.58
Finland 1.24 1.01 1.46
Netherlands 1.14 0.75 1.37
France 1.12 1.32 1.02
Luxembourg 0.71 0.48 0.78
Germany 0.67 0.60 0.71
Spain 0.65 0.60 0.69
Austria 0.65 0.54 0.72
Belgium 0.44 0.47 0.43
Ireland 0.21 0.15 0.28
Portugal 0.16 0.12 0.18
Italy 0.11 0.13 0.10
Greece 0.05 0.04 0.05
In order to estimate the impact of these investments on productivity it is necessary to
convert investment values to volumes and construct capital stocks. As both the direct and
indirect components of the hourly costs vary with wages through time it seems natural to use
an earnings index as a deflator. In all such exercises the perpetual inventory method that
cumulates investments and deducts depreciation is employed to convert real investments to
capital stocks. The most common assumption employed on the form of the depreciation
function is geometric decay – this is largely due to the relative simple calculations this entails.
If we let I denote investment, K denote capital and d the depreciation rate, geometric decay
allows capital at time t to be estimated as:
12
Geometric decay implies that proportionally more of the asset is depreciated early in
its use. It is common in the intangibles literature to employ relatively high depreciation rates
to take account of the idea that many of these investments are associated with new
technologies that change rapidly. In this study we employ a 25% depreciation rate -
sensitivity of the estimates to this assumption is discussed below.
Table 3 shows growth in training intangible capital stocks and its contribution
to value added growth. The results suggest that intangible capital growth from on the job
training was strong in the period since 2001 and was higher in market services than in
production industries. To place this in perspective the growth rate of real tangible physical
capital for the market economy in the EU15 was only 2.65% per annum in the same period.4
The contribution of intangible training capital in the EU15 is small but significant. This
compares to 0.20 percentage point contribution from labour composition which in turn is
mainly driven by up-skilling of the workforce arising from general education. In a number of
countries, namely, Denmark, Spain, Finland, France, the Netherlands, Sweden and the UK
these high growth rates translate into small but significant contributions to value added growth (see O’Mahony (2010) for details by country and broad sector.
4
This number refers to the aggregate across countries for whom growth accounts were available in EUKLEMS
and includes some intangible capital in the form of software. See O’Mahony and Timmer (2009) for more
13
Table 3. Intangible Training capital and output growth, 2001-2007, Market economy
Growth in intangible training capital (% p.a.)
Contribution of intangible training capital to value added growth1
Market Economy
EU15 5.56 0.06
Production industries
EU15 3.71 0.03
Market Services
EU15 6.52 0.06
1. Growth from column 1 times share in value added.
While these ‘growth accounting’ estimates can yield a ‘ball park’ figure for the
contribution of training capital to value added growth, they suffer from a number of deficiencies, as discussed in O’Mahony (2010). In particular they are dependent on the
market clearing assumptions underlying all such exercises and cannot take account of
complementarities between inputs. We now turn to an econometric analysis of the impact of
training and links with ICT.
5.
Training and Productivity: Econometric Analysis
5.1 Empirical specification and methods
In this section we model labour productivity as depending on capital inputs including
both tangible and intangible components. The following log form equation for labour
productivity (lnlp) is estimated for both measures of training:
( ) ( ) ( ) ( ) ( )
( )
where ln(intkh)cit is intangible training capital per hour as measured in the previous section, in
industry i, (i=1…11), of country c, (c=1..14), in year t, (t=1995…2007). Control variables
14
j measures of characteristics of the labour force labcharcitj.5 Country, industry and time
dummies are used to control the unobservable time-invariant effects and the business cycle.
Our regressions are weighted by average employee compensation (COMP) share of each
industry over the period 1995-2007, a standard approach in the literature to take account of
industry heterogeneity (see e.g. Kahn and Lim, 1998). Equation (4) is estimated first with just
intangible training capital included, and then with the training-ICT interaction term.
We compare the results from this specification with one where the measure of training
is the proportion of workers receiving training (tr), the specification employed in many
previous papers such as Deardon et al. (2006). This measure does not take account of
duration of training or the composition of those trained and so suffers from being a relatively
crude measure.
We then need to consider whether our estimates are subject to endogeneity bias, i.e.
the possibility that training and the unobserved error term in equation (4), ecit, are likely to be
correlated. To get around this problem, we need instruments to isolate the exogenous
variation in training. The most widely-used alternative strategy is to use generalized method
of moments (GMM) as developed by Arellano and Bond (1991) for dynamic panels. This
method employs lagged values as instruments and has been used, for example, by Black and
Lynch (2001) and Deardon et al. (2006) when addressing similar issues of the impact of
5
The labour characteristics included are proportions of males (male), age below 29 (age<29), age between 29
and 49 (age29-49), medium educated workers with certificates below degree (Ed_medium) and highly educated
workers with degree equivalent or above (Ed_high). We also tried an aggregated labour composition index
estimated as the difference between wage share weighted and employment share weighted hours worked that
distinguishes gender, age and qualification levels, a standard measure used in growth accounting. As this did
not change the coefficients on the other variables in the equations we report the results including the proportions
of workers of various types, which are free of the marginal productivity assumptions underlying the growth
15
workplace and practices and training on productivity to those covered in this paper. However
recent literature has shown that there are possible statistical problems associated with the
above approach. When the regressors are persistent it can be shown that lagged levels of the
explanatory variables are weak instruments. Asymptotically, the use of weak instruments
implies that the variance of the coefficient increases and in small samples the coefficients can
be biased (Staiger and Stock 1997, Durlauf et al. 2005, MacDonald et al. 2010).
Lagged values are often used due to the lack of ‘cross section’ instruments. A more
satisfactory approach might be to use variables that capture features of the labour markets
that differentiate industries as instruments. However the dataset underlying the training
measures is also a rich source of information on the underlying labour markets which might
also serve as valid instruments. Therefore, we included four additional variables from EU
LFS that describe the labour market conditions in each industry. Our choice of which
variables to employ as instruments was guided by the analysis of the same dataset by
Carmichael and Ercolani (2010) who examined the determinants of training propensities, as
well as data availability by country, industry and time. We sought variables that previous
analysis suggested were correlated with training but whose variation across industry was
largely determined by historically given conventions on modes of production and the use of
flexible work practices. Four variables were chosen as possible measures of workplace
practices: hmwk (employees who work at home), satsunwk (employees who work on
Saturday or Sunday), pt (employees who are part time workers), and y1unem (employees who
were unemployed one year ago). Thus we rely on variation across industry in the extent to
which flexible working predominates as the exogenous factors. Instrument validity tests are
employed to determine which, if any, of these instruments can be used in our analysis.
Average values of the instrumental variables by country and year are calculated and
16
UK and Denmark tend to have high proportions of their workforce who work at home, at
weekends or part-time, but low proportions of workers unemployed one year ago. Differences
in labour market institutions across countries might affect labour productivity directly and so
affect the validity of our chosen instruments. However such institutions tend to be slow to
change and so may not impact on the validity of our instruments in the short time period
covered in this paper. Our choice of which of these instruments to employ are determined by
statistical tests as discussed further below.
5.2 Industry Panel Data
The econometric analysis combines the training proportions and intangible training
capital with data on output and inputs from EU KLEMS. The analysis in this section uses
data for 14 of the EU15 group of countries, with Greece omitted due to lack of data on ICT
capital. The panel data employed in this analysis cover eleven industries, five of which are
production sectors; agriculture, forestry and fishing (AtB), Mining and quarrying (C)
manufacturing (D), Electricity, gas and water supply (E), Construction (F), and six of which
are providers of services; Trade (G), Hotels and restaurants (H), Transport, storage and
communication (I), Financial intermediation (J), renting and business activities (K excluding
real estate), and Other community, social and personal services (O). We exclude the
non-market sectors of as the Public admin and defence (L), Education (M) and Health and Social
work (N), given well known problems in estimating output of these sectors. All variables are
transformed into US dollars by using price ratios for outputs and inputs developed by Inklaar
and Timmer (2008). Hence, all productivity and wage variables in regressions are comparable
17
5.3 OLS results
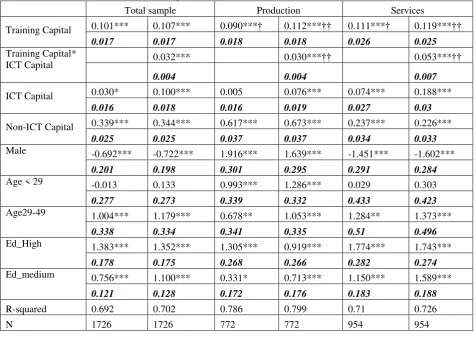
Results for the total sample are presented in Table 4 using the OLS estimator.
Training has a large positive impact on labour productivity both on its own and interacted
with ICT. Since the coefficient of training-ICT interaction term is significant for total sample,
the interaction specification could be a better estimation method than the specification of
training capital alone. Note the coefficient on intangible training capital is much higher than
the growth accounting results presented earlier. These results are consistent with Hempell and Zwick’s (2008) argument that ICT fosters product and process innovations by facilitating
employee participation, which is enhanced by horizontal employee communication and ICT
training.
We next explore the impact of training when we divide the sample into production
industries (the five industries covered by NACE AtB-F) and market services (the six
industries covered by NACE G-K, O). These show similarly positive and significant direct
impacts from training and from training interacted with ICT, but the latter is much larger in
market services than in production industries. We test the equality of coefficients of
intangible training capital (and training-ICT interaction term) in the production and services
sectors using the Chi2 statistics in the Seemingly Unrelated Estimation (SUEST, Weesie
1999). Chi2 statistics show that coefficients of intangible training capital in the specification
of intangible training capital alone are not significantly different in both sectors (chi2 =0.22).
However, intangible training capital and training-ICT interaction term jointly have
significantly different coefficients in both sectors (chi2 =5.36). Thus, the division of two
sectors is necessary for our estimation.
At the end of Table 4, the marginal effects of training variable are interpreted
conditionally on the interaction with ICT capital (Friedrich 1982). We follow Dreher and
Gassebner (2007) and Potrafke (2009) evaluating the marginal effects at various points of the
18
interacted variable (log form ICT capital per hour, i.e. lncapith).6 Using this method we can
distinguish between the impact of training on labour productivity when the levels of ICT
capital are low and high. For the total sample, the marginal effect of training capital at the 5th
percentile of ICT capital is significantly positive. An increase in the training capital by 1%
increases the labour productivity by about 0.067%, consistent with the growth accounting
magnitudes reported in Table 3 above. At the maximum level of ICT capital, the effect of
training is also significantly positive and very large: an increase in the training capital by 1%
increases the labour productivity by about 0.324%. The marginal effects of training capital
conditional on ICT capital increase faster in services than in the production sector, suggesting
[image:19.595.71.548.375.712.2]a stronger association with ICT capital.
Table 4. Regression Results. OLS, Intangible training capital, 1995-2007 (Country, Industry and Year dummies included in all regressions)
Total sample Production Services
Training Capital
0.101*** 0.107*** 0.090***† 0.112***†† 0.111***† 0.119***††
0.017 0.017 0.018 0.018 0.026 0.025
Training Capital* ICT Capital
0.032*** 0.030***†† 0.053***††
0.004 0.004 0.007
ICT Capital
0.030* 0.100*** 0.005 0.076*** 0.074*** 0.188***
0.016 0.018 0.016 0.019 0.027 0.03
Non-ICT Capital
0.339*** 0.344*** 0.617*** 0.673*** 0.237*** 0.226***
0.025 0.025 0.037 0.037 0.034 0.033
Male -0.692*** -0.722*** 1.916*** 1.639*** -1.451*** -1.602***
0.201 0.198 0.301 0.295 0.291 0.284
Age < 29 -0.013 0.133 0.993*** 1.286*** 0.029 0.303
0.277 0.273 0.339 0.332 0.433 0.423
Age29-49 1.004*** 1.179*** 0.678** 1.053*** 1.284** 1.373***
0.338 0.334 0.341 0.335 0.51 0.496
Ed_High 1.383*** 1.352*** 1.305*** 0.919*** 1.774*** 1.743***
0.178 0.175 0.268 0.266 0.282 0.274
Ed_medium
0.756*** 1.100*** 0.331* 0.713*** 1.150*** 1.589***
0.121 0.128 0.172 0.176 0.183 0.188
R-squared 0.692 0.702 0.786 0.799 0.71 0.726
N 1726 1726 772 772 954 954
6
We use the 5th percentile to replace the minimum ICT capital, which is an extremely small value (less than
19
Marginal effects of training proportions at percentile levels of ICT capital
Total sample
ln (ICTcapital) 5%(-1.23) 25% (-0.05) 50% (0.57) 75% (1.17) 95% (2.12) Max (6.81)
Marginal effects
0.067*** 0.105*** 0.125*** 0.144*** 0.174*** 0.324***
0.017 0.017 0.017 0.018 0.019 0.034
Production
Marginal effects
0.075*** 0.110*** 0.129*** 0.147*** 0.176*** 0.317***
0.017 0.018 0.018 0.019 0.021 0.038
Services
Marginal effects
0.054** 0.116*** 0.149*** 0.180*** 0.230*** 0.478***
0.026 0.025 0.026 0.027 0.030 0.056 Notes: Standard errors are below coefficients. ***, ** and * denote significance at 1%, 5% and 10% levels, respectively.
† Coefficients of intangible training capital in the specification of intangible training capital alone are not significantly different in both sectors (SUEST): chi2 (1) =0.22, Prob>chi2=0.643.
†† Coefficients of intangible training capital and training-ICT interaction term are significantly different in both sectors (SUEST): chi2 (2) = 5.36, Prob > chi2 = 0.069.
It is interesting to compare these results with those using the proportions of the
workforce who receive training as this is the measure most commonly employed in previous
research – the results are shown in Appendix Table A.2. These show that when labour
productivity is regressed on training alone the results were insignificant. When training is
interacted with ICT capital the coefficient on interaction becomes significantly positive,
suggesting an important role for training when combined with ICT investments but suggests
little or no benefit of training not linked to the new technology. The results for the production
industries in Table A.2 suggest that training on its own has a large significant impact on
output and this is not dependent on the use of ICT capital. In contrast, in market services
training appears only to impact positively on output when combined with ICT use, with the
direct effect having an implausibly large negative coefficient. Chi2 statistics show significant
different effect of training capital between the production and services in both specifications.
Measuring the impact of intangible training as an investment decision by firms is a
conceptually more satisfactory when examining links with other firm level decisions such as
the use of ICT, than a crude measure of proportions of the work force trained. Thus, we
20
additional robustness tests to the underlying measurement framework. Estimates of intangible
training capital were also estimated using alternative assumptions on the depreciation rates
and deflators (e.g. using the 40% depreciation rate and GDP deflator employed by Corrado,
Hulten and Sichel, 2005) but the results in Table 4 were not appreciably altered. Therefore
we conclude that the results are not especially sensitive to the methods employed to convert
investments to capital stocks.
5.4 Instrumental variables estimates
Although the fixed-effects estimator corrects for the omitted-variable bias associated
with unobserved time-invariant factors in the cross section estimation, the fact that current
values of training may be simultaneously determined with output can lead to biased estimates
(Black and Lynch 2001). 7 We first considered correcting for these potential biases using
conventional GMM techniques with lagged values as instruments for training (see Table A.3.
in Appendix). Endogeneity tests (C chi-square statistic) indeed confirm that intangible
training capital is endogenous. Hansen J tests of over-identification do not reject the validity
of our instruments. Compared with the OLS results, the GMM estimates lead to higher and
significant coefficients of intangible training capital. This increase in the coefficients implies
a greater impact of training on output, both the direct effect and the impact through
interaction with ICT, than the coefficients reported in Table 4. Again impacts are higher in
market services than production, especially for the interaction with ICT capital. The marginal
effects of training capital conditional on the interaction with ICT capital are always
significantly positive and stronger than in OLS.
As argued above the use of lagged values as instruments may not adequately deal with
the endogeneity issue due to persistence of the regressors. The extremely high F test values in
7
See Card (2001) for a theoretical treatment of the interpretation of instrumented variables and the practical
21
the first stage regressions reported in Table A.3. reveal the persistence problem and cast
doubt on lagged values as legitimate instruments. We therefore tried the work practices
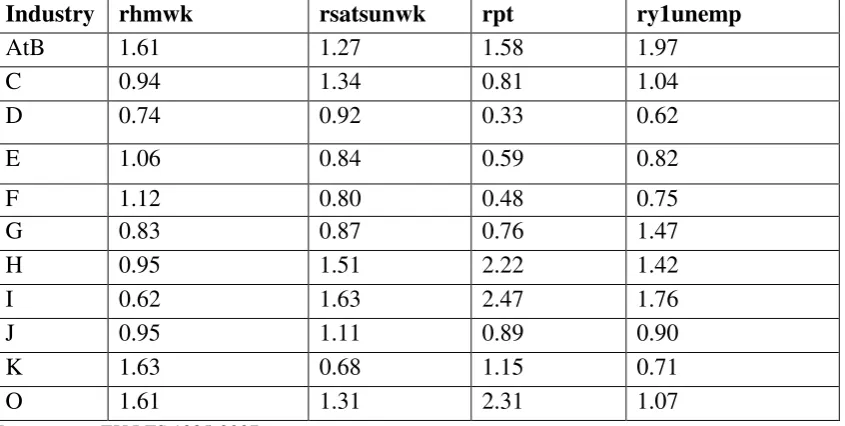
instruments described earlier in this paper and tested their validity. First, in order to reduce
the cross-country heterogeneity of instrumental variables, we transform these variables into
relative variables in our regressions, that is, industry level ratios to the country average.
Average relative instrumental variables (over the period of 1995-2007) by industry are
presented in Appendix Table A.4. Employees in the industries of Agriculture, forestry and
fishing (AtB), renting and business activities (K excluding real estate), and other community,
social and personal services (O) are more likely to work at home than other industries; Hotels
and restaurants (H), Transport, storage and communication (I) and Other community, social
and personal services (O) have higher proportions of weekend workers and part timers;
Agriculture, forestry and fishing (AtB) and Transport, storage and communication (I) have
higher workers being unemployed one year ago. Our choice of which of these instruments to
employ are determined by statistical tests as discussed further below.
Secondly, we apply the Generalized IV method country by country to overcome the
possible over-identification and heteroscedasticity problem. This is a 2 Stage Least Square
(2SLS) procedure. In the first stage, we regress training intangible capital on instruments and
get the 1SLS estimator by country. Then we calculate the predicted values of training
intangible capital for each country. In order to avoid the predicted values of training
intangible capital are distorted by large industries such as manufacturing, we drop weights in
the first stage and use unweighted estimation of coefficients to predict training intangible
capital. Hence, the variable of training intangible capital can be decomposed into two
components: a linear combination of instruments (predicted training intangible capital) and a
random component. In stage 2, we estimate equation (4) using the predicted training
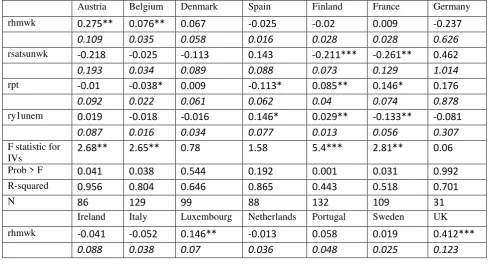
22
in Table 5. We find the linear combination of instruments fit training intangible capital quite
well in Austria, Belgium, Finland, France, Luxembourg, the Netherlands, Portugal, Sweden
and the UK. The F statistics for IVs are significant in these countries. However, predictions
of training intangible capital are also seriously affected by the missing values of four
instruments in the EU LFS data for three countries: Germany (all four instruments are only
available after 2002), Ireland (Y1unem missing after 1997) and the Netherlands (6 years of
Satsunwk and Y1unemp missing).8 In order to test the validity of IVs in the first stage
regressions country by country, we stack the 14 country-specific regressions using SUEST
again and test whether coefficients of these IVs significantly different from zero. The Chi2
test easily reject the hypothesis that the four IVs are not significantly associated with training
capital: chi2(56) = 277.49, Prob > chi2 = 0.0000. Hence, we regard these four work practices
[image:23.595.69.561.417.688.2]variables are valid instrumental variables for training capital.
Table 5 GIV first stage regression by country (Industry and Year dummies included)
Austria Belgium Denmark Spain Finland France Germany
rhmwk 0.275** 0.076** 0.067 -0.025 -0.02 0.009 -0.237
0.109 0.035 0.058 0.016 0.028 0.028 0.626
rsatsunwk -0.218 -0.025 -0.113 0.143 -0.211*** -0.261** 0.462
0.193 0.034 0.089 0.088 0.073 0.129 1.014
rpt -0.01 -0.038* 0.009 -0.113* 0.085** 0.146* 0.176
0.092 0.022 0.061 0.062 0.04 0.074 0.878
ry1unem 0.019 -0.018 -0.016 0.146* 0.029** -0.133** -0.081
0.087 0.016 0.034 0.077 0.013 0.056 0.307
F statistic for IVs
2.68** 2.65** 0.78 1.58 5.4*** 2.81** 0.06
Prob > F 0.041 0.038 0.544 0.192 0.001 0.031 0.992
R-squared 0.956 0.804 0.646 0.865 0.443 0.518 0.701
N 86 129 99 88 132 109 31
Ireland Italy Luxembourg Netherlands Portugal Sweden UK
rhmwk -0.041 -0.052 0.146** -0.013 0.058 0.019 0.412***
0.088 0.038 0.07 0.036 0.048 0.025 0.123
8
Our choice of which of these instruments to employ are determined by statistical tests as in the first step
regressions. As a robustness check, we also tried dropping of those insignificant instrumental variables in the
23
rsatsunwk -0.195 -0.061 0.271** 0.797* -0.098 -0.106*** -0.12
1.568 0.137 0.107 0.424 0.08 0.04 0.203
rpt 1.742** 0.034 -0.004 0.768** -0.06 0.005 -0.052
0.7 0.076 0.086 0.315 0.045 0.029 0.039
ry1unem -0.409 -0.048 -0.033 -0.110* -0.073 0.01 -0.025
0.261 0.069 0.068 0.055 0.062 0.017 0.031
F statistic for IVs
1.99 0.7 3.8*** 3.57** 2.43* 2.05* 8.05***
Prob > F 0.180 0.596 0.009 0.025 0.055 0.098 0.000
R-squared 0.052 0.508 0.463 0.013 0.287 0.883 0.599
N 33 143 77 44 111 98 132
Notes: Standard errors are below coefficients. ***, ** and * denote significance at 1%, 5% and 10% levels, respectively. Control variables include ICT and non-ICT capital per hour, proportions of males (male), age below 29 (age<29), age between 29 and 49 (age29-49), medium educated workers with certificates below degree (Ed_medium) and highly educated workers with degree equivalent or above (Ed_high).
The SUEST Chi2 test: null hypothesis (all IVs are not significantly associated with training capital in 14 countries), chi2(56) = 277.49, Prob > chi2 = 0.0000.
Finally, we put predicted training intangible capital (and its interaction with ICT
capital) into equation (4). Results of the second stage are presented in Table 6. The results
using these instruments yield lower coefficients values on the direct training measures in the
OLS estimates and Table A.3., but very similar to the growth accounting results. Training
capital alone and interaction with ICT capital are still significantly positive in all regressions
except the last column, lower than in the OLS results and again more prominent for
training*ICT interaction term in the service sector. The marginal effects of training capital
conditional on ICT capital confirm our findings in OLS and GMM. For the total sample:
while the effect of training is insignificant at the 5th percentile of ICT capital, at the 25th
percentile of ICT capital, the effect of training is positive and significant. An increase in the
training capital by 1% increases the labour productivity by about 0.042%. After that, the
marginal effects of training become higher as ICT capital increases and becomes 0.278% at
the maximum value of ICT. The marginal effects of training in the production sector are
positive and significant (but insignificant in services) at low levels of ICT capital. Similarly,
as ICT capital increases, the positive marginal effects of training in both sectors become
24
suggesting more benefit from the links to ICT capital. Therefore, the GIV estimation using
work practices instruments shows that indeed training, especially complemented with ICT
capital have positive and large impacts on labour productivity. In summary, the results
employing instrumental variables suggest that the OLS estimates if anything overestimate the
impact of training on labour productivity, especially through its interaction with ICT.
Table 6. Regression Results. GIV second stage, Intangible training capital, 1995-2007 (Country, Industry and Year dummies included in all regressions)
Total sample Production Services Linear prediction of
Training Capital
0.045*** 0.039*** 0.067***† 0.071***†† 0.056***† 0.016††
0.007 0.008 0.008 0.008 0.012 0.016
Linear prediction of Training Capital * ICT Capital
0.009** 0.008*†† 0.028***††
0.004 0.004 0.007
ICT Capital 0.033* 0.045** 0.024 0.031* 0.055* 0.110***
0.018 0.019 0.016 0.016 0.032 0.035
Non-ICT Capital
0.282*** 0.276*** 0.560*** 0.579*** 0.147*** 0.149***
0.03 0.03 0.038 0.039 0.042 0.042
Male -0.458** -0.461** 1.733*** 1.675*** -0.974*** -1.111***
0.231 0.23 0.298 0.299 0.34 0.338
Age < 29 0.601* 0.572* 0.627* 0.690** 0.262 0.301
0.31 0.31 0.338 0.339 0.484 0.479
Age29-49 1.524*** 1.505*** 0.376 0.497 1.945*** 1.826***
0.377 0.376 0.338 0.343 0.578 0.573
Ed_high 2.138*** 2.104*** 2.249*** 2.063*** 2.579*** 2.651***
0.226 0.226 0.309 0.323 0.351 0.348
Ed_medium 1.083*** 1.201*** 0.782*** 0.865*** 1.785*** 2.041***
0.128 0.137 0.17 0.175 0.199 0.208
R-squared 0.707 0.708 0.82 0.821 0.725 0.73
N 1333 1333 601 601 732 732
Marginal effects of training capital at a minimum and maximum level of ICT capital. Total sample
ICT Capital 5%(-1.23) 25% (-0.05) 50% (0.57) 75% (1.17) 95% (2.11) Max (6.81) Marginal effects 0.001 0.042*** 0.063*** 0.084*** 0.116*** 0.278***
0.009 0.007 0.008 0.009 0.012 0.032
Production
Marginal effects 0.029*** 0.063*** 0.080*** 0.097*** 0.123*** 0.256***
0.009 0.008 0.008 0.009 0.011 0.029
Services
Marginal effects -0.021 0.052*** 0.090*** 0.127*** 0.185*** 0.475***
0.015 0.012 0.012 0.015 0.020 0.055
[image:25.595.71.551.235.749.2]25
† Coefficients of training proportions in the specification of training proportions alone are not significantly different in both sectors (SUEST): chi2 (1) =0.47, Prob>chi2=0.495.
†† Coefficients of intangible training capital and its interaction with ICT capital are significantly different in both sectors (SUEST): chi2 (2) = 9.51, Prob > chi2 = 0.0086.
We tried a number of variants as sensitivity tests for the GIV results. We first fitted
training intangible capital using estimation based on a pooled sample of all countries. This
estimation suggests a strong assumption that there is no cross-country heterogeneity in
training capital’s associations with instrumental variables. It is highly unlikely from our Chi2
tests using the SUEST. Moreover, the F test of IVs shows a weak fit even with much larger
sample size than country by country estimation (F tests 2.42, Prob > F =0.0465) which is
lower than the reference F test level (around 10) in Staiger and Stock (1997). In second stage
regression, the fitted training capital alone from the first stage regressions of all countries is
insignificantly associated with labour productivity, while the training*ICT interaction terms
are still positive and significant. We also tried more specifications with country*year,
country*industry dummies in the first stage regressions for the pooled sample of all countries
to test country-specific business cycle or country*industry fixed effects. All specifications
with country*year or country*industry dummies gave much higher (and unrealistic) 2nd stage
coefficients maybe due to loss of too many degrees of freedom. Therefore, we think our main
results are not overstating the case.
6.
Conclusions
This paper linked the microdata underlying the EU LFS to industry data from EU
KLEMS to examine links between productivity and workforce training. Modelling training
activities as intangible investments by firms allows us to compare the extent of these
investments across countries. The econometric analysis suggests training has a significantly
positive impact on productivity, especially when combined with investment in ICT. This is
consistent with a recent literature that emphasises the role of organisational changes and
26
sample into production and service sectors highlights some interesting differences. The
results suggest that firm specific intangible investments may be more important in services
than in production industries, when interacted with ICT. It therefore is important to caution
against drawing too strong conclusions based on estimates for the aggregate economy alone.
Returning to Europe’s poor productivity record relative to the US, the results here are
suggestive that failure to capture intangible inputs and their interactions with information
technology may go some way towards providing an explanation. Existing estimate show that
levels of ICT capital and overall intangible inputs are much higher in the US than in most
European countries. The results here suggest these inputs might explain most of the
difference in growth performance. However we have to be cautious in drawing such
conclusions since in this paper we only attempt to measure one form of intangible input;
27
Table A.1 EU LFS based Instruments, per cent of employees Average 1995-2007
Country hmwk satsunwk pt y1unemp
Austria 9.7 40.7 12.7 1.4
Belgium
6.5 30.1 14.4 2.5
Denmark 10.6 44.0 16.1 1.8
Spain
0.5 32.5 4.8 8.0
Finland 7.0 35.0 9.5 3.9
France
3.3 43.0 11.2 4.0
Germany 5.2 46.5 13.3 2.4
Ireland
4.9 55.9 11.3 3.5
Italy 2.0 46.3 7.3 5.7
Luxembourg
4.2 34.8 9.9 1.6
Netherlands 1.1 38.3 29.9 1.4
Portugal
2.6 36.4 2.8 3.5
Sweden 4.1 32.7 15.6 2.9
UK
18.7 63.1 17.7 2.2
28
Table A2. Regression Results, OLS, Training proportions, 1995-2007 (Country, Industry and Year dummies included in all regressions)
Total sample Production Services
Training proportion
-0.32 -1.948*** 0.996***† 0.796**†† -0.559† -3.541***††
0.281 0.315 0.35 0.361 0.388 0.426
Training proportion * ICT Capital
0.946*** 0.232**†† 1.720***††
0.092 0.106 0.134
ICT Capital
0.043*** -0.036** 0.011 -0.01 0.084*** -0.067**
0.016 0.017 0.016 0.019 0.027 0.028
Non-ICT Capital
0.345*** 0.378*** 0.617*** 0.623*** 0.243*** 0.276***
0.026 0.025 0.037 0.037 0.035 0.032
Male -0.786*** -0.987*** 1.866*** 1.834*** -1.382*** -1.743***
0.201 0.196 0.301 0.301 0.294 0.272
Age < 29 0.03 -0.333 0.948*** 0.986*** -0.02 -0.377
0.28 0.274 0.339 0.339 0.438 0.405
Age29-49 0.955*** 0.311 0.672** 0.667** 1.217** -0.583
0.34 0.336 0.34 0.339 0.517 0.497
Ed_High 1.356*** 1.554*** 1.197*** 1.185*** 1.755*** 1.998***
0.178 0.174 0.27 0.269 0.284 0.263
Ed_medium
0.912*** 1.312*** 0.484*** 0.616*** 1.354*** 1.791***
0.119 0.122 0.17 0.18 0.178 0.167
R-squared 0.686 0.704 0.781 0.782 0.705 0.75
N 1749 1749 795 795 954 954
Marginal effects of training proportions at percentile levels of ICT capital Total sample
ln (ICTcapital) 5%(-1.23) 25% (-0.05) 50% (0.57) 75% (1.17) 95% (2.12) Max (6.81)
Marginal effects
-3.12*** -1.99*** -1.41*** -0.84*** 0.05 4.50***
0.38 0.32 0.29 0.28 0.27 0.54
Production
Marginal effects
0.51 0.79** 0.93*** 1.07*** 1.29*** 2.37***
0.41 0.36 0.35 0.35 0.37 0.72
Services Marginal effects
-5.66*** -3.62*** -2.56*** -1.53*** 0.10*** 8.17***
0.53 0.43 0.39 0.37 0.36 0.77 Notes: Standard errors are in parentheses; ***, ** and * denote significance at 1%, 5% and 10% levels, respectively.
† Coefficients of training proportions in the specification of training proportions alone are not significantly different in both sectors (SUEST): chi2 (1) =4.57, Prob>chi2=0.033.
29
Table A3. Regression Results. GMM, Intangible training capital, 1995-2007 (Country, Industry and Year dummies included in all regressions)
Total sample Production Services
Training Capital 0.319*** 0.318*** 0.329*** 0.406*** 0.413*** 0.507***
0.05 0.048 0.065 0.063 0.085 0.094
Training Capital*ICT Capital
0.056*** 0.054*** 0.127***
0.009 0.01 0.02
ICT Capital 0.060** 0.164*** 0.008 0.121*** 0.164*** 0.386***
0.023 0.028 0.018 0.025 0.05 0.06
Non-ICT Capital 0.277*** 0.297*** 0.560*** 0.667*** 0.172*** 0.152***
0.036 0.035 0.058 0.073 0.04 0.043
Male -0.781** -0.789** 1.884*** 1.447*** -2.106*** -2.170***
0.311 0.309 0.359 0.359 0.413 0.466
Age < 29 -0.062 0.084 1.209*** 1.600*** 0.244 0.867
0.388 0.384 0.438 0.418 0.714 0.744
Age29-49 1.977*** 1.853*** 1.403*** 1.901*** 3.253*** 2.590***
0.479 0.474 0.395 0.386 0.78 0.823
Ed_high 1.208*** 1.286*** 0.986** 0.389 1.701*** 1.853***
0.28 0.284 0.448 0.48 0.373 0.411
Ed_medium 0.237 0.923*** -0.363 0.321 0.622 1.535***
0.302 0.32 0.31 0.331 0.398 0.438
R-squared 0.656 0.656 0.74 0.711 0.666 0.601
N 1258 1258 562 562 696 696
First stage F test: Training Capital
103.94 *** 92.39*** 34.02*** 24.65*** 43.69*** 43.32***
Training
Capital*ICT Capital
1232.16*** 495.94*** 410.64***
C chi-sq statistic 32.87*** 37.84*** 21.53*** 29.05*** 27.46*** 37.77***
Chi-sq P-val 0 0 0 0 0 0
Hansen J statistic 0.36 4.33 0.14 0.66 0.58 4.31 Chi-sq P-val 0.55 0.11 0.71 0.72 0.45 0.12 Marginal effects of training capital at percentile levels of ICT capital.
Total sample
Ln(ICT capital) 5%(-1.23) 25% (-0.05) 50% (0.57) 75% (1.17) 95% (2.11) Max (6.81) Marginal effects 0.249*** 0.315*** 0.349*** 0.383*** 0.436*** 0.698***
0.045 0.048 0.051 0.053 0.058 0.091
Production
Marginal effects 0.340*** 0.404*** 0.437*** 0.470*** 0.521*** 0.774***
0.062 0.062 0.064 0.065 0.069 0.097
Services
Marginal effects 0.350*** 0.501*** 0.579*** 0.656*** 0.776*** 1.374***
0.084 0.094 0.101 0.108 0.121 0.201
[image:30.595.73.549.98.708.2]30
Table A.4 Relative instruments by industry, ratios to country average, 14 countries average over 1995-2007
Industry rhmwk rsatsunwk rpt ry1unemp
AtB 1.61 1.27 1.58 1.97
C 0.94 1.34 0.81 1.04
D 0.74 0.92 0.33 0.62
E 1.06 0.84 0.59 0.82
F 1.12 0.80 0.48 0.75
G 0.83 0.87 0.76 1.47
H 0.95 1.51 2.22 1.42
I 0.62 1.63 2.47 1.76
J 0.95 1.11 0.89 0.90
K 1.63 0.68 1.15 0.71
O 1.61 1.31 2.31 1.07
Data source: EU LFS 1995-2007.
References
Acemoglu, Daron (1998). “Why do new technologies complement skills? Directed technical
change and wage inequality.” Quarterly Journal of Economics, 113, 4, 1055-1089.
Arellano, Manuel, and Stephen Bond (1991). “Some Tests of Specification for Panel Data: Monte Carlo Evidence and an Application to Employment Equations.” Review of
Economic Studies, 58, 2, 277-97.
Autor, David H, Lawrence F Katz, and Alan B Krueger (1998). “Computing Inequality: Have Computers Changed the Labour Market?” Quarterly Journal of Labour
Economics, 113, 4, 1169-1213.
Baldwin, Timothy T, and J. Kevin Ford (1988). “Transfer of Training: A Review and Directions for Future Research.” Personnel Psychology, 41, 1, 63-105.
Baldwin, John, Wulong Gu, Amélie Lafrance, and Ryan Macdonald. (2008), “Intangible
31
expenditures.” paper presented to the 2008 IARIW conference, Slovenia, Statistics
Canada.
Bartel, Ann P, and Frank R Lichtenberg (1987). “The Comparative Advantage of Educated Workers in Implementing New Technologies.” Review of Economics and Statistics,
69, 1, 1-11.
Bartel, Ann P (1994). “Productivity Gains from the Implementation of Employee Training Programmes.” Industrial Relations, 33, 4, 411-425.
Baum, Christopher F, Mark E Schaffer, and Steven Stillman (2003). “Instrumental variables and GMM: Estimation and testing,” Stata Journal, StataCorp LP, vol. 3, 1, 1-31.
Bertschek, Irene, and Ulrich Kaiser (2004). “Productivity effects of organisational change: Microeconometric evidence.” Management Science, 50, 3, 394-404.
Black, Sandra E, and Lisa M Lynch (1996). “Human capital investments and productivity.”
American Economic Review, 86, 2, 263-267.
Black, Sandra E, and Lisa M Lynch (2001). “How to Compete: The Impact of Workplace
Practices and Information Technology on Productivity.” The Review of Economics
and Statistics, 83, 3, 434-445.
Bresnahan, Timothy F, Erik Brynjolfsson, and Lorin M Hitt (2002). “Information
Technology, Workplace Organization, and the Demand for Skilled Labor: Firm-Level Evidence.” Quarterly Journal of Economics, 117, 1, 339 – 376.
Brynjolfsson, Erik, Lorin M Hitt, , and ShinkYu Yang (2002). “Intangible Assets: Computers and Organisational Capital.” Brookings paper on Economic Activity, 1,
137-181.
32
Carmichael, Fiona, Marco Ercolani, Lili Kang, Yasheng Maimaiti, Mary O’Mahony, Fei
Peng, and Catherine Robinson (2009). “Education, Training and Productivity.” Report
for the European Commission, University of Birmingham
Carmichael, Fiona, and Marco Ercolani (2010). “Age-training gaps in the European Union:
Evidence from the European Labour Force Surveys 2004-2007.” Paper presented at
CREW conference, University of Birmingham
Conti, Gabriella(2005). “Training, productivity and wages in Italy.” Labour Economics, 12,
4, 557-576.
Corrado, Carol, Charles Hulten, and Daniel Sichel (2005). “Intangible Capital and Economic
Growth.Measuring capital and technology: an expanded framework in C. Corrado, C.
Hulten and D. Sichel eds, Measuring Capital in the New Economy, Studies in Income
and Wealth Vol. 65, Chicago, The University of Chicago Press.
Corrado, Carol, Charles Hulten, and Daniel Sichel (2006). “Intangible Capital and Economic Growth.” NBER Working Paper 11948.
Dearden, Lorraine, Howard Reed, and Johnvan Reenen (2006). “The Impact of Training
on Productivity and Wages: Evidence from British Panel Data.” Oxford Bulletin of
Economics and Statistics, 68, 4, 397-421.
Dreher, Axel, and Martin Gassebner (2007). “Greasing the wheels of entrepreneurship? The impact of regulations and corruption on firm entry.” CESifo Working Paper No 2013.
Durlauf, Steven N, Paul A Johnson, and Jonathan R. W Temple (2005). “Growth
Econometrics.” in: Philippe Aghion & Steven Durlauf (ed.), Handbook of Economic
Growth, edition 1, volume 1, chapter 8, pp 555-677, Elsevier