Munich Personal RePEc Archive
Study Time and Scholarly Achievement
in PISA
Kuehn, Zoe and Landeras, Pedro
Universidad Autónoma de Madrid, Fundación de Estudios de
Economía Aplicada (FEDEA)
September 2012
Study Time and Scholarly Achievement in PISA
∗Zo¨
e Kuehn
†Pedro Landeras
‡This version: September 2012
Abstract
We take a different look at the PISA 2006 data considering time input as one of the main ingredients for scholarly achievement. Across countries there does not exist any clear relationship between total time spent studying (sum of class time, homework time and time spent in private lessons) and scholarly achievement, while more individual study time (homework time or private lessons) seems to relate negatively to scholarly achievement. On the other hand at the country level, bet-ter performing students are clearly the ones spending more time in class and doing homework. However, when considering different groups of students, this positive re-lationship breaks down. For instance girls, students with a migratory background, and in some countries private school students spend more time doing homework but perform worse. In order to establish a causal relationship between time input and educational output we estimate a production function for education controlling for students’ individual characteristics and different school environments. Results show that while the productivity of additional study time varies across countries, more classes and to a lesser extent more time spent doing homework have a positive effect on scholarly achievement while the effect of private lessons is negative or at most insignificant
JEL classification: I21, I21, Z13
Keywords: PISA, time input, effort, scholarly achievement, family background, school environment, causal effects
∗This paper is part of a research project funded by the Fundaci´on Ram´on Areces within their 10th
Social Science National Competition 2011. We would also like to thank Ainhoa Aparicio Fenoll, Raquel Vegas and Brindusa Anghel. We are very grateful to all participants at the XX Meeting of the Economics of Education Association in Porto.
†zoe.kuehn@ccee.ucm.es·Universidad Complutense·Departamento de Econom´ıa Cuantitativa·
Cam-pus de Somosaguas·28223 Madrid·Spain.
‡planderas@fedea.es · Fundaci´on de Estudios de Econom´ıa Aplicada (FEDEA). C./ Jorge Juan, 46.
1
Introduction
Various international programs for assessing educational systems (TIMMS - Trends in In-ternational Mathematics and Science Study, PISA -Programme for InIn-ternational Student Assessment, etc.) have shown that countries that spend similar amounts on education do very differently in terms of educating their young generations. This is important given that as Hanushek and Woessmann [2010] point out, there exists a positive relation be-tween trend economic growth and trend in scholarly achievement. In this sense, Spain’s performance gives reason to worry. Despite the fact that Spain’s expenditure in primary and secondary education is very similar to the OECD average, the performance of Spanish students in all PISA studies has been below average (see OECD [2010], OECD [2007], OECD [2004a] y OECD [2004b]).1
However, expenditure is just one of many possible ingredients for the production of education.
This papers focuses on time spent studying as one of the main ingredients to learning and educational outcomes. We present an empirical cross-country study using data from the “Program for International Student Assessment” (PISA) in which we analyze students’ study time (class time, homework time, and time spent in private lessons), possible in-terdependencies with aspects of students’ school environments and family backgrounds, and the causal effect of study time on scholarly achievement. Since the pioneering work of Schultz [1960], Becker [1962], and Ben-Porath [1967] who first formulated a production function of education with time as the central input factor, there have been important advances in the theory of the production of education.2
Apart from considering individual student effort as key to scholarly achievement these advances have suggested interdepen-dencies of effort with aspects of family background and school environment. Considering the latter for instance, Correa and Gruver [1987] analyze the interplay between teachers and students in a game-theoretical framework. De Fraja and Landeras [2006] show that an increase in incentives and in the efficiency in competition among schools can result in a decrease in effort by students. On the other hand, regarding the relation between effort and family background, the model by Lin and Lai [1996] shows that if leisure is a normal good and students are paid monetary rewards for their achievement they exert less effort. Kuehn and Landeras [2012] shows that the way individual effort and family background
1
In 2008, Spain’s and the average OECD member country’s spending on every primary (secondary) student was equal to 20% (26%) and 20% (27%) of their respective GDP per capita, Worldbank [2011].
2
interact, is related to the student’s degree of risk aversion. In Albornoz et al [2011], effort exerted by students, parents, and teachers is increasing in the average ability in the class room.
However, while effort and time spent studying constitute the centerpieces for many the-oretical papers on education, a large part of the empirical literature has ignored the relationship between time input and achievement in education. Instead, the focus has been on the direct influence of aspects of school environment on scholarly achievement. Numerous studies have compared teacher-student ratios, the way schools are funded, com-petition among schools, different pedagogical methods, class size, quality of teachers, etc. in order to explain differences in scholarly achievement. Evidence on the effects of most of these variables is mixed. Studying the relation between class size and scholarly achieve-ment for instance, Bressoux et al [2004] and Angrist and Lavy [1999] find that larger class size affects educational outcomes clearly negatively while Woessmann and Fuchs [2008] or Anghel and Cabrales [2010] do not find any strong effects. Results in Rivkin et al [2005] or Aaronson et al [2007] seem to indicate the importance of teachers’ quality rather than class size. Gibbons et al [2008] on the other hand consider the effect of competition among schools on scholarly achievement and find it to be neglectably small, while Hoxby [2000] estimates it to be positive and significant. The fact that these and many other empirical studies do not take into account time spent studying is to a large extent due to data limitations. In the TIMSS study for instance, teachers instead of students report infor-mation about homework time, turning the variable homework time into an estimate by teachers of the time needed for homework assigned, rather than a measure of study time by students. In addition, a lack of good instruments in other data sets makes it difficult to address problems of unobserved ability and reversed causality that typically arise when regressing homework time on scholarly achievement.
of effort by students, parents, and schools. The authors test their model empirically using British data and find parents’ effort to be more decisive for student’s achievement than students’ own effort or schools’ effort. Stinebrickner and Stinebrickner [2008] use infor-mation on college roommates who own computer games or video consoles as instruments for individual study time and find that more study time can make up for lower ability, measured by scores in college entrance exams. Another interesting paper is Metcalfe et al [2011] who use an exogenous increase in the value of leisure due to international football tournaments every other year to estimate the effect of a resulting reduction in effort on students’ achievement.
Our paper is also related to the empirical literature that uses data from the “Progam for International Student Assessment” (PISA) to explain differences in educational out-comes. Using data from PISA 2000, Fuchs and W¨oßmann [2007] estimate a linear edu-cation production function for the sample of all participating countries and find that in particular institutional factors of a country’s educational system can account for differ-ences in a student’s performance. Regarding the below-average performance in PISA of Spanish students, Ciccone and Garcia-Fontes [2008] find that average low parental edu-cation of Spanish students can in part explain this result. Also related to the current paper is Lavy [2010] who considers PISA 2006 data and focuses on time spent in class rooms to explain differences in educational outcomes across countries. Using information on instructional time per subject and PISA scores for each subject the author performs within-student estimations and finds the effect of one additional hour of class time to be significantly positive and to be larger in developed than in developing countries. Different from the current paper however, the author does not consider time spent studying outside the classroom.
Among those works that include the variable individual study time are de Bortoli and Cresswell [2004] who compare PISA 2000 results for Aborigine and Non-Aborigine stu-dents in Australia and find a positive relationship between time spent doing homework and scholarly achievement for both groups, with Aborigine students obtaining worse re-sults that might partly be due to fewer hours of homework. Looking at Canadian PISA data, Frempong and Ma [2006] confirm a positive relationship between time spent doing homework and scholarly achievement. The OECD [2008] quantifies the positive relation-ship between homework time and scholarly achievement at a 3.1 percentage points higher PISA score in science for students at schools with one extra hour of science homework per week. A report by the OECD [2011] with a special focus on students’ study time finds that “beyond four hours a week they [students] do not necessarily perform better in proportion to the time they spend [studying]” (pg.13). This OECD report is closely related to the results of the first part of the current paper and the descriptive
tics provided. However, different from the current paper, the OECD report particularly emphasizes different ways of out-of-school learning time, while its analysis does not go beyond that of descriptive statistics. Among the few comparative analysis are Kotte et al [2005] who reject the hypothesis that differences in scholarly achievement between Spanish and German students can be explained by differences in time spent doing home-work. Rindermann and Ceci [2009] analyze results of the first three PISA studies and find that across countries individual student effort (homework time) is negatively related to scholarly achievement. The authors thus propose two distinct interpretations of student effort: i) on the individual level where homework time has a positive effect on cognitive growth, and ii) on the country level where a lot of homework time indicates low quality of educational institutions that instead of internalizing, delegate an important part of the learning process towards parents and students.3
However, none of these works that include the variable individual study time, present more than mere correlations, nor do they address problems of unobserved ability or reversed causality, making it impossible to interpret their findings as causal.
Hence, to the best of our knowledge, the current paper is the first one to focus on stu-dents’ individual effort, i.e. time spent studying outside the classroom, as a central input factor to scholarly achievement and to attempt to establish a causal relationship between time input and educational outcomes, employing PISA 2006 data. The current paper thus contributes to a better understanding of one of the key determinants for scholarly achievement: individual study time. For our analysis we focus in particular on seven OECD countries, Spain, the three best performing countries (Finland, Canada, and Ko-rea), and the three lowest ranked countries (Mexico, Greece, and Turkey). The remainder of the paper is organized as follows. We first present the PISA 2006 data set and pro-vide some descriptive statistics for the seven countries considered. Section 3 presents a descriptive analysis of time input to education and students’ individual effort and its interdependencies with various aspects of family background and school environment. In Section4we estimate a production function for education, instrumenting homework time and time spent in private lessons for a particular subject by homework time and time spent in private lessons for another subject. Section 5concludes.
3
2
Data
Data base For our analysis we use data from the “Progam for International Student Assessment” (PISA), administered by the OECD. PISA tests students of age 15, indepen-dently of the grade they are in. Test subjects are reading, maths, and science. In addition, PISA administers individual student questionnaires, school questionnaires, and in some countries parent questionnaires gathering information not only on students’ performance but also on their study habits, interests, family background, and school environment. PISA was carried out in 2000, 2003, 2006, and 2009. While, the first three PISA stud-ies all include the variable time spent studying reported by students, only PISA 2006 provides information for weekly class time, homework time, and time spent studying in private lessons separate for each subject. This is why we use PISA 2006 data for our analysis.
In 2006, PISA tested samples of around 4,000 to 30,000 students in all 30 OECD countries, as well as in 27 non-OECD countries. For most of our analysis we restrict our attention to results from seven countries: Spain, as well as the three best (Korea, Finland, Canada) and the three worst performing OECD countries (Mexico, Greece, Turkey).4
Thirteen dif-ferent test booklets containing difdif-ferent combinations of all three subjects were designed and assigned randomly to approximately 35 students in selected schools. While not all students were tested in all three subjects, all students were asked to solve some exercises related to the focus subject of PISA 2006, science.5
Apart from time spent studying we also consider students’ individual characteristics as gender, age, migrant status, and if the student has repeated a grade. Regarding students’ parental background we focus on variables like highest parental occupation among both parents and most years of schooling among both parents, as well as all information available on household possessions. We also consider if students attend public or privately owned schools.
4
In the sample of these seven countries, the parent questionnaire was only administrated in Korea and Turkey. Hence we do not use any information from this questionnaire.
5
However, all students are assigned scores for all subjects because as is important to note, PISA scores are estimated values, so called plausible values that contain students’ test scores as well as background information from questionnaires. These scores are meant to reflect the distribution of students’ perfor-mance in a country rather than a student’s individual perforperfor-mance. For each student and each subject PISA reports five plausible values (PVs) which implies that for a correct representation of the under-lying distribution means and coefficients have to be estimated five times while standard deviations and errors are means of 80 differently weighted estimators (see OECD [2009] for the exact description of the technical procedure involved). We have done so for all statistics except our estimation in Section4.
Descriptive Statistics Table2.1 provides descriptive statistics from PISA 2006 for all seven countries considered as well as the OECD average. In Finland, Korea, Turkey, and Greece around 4,000-5,000 students in around 150-200 schools participated in PISA 2006. Spain, Canada, and Mexico requested larger samples and hence around 20,000 to 30,000 students in approximately 600-1200 schools took the PISA 2006 test in these countries.6
Regarding the performance of students, Finish students did best in maths and science, while Korean students ranked first in reading and second in maths. Canadian students came second in maths and third in reading. Mexican students were ranked last in all sub-jects, while Turkish and Greek students came in second last and third last respectively.7
As mentioned before Spanish students were ranked below OECD average in all subjects, 24th in maths, 23rd in science, and 26th in reading.
Time students spend studying maths, science, language and other subjects in class, at home, or in private lessons varies widely across countries. While Finish students spend around 14 hours per week in class, Canadian students spend on average more than 17 hours studying in class.8
Average time spent doing homework ranges from more than eight and a half hours in Turkey, to slightly more than five hours per week in Finland. Considering private lessons, again Finish students are the ones reporting least weekly time spent studying in private lessons (1.8 hours), while Greek students report almost eight hours of private lessons per week. There is also a large variation in the number of students who have repeated a grade. In Spain, Mexico and Turkey over 40% of students have repeated at least one grade, while in Korea this phenomenon applies to only around 2% of students.9
About half of all students are girls. Given that PISA tests 15 years olds independently of the grade they are in, we observe relatively little variation in age. The share of students who are first or second generation immigrants also varies across countries. In Canada around 21% of students have a migratory background and in Greece and Spain approximately 7% of students are first or second generation immigrants. On the other hand, in Finland, Turkey, Korea, and Mexico this was the case for less than 3% of students.
6
The number of students corresponds to the number of participating students less those excluded for non-eligibility, physical, mental, or linguistic reasons. Exclusion percentages are less than 1% in Turkey, Mexico, Korea, around 1.3% in Greece, 2.8% in Spain and Finland and 7.4% in Canada.
7
Note that in PISA 2006, results for US students in reading were declared invalid, hence results for reading are only published for 29 OECD countries.
8
Note that in order to obtain continuous time variables we followed the OECD [2011] report and recoded students’ answers in the following way: ’No time’ -0; ’less than two hours’ - 1; ’between 2 and 4 hours’ - 3; ’between 4 and 6 hours’ - 5 and ’6 and more hours’ - 7.
9
Table 2.1: Descriptive Statistics PISA 2006: Weighted Means(weighted Std.)
Countries: Spain Finland Korea Canada Mean OECD Mexico Turkey Greece Mean Score[OECD Rank]
Maths 480(2.33) [24] 548(2.30) [1] 547(3.76) [2] 527(1.97) [5] 484(1.15) 406(2.93) [30] 424(4.90) [29] 459(2.97) [28] Science 488(2.57) [23] 563(2.02) [1] 522(3.36) [7] 534(2.03) [2] 491(1.17) 410(2.71) [30] 424(3.84) [29] 473(3.23) [28] Reading 461(2.23) [26] 547(2.15) [2] 556(3.81) [1] 527(2.44) [3] 484(1.04) 410(3.06) [29] 447(4.21) [28] 460(4.04) [27] Average Study Time (total all subjects)
Class 13.67(0.12) 14.24(0.14) 16.55(0.15) 17.38(0.15) 14.80(0.05) 14.51(0.13) 14.88(0.20) 13.09(0.15) Homework 7.83(0.10) 5.17(0.08) 6.59(0.09) 7.15(0.14) 7.32(0.04) 8.47(0.11) 8.61(0.11) 7.83(0.10) Private Lessons 2.95(0.07) 1.78(0.05) 6.16(0.10) 3.46(0.06) 3.82(0.03) 4.49(0.10) 7.26(0.10) 7.76(0.13) Individual Characteristics
Students who have repeated grades 40.12% 4.99% 2.02% 14.98% 6.73%** 43.63% 43.72% 16.74% Girls 49.44% 50.35% 49.30% 49.74% 49.55% 51.88% 45.30% 49.74% Age 15.82(0.07) 15.65(0.01) 15.76(0.01) 15.84(0.00) 15.78(0.00) 15.68(0.01) 15.90(0.01) 15.72(0.00) Migrants (1st & 2nd generation) 6.92% 1.55% 0.02% 21.15% 9.06% 2.41% 1.49% 7.55% Parental Background
High White Collar 40.00% 56.47% 67.74% 66.60% 53.63% 32.85% 36.13% 53.97% Low White Collar 26.28% 27.17% 17.75% 21.81% 24.83% 22.25% 15.53% 18.61% High Blue Collar 23.30% 11.16% 9.50% 6.01% 13.24% 23.85% 35.51% 16.85% Low Blue Collar 10.42% 5.21% 5.02% 5.59% 8.30% 21.05% 12.82% 10.57% Years of Schooling 11.12(0.11) 14.46(0.05) 13.25(0.06) 14.76(0.04) 12.87(0.03) 10.42(0.12) 8.59(0.12) 13.24(0.10) Posses Desk (no response rate%) 98.19%(0.62%) 94.60%(0.30%) 97.76%(0.14%) 87.15%(2.57%) 88.98% (1.41%) 79.08% (2.60%) 84.09%(0.79%) 96.00%(0.90%) Posses Classical Literature (no resp.%) 69.71%(1.11%) 54.39%(0.83%) 71.98%(0.35%) 41.86%(3.1%) 52.73%(2.56%) 49.88%(3.27%) 65.40%(1.05%) 76.98%(1.52%) Posses Educational Software(no resp.%) 52.32%(1.77%) 40.69%(1.21%) 62.23%(0.99%) 64.80%(3.2%) 53.01%(2.89%) 30.12%(4.00%) 24.87%(1.72%) 34.87%(4.78%) Have more than 1 TV (no resp.%) 91.61%(0.66%) 87.80%(0.28%) 61.30%(0.33%) 91.65%(2.43%) 84.68%(1.05%) 67.71%(1.01%) 50.10%0.38%) 89.91%(0.64%) School Environment
Private Schools 35.39% 2.99% 46.35% 7.27% 14.45% 14.98% 2.32% 5.18% Number of Schools 686 155 154 896 9,093* 1,140 160 190 Number of Students 19,047 4,579 5,172 20,965 242,402* 30,922 4,941 4,808
*Total OECD; ** does not include US, as entry dates for primary school vary by state.
Considering students’ parental background, PISA suggests a division of occupational sta-tus according to the ISCO-88 classification adopted by the International Labor Organi-zation [1990].10
Across all countries considered, there are more students with high white collar background than any other occupational background. However, while this applies to more than 60% of students in Canada and Korea, only slightly more than 30% of students in Mexico and Turkey come from a high white collar background. On the other hand, in Spain, Turkey, and Mexico more than 30% of students come from a blue collar background, compared to less than 15% of students in Canada and Korea. Regarding individual and household possessions, in all seven countries around 80-90% of students own a desk and more than half of all households own more than one TV. Between 40-70% of students own some works of classical literature while one fourth to two thirds own educational software.11
School environments also differ across countries, with private schools being more important in Spain, Korea, and Mexico compared to Finland, Turkey, or Greece.
3
Time Input to Education
Citing Ben-Ponrath [1967] ” It is hard to think of forms of human capital that the individ-ual can acquire as final goods-he has to participate in the creation of his human capital.” (p.352); How much time do 15 years old spend creating their human capital?.
Time spent studying across countries For our analysis of students’ time input to education we distinguish between time in class, time spent doing homework, and private lessons. Table3.2contains country means of absolute values and fractions of weekly study time for each of the three subjects.
10
According to this division, individuals with occupations as legislators, senior official, managers, professionals, technicians, and associate professionals are considered as belonging to the high white collar group. Those working as clerks, service workers and market sales workers are grouped as low white collar individuals. Occupations such as skilled agricultural and fishery workers and craft and related trades workers are classified as high blue collar jobs. Individuals working as plant and machine operators and assemblers or in elementary occupations are regarded as low blue collar workers.
11
Table 3.2: Average Study Time
Average Weekly hours(std.) dedicated to: [% of total study time]:
Class Homework Private Lessons Total
Mathematics
Spain 3.42(0.03) [58%] 1.96(0.03) [30%] 0.99(0.02) [13%] 6.28(0.06) Finland 3.45(0.04) [71%] 1.20(0.02) [23%] 0.37(0.02) [6%] 4.98(0.06) Korea 4.70(0.05) [57%] 2.31(0.07) [22%] 2.28(0.04) [21%] 9.19(0.13) Canada 4.50(0.04) [63%] 1.97(0.03) [26%] 0.94(0.02) [11%] 7.25(0.07) Mean OECD 3.89(0.01) [57%] 1.97(0.01) [29%] 1.07(0.01) [16%] 6.83(0.02) Mexico 3.94(0.03) [55%] 2.26(0.03) [32%] 1.18(0.03) [14%] 7.22(0.06) Turkey 3.82(0.06) [51%] 2.31(0.05) [32%] 2.08(0.05) [27%] 8.07(0.14) Greece 3.45(0.04) [49%] 2.00(0.03) [25%] 2.23(0.05) [26%] 7.55(0.10)
Science
Spain 3.12(0.04) [59%] 1.74(0.03) [31%] 0.68(0.02) [11%] 5.44(0.07) Finland 3.13(0.04) [71%] 1.07(0.02) [23%] 0.32(0.01) [6%] 4.49(0.06) Korea 3.58 0.06) [67%] 1.22(0.06) [19%] 1.02(0.04) [14%] 5.78(0.13) Canada 4.00(0.04) [66%] 1.55(0.03) [26%] 0.55(0.01) [9%] 5.96(0.06) Mean OECD 3.21(0.02) [60%] 1.56(0.01) [29%] 0.70(0.01) [13%] 5.37(0.02) Mexico 3.15(0.04) [49%] 2.12(0.03) [37%] 1.00(0.03) [15%] 6.11(0.07) Turkey 2.86(0.09) [51%] 1.64(0.05) [28%] 1.35(0.05) [21%] 5.77(0.18) Greece 3.18(0.05) [48%] 1.85(0.04) [26%] 1.99(0.04) [26%] 6.88(0.10)
Reading
Spain 3.60(0.03) [61%] 1.89(0.03) [27%] 0.58(0.02) [12%] 5.97(0.05) Finland 3.13(0.05) [71%] 1.13(0.02) [23%] 0.36(0.01) [6%] 4.60(0.07) Korea 4.48(0.04) [66%] 1.40(0.03) [17%] 1.45(0.04) [17%] 7.25(0.09) Canada 4.43(0.04) [66%] 1.74(0.03) [24%] 0.86(0.02) [11%] 6.89(0.06) Mean OECD 3.84(0.01) [60%] 1.78(0.01) [28%] 0.92(0.01) [14%] 6.44(0.02) Mexico 3.73(0.04) [55%] 2.06(0.03) [31%] 1.10(0.03) [15%] 6.72(0.07) Turkey 3.99(0.05) [55%] 2.18(0.05) [26%] 1.81(0.05) [23%] 7.87(0.12) Greece 3.18(0.04) [51%] 1.94(0.03) [28%] 1.63(0.03) [22%] 6.62(0.08)
While in Spain students spend on average a total of around 6 hours per week studying mathematics and language, in some countries with better scholarly achievement (Korea and Canada) students spend more time studying these subjects while in others (Finland) they spend less time. On the other hand, in the three worst ranked OECD countries (Mexico, Turkey, and Greece) students spend more time studying math, science, and reading than Canadian, Finish or Spanish students.12
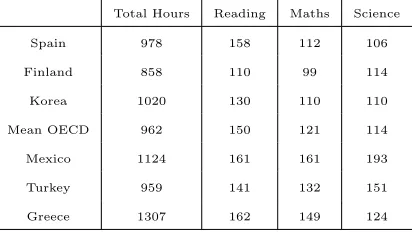
Hence, no clear relationship be-tween time input and educational outcome across countries seems to exist. Scatter plots relating PISA 2006 results and average weekly total time spent studying (sum of time in class, doing homework and in private lessons) displayed in Figure 3.1 confirm that this observation holds across all 57 countries that participated in PISA 2006. If at all, there is a slightly negative relationship, with countries in which students report higher average study time obtaining worse PISA 2006 results in science. However, numbers in Table3.2 refer to weekly hours of classes, not taking into account differences in the length of school year across countries, i.e. that in some countries schools operate during more weeks per year than in others countries. Taking into account this information and thus considering total instruction time per year does not alter the overall picture. There is no clear relationship between average instruction time per year and scholarly achievement across countries. Spanish and Finish students receive about the same amount of weekly science classes but given additional school weeks in Finland, Finish students receive more total science lessons per year. On the other hand, Korean students spend more time per week in class rooms, but during the course of the year they receive less reading and maths classes compared to Spanish students. Considering students in worst ranked countries like Mexico and Greece we observe that they receive more maths, science, and reading classes per week and also per year.13
However, when we take a look at how students divide their total study time among class time, homework time, and private lessons, a clear cross-country relationship arises. Students in better performing countries (Canada, Korea) receive more than four and a half hours per week of maths and language classes, compared to fewer than 4 hours per week in Mexico, Turkey, and Greece. While Finland seems to be an exception, if instead of considering absolute time, we look at shares of study time spent in class, Finish students turn out to be very similar to Canadian and Korean students. Students in these three countries spend around 60-70% of their study time in the classroom. Compared to worse-ranked countries, these students from better performing countries hence seem to spend on average a larger fraction of their total study time in the classroom.14
Across all
12
We also consider statistics for the average OECD using national student weights and considering the OECD one big country.
13
See TableA-1.2of the AppendixA-1for average instruction times per year.
14
Figure 3.1: Country Average Total Time Spent Studying and Average PISA Score Maths R2 = 0.0019 0 1 2 3 4 5 6 7 8 9 10
200 250 300 350 400 450 500 550 600
Science
R2 = 0.1587
0 1 2 3 4 5 6 7 8 9
200 250 300 350 400 450 500 550 600
Reading R2 = 0.0111 0 1 2 3 4 5 6 7 8 9 10
200 250 300 350 400 450 500 550 600
countries that participated in PISA 2006 we observe a clearly positive relationship between the average fraction of study time spent in the classroom and the country’s PISA 2006 result, see Figure 3.2. Differentiating between absolute and relative time spent in the classroom, the OECD [2011] suggests a division of countries into four groups relative to the average OECD, (i)countries where students spend more relative and absolute time in the classroom (Korea, Canada), (ii) countries where students spend less absolute but more relative time in the classroom (Finland, Spain), (iii) countries where students spend more absolute but less relative time in the classroom (Turkey, Mexico), and (iv) countries where students spend less absolute and less relative time in the classroom (Greece). Regarding homework time and private lessons, students in better performing countries spend less absolute and relative time doing homework and receiving private lessons compared to students in worse-ranked countries (see Figures A-1and A-2 of the AppendixA-1). This observation is in line with findings by Rindermann and Ceci [2009] who report a negative cross-country correlation of -0.22 between average time spent doing homework and PISA test scores.
Country correlations study time and achievement On the other hand, at the country level, contrary to our cross-country findings we observe positive correlations
be-spend a lot of time in private lessons, see Kim and Lee [2010] for a study on private tutoring in Korea.
Figure 3.2: Country Average Fraction of Total Time Spent Studying in Class and Average PISA Score Maths R2 = 0.5172 0 0.1 0.2 0.3 0.4 0.5 0.6 0.7 0.8
200 250 300 350 400 450 500 550 600
Science R2 = 0.5956 0 0.1 0.2 0.3 0.4 0.5 0.6 0.7 0.8 0.9
200 250 300 350 400 450 500 550 600
Reading R2 = 0.6528 0 0.1 0.2 0.3 0.4 0.5 0.6 0.7 0.8 0.9
200 250 300 350 400 450 500 550 600
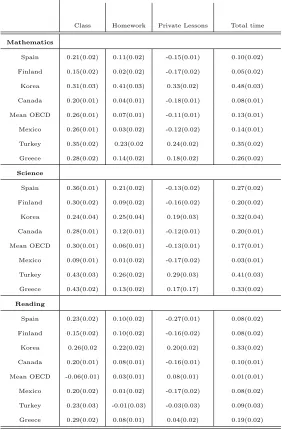
tween homework time and scholarly achievement as well as total time input and achieve-ment. Regarding the latter, correlations for all subjects between scholarly achievement and total time input, range from 0.3 and larger in Korea, to correlations between 0.14 and 0.03 in Mexico (see Table 3.3). Differentiating among the three types of time inputs reveals a positive relation for all countries between class time and scholarly achievement and time spent doing homework and scholarly achievement, and a negative relationship between hours of private lessons and achievement, with the exception of Korea. Correla-tions for class time and achievement are similar across countries and lie in the range of 0.2 - 0.3. There is greater variation considering correlations between homework time and achievement, ranging from 0.4 to 0.01. In Korea, Spain, Greece, and Turkey (with the exception of the subject reading) correlations between homework time and achievement are relatively higher compared to other countries.15
Negative correlations between private lessons and achievement lie in the range of around -0.15 and are most likely due to the fact that in most countries students of low ability are more likely to attend private lessons more frequently than high ability students.
15
Table 3.3: PISA 2006: Correlations between Study Time and PISA Scores
Correlation PISA test score and weekly hours dedicated to(Std.):
Class Homework Private Lessons Total time
Mathematics
Spain 0.21(0.02) 0.11(0.02) -0.15(0.01) 0.10(0.02) Finland 0.15(0.02) 0.02(0.02) -0.17(0.02) 0.05(0.02) Korea 0.31(0.03) 0.41(0.03) 0.33(0.02) 0.48(0.03) Canada 0.20(0.01) 0.04(0.01) -0.18(0.01) 0.08(0.01) Mean OECD 0.26(0.01) 0.07(0.01) -0.11(0.01) 0.13(0.01) Mexico 0.26(0.01) 0.03(0.02) -0.12(0.02) 0.14(0.01) Turkey 0.35(0.02) 0.23(0.02 0.24(0.02) 0.35(0.02) Greece 0.28(0.02) 0.14(0.02) 0.18(0.02) 0.26(0.02)
Science
Spain 0.36(0.01) 0.21(0.02) -0.13(0.02) 0.27(0.02) Finland 0.30(0.02) 0.09(0.02) -0.16(0.02) 0.20(0.02) Korea 0.24(0.04) 0.25(0.04) 0.19(0.03) 0.32(0.04) Canada 0.28(0.01) 0.12(0.01) -0.12(0.01) 0.20(0.01) Mean OECD 0.30(0.01) 0.06(0.01) -0.13(0.01) 0.17(0.01) Mexico 0.09(0.01) 0.01(0.02) -0.17(0.02) 0.03(0.01) Turkey 0.43(0.03) 0.26(0.02) 0.29(0.03) 0.41(0.03) Greece 0.43(0.02) 0.13(0.02) 0.17(0.17) 0.33(0.02)
Reading
Spain 0.23(0.02) 0.10(0.02) -0.27(0.01) 0.08(0.02) Finland 0.15(0.02) 0.10(0.02) -0.16(0.02) 0.08(0.02) Korea 0.26(0.02 0.22(0.02) 0.20(0.02) 0.33(0.02) Canada 0.20(0.01) 0.08(0.01) -0.16(0.01) 0.10(0.01) Mean OECD -0.06(0.01) 0.03(0.01) 0.08(0.01) 0.01(0.01) Mexico 0.20(0.02) 0.01(0.02) -0.17(0.02) 0.08(0.02) Turkey 0.23(0.03) -0.01(0.03) -0.03(0.03) 0.09(0.03) Greece 0.29(0.02) 0.08(0.01) 0.04(0.02) 0.19(0.02)
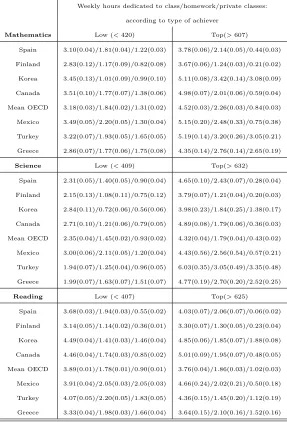
Study time for different achievers In order to further investigate the relationship between study time and ability of students, suggested by the negative correlation be-tween private lessons and achievement, we consider grouping students according to their achievement in PISA 2006. Regarding the distribution of students’ performance, for each subject PISA defines four groups of achievers: low, moderate, strong, and top achievers. We adopt this classification and focus in particular on the two extreme groups, low and top achievers.16
Table 3.4 displays average study time in class, doing homework, and in private lessons for low and top achievers for each subject. In general, top achievers spend more time doing homework than low achievers and they also spend more time in the classroom. However, as suggested by the negative correlation between private lessons and achievement, top achievers clearly spend less time in private lessons than low achiev-ers. However, there are some exceptions. As mentioned before, Korea is an exception regarding a positive relationship between achievement and time spent studying in private lessons. Hence it does not come as a surprise that Korean top achievers spend more time in private lessons compared to low achievers. The same holds true for Turkish and Greek students for the subjects of maths and science. Hence, with the exception of private lessons, numbers of Table 3.4 seem to suggest a clearly positive and almost monotonous relationship between scholarly achievement and time input for all seven countries.
However, when considering how different achievers divide their total study time into time in class, time spent doing homework, and time spent in private lessons, and thus consid-ering relative instead of absolute time spent studying, the relationship between scholarly achievement and time input weakens (see Table A-1.3 of the Appendix A-1). While in most countries, belonging to the top achievement group is associated to a larger fraction of time spent in class, in Korea the relationship is inverted. Regarding all subjects, com-pared to low achievers Korean top achievers spend a smaller fraction of their study time in class and a larger fraction doing homework. In Canada the fraction of time students spend doing homework is constant across different groups of achievers. On the other hand, in Mexico better performing students dedicate a smaller fraction of time to homework than those achieving lower results. Hence, the almost monotonous relationship of time input and achievement only holds when considering absolute amounts of time. When consider-ing fractions of time instead, relationships between time input and educational outcome seem to be quite distinct across countries.
16
Table 3.4: PISA 2006: Study Time and Proficiency Level
Weekly hours dedicated to class/homework/private classes: according to type of achiever
Mathematics Low (<420) Top(>607) Spain 3.10(0.04)/1.81(0.04)/1.22(0.03) 3.78(0.06)/2.14(0.05)/0.44(0.03) Finland 2.83(0.12)/1.17(0.09)/0.82(0.08) 3.67(0.06)/1.24(0.03)/0.21(0.02) Korea 3.45(0.13)/1.01(0.09)/0.99(0.10) 5.11(0.08)/3.42(0.14)/3.08(0.09) Canada 3.51(0.10)/1.77(0.07)/1.38(0.06) 4.98(0.07)/2.01(0.06)/0.59(0.04) Mean OECD 3.18(0.03)/1.84(0.02)/1.31(0.02) 4.52(0.03)/2.26(0.03)/0.84(0.03) Mexico 3.49(0.05)/2.20(0.05)/1.30(0.04) 5.15(0.20)/2.48(0.33)/0.75(0.38) Turkey 3.22(0.07)/1.93(0.05)/1.65(0.05) 5.19(0.14)/3.20(0.26)/3.05(0.21) Greece 2.86(0.07)/1.77(0.06)/1.75(0.08) 4.35(0.14)/2.76(0.14)/2.65(0.19)
Science Low (<409) Top(>632) Spain 2.31(0.05)/1.40(0.05)/0.90(0.04) 4.65(0.10)/2.43(0.07)/0.28(0.04) Finland 2.15(0.13)/1.08(0.11)/0.75(0.12) 3.79(0.07)/1.21(0.04)/0.20(0.03) Korea 2.84(0.11)/0.72(0.06)/0.56(0.06) 3.98(0.23)/1.84(0.25)/1.38(0.17) Canada 2.71(0.10)/1.21(0.06)/0.79(0.05) 4.89(0.08)/1.79(0.06)/0.36(0.03) Mean OECD 2.35(0.04)/1.45(0.02)/0.93(0.02) 4.32(0.04)/1.79(0.04)/0.43(0.02) Mexico 3.00(0.06)/2.11(0.05)/1.20(0.04) 4.43(0.56)/2.56(0.54)/0.57(0.21) Turkey 1.94(0.07)/1.25(0.04)/0.96(0.05) 6.03(0.35)/3.05(0.49)/3.35(0.48) Greece 1.99(0.07)/1.63(0.07)/1.51(0.07) 4.77(0.19)/2.70(0.20)/2.52(0.25)
Reading Low (<407) Top(>625) Spain 3.68(0.03)/1.94(0.03)/0.55(0.02) 4.03(0.07)/2.06(0.07)/0.06(0.02) Finland 3.14(0.05)/1.14(0.02)/0.36(0.01) 3.30(0.07)/1.30(0.05)/0.23(0.04) Korea 4.49(0.04)/1.41(0.03)/1.46(0.04) 4.85(0.06)/1.85(0.07)/1.88(0.08) Canada 4.46(0.04)/1.74(0.03)/0.85(0.02) 5.01(0.09)/1.95(0.07)/0.48(0.05) Mean OECD 3.89(0.01)/1.78(0.01)/0.90(0.01) 3.76(0.04)/1.86(0.03)/1.02(0.03) Mexico 3.91(0.04)/2.05(0.03)/2.05(0.03) 4.66(0.24)/2.02(0.21)/0.50(0.18) Turkey 4.07(0.05)/2.20(0.05)/1.83(0.05) 4.36(0.15)/1.45(0.20)/1.12(0.19) Greece 3.33(0.04)/1.98(0.03)/1.66(0.04) 3.64(0.15)/2.10(0.16)/1.52(0.16)
3.1
Time Input, Family Background, and School Environment
Belonging to a the low or top achievement group is closely related with certain aspects of a student’s family background and school environment. Private school students and children of non-migrant parents with high white-collar occupations are represented more strongly among top achievers than among low achievers. For instance, while more than half of all Spanish top achievers attend private school, only around one third of low achiev-ers do so. In Canada, almost 30% of low achievachiev-ers in science and maths are migrants, while among top achievers, migrants represent only around 20%. Regarding a student’s parental background, in Finland around 70% of top achievers in science or maths own some works of classical literature compared to only around 30% of low achievers, while in Turkey almost 70% of top achievers have parents of high white collar occupations, compared to less than 40% of low achieving students.17
Given such a marked relationship between scholarly achievement and aspects of a student’s family background and school environment the question arises if scholarly achievement is mainly determined by individual time input or if differences in achievement arise because of other factors associated with different aspects of family background and school environ-ment. Put differently: Do children of non-migrant parents with white-collar occupations who attend private schools perform better because they spend more time studying or is their performance due to other factors that differentiate them from working class immi-grants who attend public schools? In case differences in performance turn out to be due to differences in individual time inputs, results of Table3.4could be interpreted as causal. However, mean individual study time (homework time and time spent in private lessons) together with average performance of different groups displayed in Tables 3.5 and 3.6
show that this is generally not the case.
In particular girls tend to spend more time doing maths homework but perform worse. Even though in many countries girls tend to receive fewer private lessons than boys, total individual study time (homework time plus private lessons) of girls in maths tends to be more than that of boys. On the other hand, girls obtain better results in reading than boys but they also tend to dedicate more time to individual study of language. Results for science are mixed. Finish, Korean, Turkish, and Greek girls outperform boys in science but with the exception of Greek girls they also do spend more time in individual science study. We observe a similar phenomenon when comparing students according to their migratory background. Students who are 1st or 2nd generation immigrants tend to spend more time in individual study but perform worse.
17
Table 3.5: PISA 2006: Study time and Individual Characteristics
Weekly hours dedicated to individual study (std) [score]: homework/private lessons by group
Boys Girls Immigrants Natives
Mathematics
Spain 1.74(0.03)/0.93(0.03) [484] 2.18(0.04)/1.06(0.05) [476] 2.00(0.12)/0.89(0.08) [429] 1.96(0.03)/1.00(0.02) [485] Finland 1.12(0.02)/0.42(0.02) [554] 1.29(0.02)/0.32(0.02) [543] 1.40(0.13)/0.76(0.17) [466] 1.20(0.02)/0.36(0.02) [550] Korea* 2.29(0.10)/2.30(0.08) [552] 2.33(0.07)/2.25(0.07) [543]
Canada 1.73(0.04)/0.91(0.03) [534] 2.21(0.04)/0.96(0.02) [520] 2.47(0.08)/1.30(0.05) [524] 1.84(0.02)/0.83(0.02) [531] Mean OECD 1.84(0.02)/1.09(0.01) [489] 2.10(0.01)/1.05(0.01) [478] 2.13(0.04)/1.25(0.03) [458] 1.96(0.01)/1.05(0.01) [489] Mexico 2.21(0.04)/1.25(0.04) [410] 2.31(0.04)/1.11(0.04) [401] 2.40(0.24)/1.43 (0.18) [321] 2.25(0.03)/1.16(0.03) [411] Turkey 2.15(0.05)/1.96(0.05) [427] 2.50(0.07)/2.21(0.07)[421] 1.85(0.37)/1.67(0.49) [456] 2.32(0.05)/2.09(0.05) [425] Greece 2.07(0.05)/2.21(0.07) [461] 1.94(0.04)/2.25(0.06) [457] 1.75(0.10)/1.31(0.10) [424] 2.02(0.04)/2.31(0.06) [463]
Science
Spain 1.53(0.03)/0.67(0.03) [491] 1.95(0.04)/0.69(0.03) [486] 1.76(0.09)/0.64(0.05) [434] 1.73(0.03)/0.68(0.03) [494] Finland 0.97(0.02)/0.36(0.02) [562] 1.17(0.03)/0.29(0.01) [565] 1.12(0.11)/0.52(0.10) [472] 1.07(0.02)/0.32(0.01)[566] Korea* 1.23(0.09)/1.09(0.06) [521] 1.21(0.04)/0.95(0.05) [523]
Canada 1.35(0.03)/0.55(0.02) [536] 1.76(0.03)/0.56(0.02) [532] 2.05(0.06)/0.76(0.04) [524] 1.42(0.02)/0.49(0.01) [541] Mean OECD 1.46(0.01)/0.74(0.01) [492] 1.65(0.01)/0.66(0.01) [490] 1.74(0.03)/0.82(0.02) [457] 1.54(0.01)/0.68(0.01) [497] Mexico 2.05(0.04)/1.07(0.03) [413] 2.19(0.03)/0.95(0.03) [406] 2.21(0.13)/1.63(0.31) [319] 2.13(0.03)/0.98(0.03) [415] Turkey 1.55(0.05)/1.34(0.06) [418] 1.75(0.07)/1.36(0.07) [430] 1.36(0.25)/1.11(0.34) [440] 1.66(0.05)/1.36(0.05) [425] Greece 1.85(0.05)/1.99(0.05) [468] 1.84(0.04)/1.99(0.05) [479] 1.54(0.11)/1.40(0.12) [433] 1.87(0.04)/2.04(0.04) [478]
Reading
Spain 1.64(0.04)/0.63(0.03) [443] 2.14(0.04)/0.53(0.02) [479] 1.89(0.09)/0.83(0.09) [415] 1.89(0.03)/0.56(0.02) [465] Finland 0.95(0.02)/0.36(0.02) [521] 1.32(0.03)/1.83(0.02) [572] 1.22(0.13)/0.75(0.12) [490] 1.13(0.02)/0.36(0.01) [549] Korea* 1.37(0.04)/1.49(0.06) [539] 1.44(0.04)/1.40(0.05) [574]
Canada 1.47(0.03)/0.78(0.02) [511] 2.01(0.03)/0.95(0.03) [543] 2.14(0.07)/1.12(0.05) [523] 1.63(0.02)/0.79(0.02) [532] Mean OECD 1.58(0.01)/0.89(0.01) [466] 1.98(0.01)/0.95(0.01) [502] 1.92(0.04)/1.14(0.03) [455] 1.76(0.01)/0.89(0.01) [488] Mexico 1.96(0.04)/1.15(0.03) [393] 2.14(0.03)/1.06(0.04) [427] 2.19(0.21)/1.36(0.21) [299] 2.06(0.03)/1.09(0.03) [417] Turkey 1.94(0.04)/1.64(0.05) [427] 2.45(0.07)/2.02(0.06) [471] 2.19(0.25)/1.62(0.24) [437] 2.18(0.05)/1.82(0.05) [448] Greece 1.64(0.04)/1.42(0.04) [432] 2.24(0.04)/1.83(0.04) [488] 1.65(0.10)/1.23(0.11) [431] 1.95(0.03)/1.66(0.04) [464]
*For Korea, means for migrants and natives are not considered given that there is only one student in the PISA 2006 sample who is a 2nd generation migrant.
Table 3.6: PISA 2006: Study time, Parental Background and School Environment
Weekly hours dedicated to individual study (std) [score]: homework/private classes by group
bluecollar whitecollar public private
Mathematics
Spain 1.93(0.24)/1.01(0.50) [457] 1.98(0.03)/0.98(0.02) [495] 1.91(0.04)/0.99(0.03) [466] 2.06(0.05)/1.00(0.04) [505] Finland 1.17(0.04)/0.40(0.03) [525] 1.21(0.02)/0.36(0.02) [554] 1.19(0.02)/0.36(0.02) [549] 1.58(0.15)/0.58(0.10) [533] Korea 1.97(0.07)/1.78(0.08) [529] 2.38(0.07)/2.37(0.04) [551] 2.23(0.12)/2.18(0.09) [549] 2.41(0.09)/2.39(0.10) [545] Canada 1.80(0.06)/0.98(0.05) [496] 2.00(0.03)/0.92(0.02) [534] 1.95(0.03)/0.93(0.02) [524] 2.35(0.07)/1.02(0.06) [575] Mean OECD 1.94(0.02)/1.14(0.02) [438] 1.99(0.01)/1.05(0.01) [501] 1.99(0.01)/1.09(0.01) [476] 1.99(0.04)/1.07(0.03) [518] Mexico 2.26(0.05)/1.24(0.05) [383] 2.26(0.03)/1.13(0.04) [428] 2.29(0.03)/1.23(0.03) [398] 2.09(0.06)/0.90(0.06) [448] Turkey 2.19(0.05)/1.88(0.05) [404] 2.43(0.06)/2.30(0.07) [446] 2.30(0.05)/2.06(0.05) [423] 1.62(0.17)/1.28(0.22) [444] Greece 1.78(0.05)/1.80(0.08) [423] 2.09(0.04)/2.40(0.05) [476] 2.00(0.04)/2.25(0.06) [455] 2.12(0.11)/1.83(0.11) [526]
Science
Spain 1.63(0.98)/0.70(0.16) [463] 1.80(0.03)/0.66(0.03) [504] 1.64(0.03)/0.66(0.03) [475] 1.90(0.05)/0.72(0.05) [513] Finland 1.04(0.04)/0.35(0.03) [540] 1.08(0.02)/0.31(0.01) [569] 1.07(0.02)/0.32(0.01) [564] 1.29(0.17)/0.50(0.12) [557] Korea 1.07(0.05)/0.78(0.05) [507] 1.25(0.06)/1.07(0.04) [525] 1.27(0.10)/1.13(0.08) [524] 1.16(0.04)/0.90(0.06) [520] Canada 1.39(0.05)/0.54(0.03) [497] 1.58(0.03)/0.55(0.01) [543] 1.56(0.03)/0.56(0.01) [532] 1.67(0.08)/0.54(0.04) [575] Mean OECD 1.57(0.02)/0.78(0.01) [442] 1.57(0.01)/0.67(0.01) [509] 1.60(0.01)/0.74(0.01) [485] 1.46(0.04)/0.58(0.02) [520] Mexico 2.14(0.05)/1.09(0.04) [388] 2.12(0.03)/0.94(0.04) [432] 2.15(0.03)/1.05(0.03) [402] 2.00(0.07)/0.76(0.06) [450] Turkey 1.55(0.05)/1.16(0.05) [406] 1.75(0.08)/1.55(0.08) [443] 1.64(0.05)/1.35(0.05) [424] 1.62(0.17)/1.28(0.22) [431] Greece 1.63(0.06)/1.67(0.07) [436] 1.93(0.04)/2.11(0.05) [490] 1.83(0.04)/2.01(0.05) [469] 2.11(0.11)/1.66(0.08) [544]
Reading
Two exceptions are Greece and Turkey. In Greece immigrant students spend less time doing homework and perform worse in all three subjects, whereas in Turkey they spend less time doing math or science homework but obtain better results than native students. Different from the comparison between boys and girls, the additional individual study time of immigrant students is clearly due to both more homework time and more private lessons. Hence, when grouping students according to different individual characteristics, the positive relationship between more individual study time (homework time and time in private lessons) and better scholarly achievement cannot be confirmed.
On the other hand, when grouping students according to their parents’ occupation we do observe a positive relationship between more homework time and scholarly achievement (see Table3.6). Children whose parents have a white-collar occupation perform better and they also tend to spend more time doing homework compared to children of blue collar background. While maybe surprisingly, those from blue collar family backgrounds tend to receive more private lessons compared to those from white collar backgrounds. However, in most countries the sum of individual study time (homework time plus private lessons) is on average higher for students from white collar backgrounds. An exception is Mexico where children from white collar backgrounds perform worse in science and maths, but also spend less time in individual study for both subjects. Hence, a positive relationship between individual study time and scholarly achievement is robust to this grouping of students. Regarding aspects of a student’s school environment, in most countries private school students tend to spend more time doing homework and in private lessons than those attending public schools, with these additional hours of time input being associated to better achievement. The relationship does not hold for the case of Mexico, Greece, Korea, and Finland. In the case of Mexico and Greece, private school students spend less time in individual study but perform better than public school students, while in Finland and Korea those attending private schools do worse even though they spend more total time in individual study. Hence, when grouping students according to different individual characteristics, aspects of family background, and school environment the clear relation-ship between time input and educational outcome observed in Table 3.4 breaks down.
4
The Effect of Study Time on Achievement
More individual study time is not necessarily linked to better achievement, as statistics in Tables 3.5 and 3.6 have shown. Other factors such as aspects of family background and school environment seem to play an important role in determining scholarly perfor-mance. In order to estimate the effect of individual study time on educational outcomes
we would like to run a regression of study time on achievement that would allow us to control for these additional factors (individual characteristics, family background, school environment). However, the possibility of reversed causality in the relationship between individual study time and achievement introduces an endogeneity bias and thus invali-dates the use of a simple OLS regression for estimating an education production function. In addition, student ability is an unobserved variable. While we suggest to use as proxies for student ability both a dummy variable indicating if the student has repeated a grade, as well as PISA test results from other subjects, the solution to our main problem of endogenity stemming from reversed causality is less straight-forward.
Given that science was the PISA 2006 subject of focus and hence all students were asked to solve some science exercises, we focus on achievement in science in this section. Ar-guing that time spent studying maths is positively correlated with time spent studying science but is unlikely to influence the student’s PISA science test score we propose to use homework time and time spent in private lessons studying maths as instruments for science study time.18
While abilities to solve math and science problems might be similar, we argue that increasing homework time for maths has no direct effect on PISA science test scores. Following an argument made by J¨urges et al [2005] we check the 77 pub-licly available PISA 2006 science test questions and find that none of them require any maths skills.19
Most questions require extracting information from graphs or short texts. In addition, basic knowledge is required regarding topics such as resistance of species to repeated treatments, cloning, day and night on earth, greenhouse gas emissions, diseases caused by smoking, sun exposure, and unhealthy water, etc.20
However, as we saw before, homework time and private lessons in maths are correlated with PISA maths test scores. In addition, a student’s PISA math test score is likely to be positively correlated with his PISA science test score. Hence, in order to fulfill our instrument’s exclusion restriction we also include the student’s PISA test score for maths into our regression. As mentioned before the student’s math score also serves as a continuous proxy for student ability. In order to account for school heterogeneity we introduce school fixed effects into our regression. We thus specify the following
school-18
Pairwise correlations of homework time and private lessons for the subject of science with hours spent studying maths at home or in private lessons lie between 0.16 and 0.55.
19
J¨urges et al [2005] study how the existence of central exit examinations in some German states affects the difference in results in science and maths items in the TIMSS study. In this context the authors are also concerned about possible spill-over effects from maths to science. We follow their approach to check the publicly available science items (in their case from the TIMSS study in our case from the PISA study) one by one for possible maths skills needed to answer these questions.
20
fixed effects instrumental variable regression for our education production function
qs
i,j =βo+β1esi,j+β2(e s i,j)
2
+β3xi,j+aj +ǫi,j (4.1)
where i and j are subindexes for the student and the school respectively and qs
i,j is the
student’s PISA science score.21
We denote student effort by (es
i,j) and we consider
home-work time and time spent in private lessons for science that we instrument by using these measures for the subject of maths. We also add homework time for science squared and time spent studying in private lessons squared to test for decreasing returns to scale and we instrument these variables by homework time for maths squared and by time spent in private classes studying maths squared. Our estimation also controls for different other variables (xi,j) including individual characteristics, family background variables, hours of
science classes and hours of science classes squared as well as the student’s PISA score for maths.22
As measures for the student’s family background we include parents’ years of schooling as well as the highest occupational category among parents’ and all available information on household possessions. Students’ individual variables controlled for in our regression are gender, age, migrant status, and if the student has repeated a grade.
The variable (aj) denotes school fixed effects. School fixed effects allow us to control for
a possible bias that might arise from the fact that some schools systematically assign more homework than others. In this case, if we were to run a regression without school fixed effects, the coefficient of the variable for individual homework time would also be picking up a school’s policy of assigning more homework. In addition, sorting of students into schools according to family background, in combination with differences in schools’ resources that might affect academic achievement of students differently (number and quality of teachers, resources etc) could lead to a bias in an estimation without fixed ef-fects. Hence by introducing school fixed effects into the regression we shut off any effects of different school policies and sorting according to parental background and focus on the direct effects of individual study time on achievement.
Table 4.7 displays the results of our weighted OLS and just-identified IV estimation for Spain, as well as the best and worst ranked countries according to the results for science in PISA 2006, Finland and Mexico.23
21
As mentioned before, for our estimation, results are reported for one of the five plausible values provided by PISA, only.
22
Given that students within one school might be attending different grades (repeaters, those skipping grades, due to different cut-off-dates for school entry) class time within schools may vary.
23
Our estimation does not suffer from weak instruments. F-test of excluded instruments as well as the Angrist-Pischke multivariate F test of excluded instruments are shown in Table A-1.7of the Appendix A-1.
Table 4.7: Coefficients from Weighted OLS and IV School-Fixed effect regression
Spain Finland Mexico
OLS IV OLS IV OLS IV
Hour of Homework 3.187*** (0.606) -0.443 (1.433) 5.924*** (1.634) 9.299* (4.993) 0.423 (0.505) 6.019*** (1.345) Hwk2 -0.231** (0.099) -0.133 (0.231) -0.657* (0.348) -1.113 (1.329) -0.057 (0.075) -0.998*** (0.198) Private Lessons -3.404*** (0.632) -2.433** (1.213) -8.404*** (1.820) -11.85 (9.487) -1.422*** (0.500) -4.382*** (1.208) PrivLess2 0.553*** (0.126) 0.154 (0.252) 0.886* (0.514) -1.087 (4.417) -0.052 (0.097) 0.245 (0.293) Hour of Class 2.384*** (0.544) 4.098*** (0.668) 3.102** (1.308) 3.128** (1.431) 2.355*** (0.438) 1.674*** (0.534) Class2 -0.080 (0.071) -0.165** (0.081) -0.245 (0.187) -0.230 (0.199) -0.197*** (0.058) -0.097 (0.067) Girl -3.141*** (0.666) -2.415*** (0.681) 11.59*** (1.323) 10.16*** (1.476) -1.674*** (0.573) -1.890*** (0.579) Age -2.673** (1.105) -2.810** (1.115) 3.297 (2.195) 3.068 (2.241) -1.177 (1.000) -0.852 (1.007) Has repeated grade -9.664*** (0.838) -10.30*** (0.849) 5.337* (3.063) 5.612* (3.104) 0.000 0.000
Migrant -12.10*** (1.461) -11.87*** (1.474) -19.10*** (5.402) -18.45*** (5.515) -23.81*** (2.284) -23.97*** (2.321) Parents’ Years of Education 0.656*** (0.099) 0.716*** (0.099) 0.756*** (0.279) 0.738** (0.287) 0.330*** (0.090) 0.344*** (0.091) Low White Collar -3.544*** (0.876) -3.755*** (0.883) 0.300 (1.537) 0.366 (1.558) -1.494* (0.789) -1.289 (0.793) High Blue Collar -6.133*** (1.004) -5.945*** (1.011) 2.000 (2.169) 2.323 (2.197) -1.074 (0.917) -1.151 (0.922) Low Blue Collar -4.972*** (1.226) -4.621*** (1.236) 1.122 (2.963) 0.651 (3.081) -4.381*** (0.896) -4.356*** (0.903) PISA Math Score 0.804*** (0.005) 0.801*** (0.006) 0.901*** (0.009) 0.889*** (0.010) 0.686*** (0.005) 0.684*** (0.005) Constant 161.8*** (21.12) -30.47 (53.16) 143.7*** (16.3)
Observations 17,105 17,105 4,315 4,315 24,741 24,741 Number of schools 685 685 155 155 1,122 1,122 R-squared 0.798 0.745 0.789 0.761 0.734 0.512 All regressions include dummies for all possessions (desk, room, study place, computer, software, internet, calculator, literature, etc.
Our coefficients of interest are β1 and β2 measuring the effect of individual study time
on scholarly achievement. Results on the effects of individual study time are mixed. In Spain, Korea, and Greece no significant effect of an additional hour of homework time can be found, while the effect is positive and significant in Finland, Mexico, Canada, and Turkey.24
Studying one additional hour of science homework in these countries, raises the PISA science test score by between 2 (Mexico) to more than 4 (Finland) standard devi-ations. Negative and significant coefficients for the variable homework time squared in Canada, Greece, Turkey, and Mexico indicate decreasing returns to scale to spending time on science homework in these countries. More time spent in private lessons has a negative and significant effect on scholarly achievement in Spain, Mexico, and Canada. This effect is particularly important in Canada, where an additional hour of private lessons leads to a reduction in the PISA science test scores of around 8 standard deviations. While the negative effect of more private lessons on scholarly achievement might at first seem puzzling, this could be due to the lack of a good proxy for student ability.
Regarding time spent studying in class, more hours of class time significantly increase PISA test scores for students in Spain, Finland, Mexico, and Greece. On the contrary, no significant effect of an additional hour of class time can be found for Korea and Canada. This difference in findings can be interpreted in line with the classification of countries according to the OECD [2011](see page 11). In Canada and Korea students receive more absolute and relative classes compared to the OECD average and hence an additional hour of class time does not raise PISA test scores.25
On the other hand, in Finland and Spain students receive fewer absolute but more relative classes compared to the OECD, still leaving quite some room for further increases in classtime. The same holds true for Greece where students receive absolute and relative fewer classes. Increases in the PISA science test score per additional weekly hour of science class are around 2 standard de-viations and lie within the range of coefficients reported in Lavy [2010].26
Furthermore, Mexico and Turkey, countries where students receive more classes in absolute terms but fewer in relative terms compared to the average OECD show very different results in terms of the effect of an additional hour of class time. The effect is negative in Turkey, while positive in Mexico. One possible explanation for the negative coefficient in Turkey could be that certain students who receive extra classes are students of a lower ability, not picked up by the fact that they might be repeating a class, or by their lower PISA
24
For results for the remaining countries as well as the OECD average see TablesA-1.5 and A-1.6of the AppendixA-1.
25
While not significant, across all countries coefficients on class time squared are negative suggesting a reduced impact of further increases in class time.
26
Lavy [2010] finds increases of 4 to 7 points in the PISA score per additional hour of instruction (class time). Standard deviations in the PISA science score are around 2-3 points (see Table2.1).
maths score. The effect in Mexico is smaller than the one observed for Finland, Spain, or Greece possibly due to the fact that Mexican students already receive a lot of science classes. However, the fact that these make up little of total study time leaves some room for increasing class time. In addition we observe that in countries where both homework time and class time are significant (Mexico, Finland), the effect of one hour of additional class is smaller than the effect of one additional hour of homework. Given that we control for school-fixed effects, the variation in class time within one school might be smaller than the variation in homework time.
In line with the reported average test scores for students of different parental backgrounds in Table 3.6, coefficients of variables relating to parental background show the expected signs. Across all countries, having parents with more years of schooling and/or of higher occupational classifications increases a student’s PISA test score in science. For instance, seven additional years of parents’ schooling (from basic secondary education of 9 years of schooling to finishing a university degree after 16 years of schooling) increase PISA test scores in science by between less than one standard deviation in Mexico to almost 4 standard deviations in Canada. In Korea and Spain, having parents of low white collar occupation instead of high white collar occupations leads to a decrease in the PISA science score by more than 1 standard deviation. Note that due to the use of school-fixed effects in our regression the coefficients for variables referring to parental background have to be interpreted net of the selection effect that might arise from students from more advan-tageous family background attending different schools than those from less advanadvan-tageous family backgrounds. In addition, given that we also control for all household possession (see Table A-1.1 and of the Appendix A-1 for the exhaustive list of these variables), the positive effect of family background is also not due to better study environments pro-vided by possessing a desk, a studyplace, educational software, textbooks etc. We can thus only conjecture that maybe parents of higher education or higher occupational pro-fessions might be in a better position to monitor their children’s scholarly performance compared to parents with less schooling or of lower professions.27
In line with our findings in Table 3.5 being an immigrant has a negative and significant effect on test scores in all countries, while being a girl has a significantly negative effect on scholarly achievement in Mexico and Spain, whereas in all other countries the effect is positive and significant.
Overall it seems that in many countries in particular more class time has a positive and significant effect on student’s science knowledge as tested by PISA, independent of aspects of school environment as are a school’s resources, the number and quality of its
27
teachers, the school’s ownership, etc. More time spent doing homework has a positive and significant effect in few countries, but there its effect seems sizable. On the other hand , in most of the seven countries, more private lessons seem to affect educational outcome negatively.
5
Conclusion
Time input is one of the main ingredient for scholarly achievement. Looking at data from PISA 2006, we find that across countries, absolute time spent studying (class time homework time and time spent in private lessons) is unrelated to scholarly achievement, while a larger fraction of total study time spent in the classroom is associated to better performance. However, at the country level more total study time (class time plus home-work time) is associated to better performance. When considering different groups of students, this positive relationship between time input and scholarly achievement breaks down. In particular girls and students with a migratory background spend more time doing homework and in private lessons but perform worse.
We estimated a production function for education instrumenting homework time and time spent in private lessons for one science by time spent studying math. While the produc-tivity of additional study time varies across countries, overall results show that more classes and to a lesser extent more time spent doing homework have a positive effect on scholarly achievement while the effect of private lessons is negative or at most insignificant.
To further investigate differences in productivity of study time across countries, separate estimations of education production functions for different groups of students, according to parental background or achievement (quantile regressions) should be employed. In addition, our results on the importance of parental background for scholarly achievement, independently of parent’s school choice and household possessions suggest a road for fur-ther research. A closer look at studying techniques employed by students of different parental backgrounds could be a staring point.
References
Aaronson Danie; Barrow, Lisa and William Sander(2007):“Teachers and Stu-dent Achievement in the Chicago Public High Schools,”Journal of Labor Economics,
25(1), pp.95-135.
Albornoz, Facundo; Berlinski, Samuel and Antonio Cabrales(2011): “Mo-tivation, resources and the organization of the school system,” Memo, Universidad Carlos III de Madrid.
Anghel, Brindusa and Antonio Cabrales(2010):“The Determination of Success in Primary Education in Spain,” FEDEA, Documento de Trabajo 2010-20.
Angrist, Joshua D. and Victor Lavy(1999):“Using Maimonides’ Rule to Esti-mate the Effect of Class Size on Scholastic Achievement,” The Quarterly Journal of Economics, 114(2), pp.533-575.
Becker, Gary S.(1962):“Investment in Human Capital: A Theoretical Analysis,”
The Journal of Political Economy, 70(5), (Part 2: Investment in Human Beings), pp.9-49.
Bedhard, Kelly and Elizabeth Dhuey(2006):“The Persistence of Early Child-hood Maturity: International Evidence of Long-Run Age Effects,” The Quarterly Journal of Economics, 121(4), pp.1437-1472.
Ben-Porath, Yoram(1967):“The Production of Human Capital and the Life-Cycle of Earnings,” The Journal of Political Economy, 75(4), pp.352-365.
Bønesronning, Hans(2004):“The Determinants of Parental Effort in Education Production: Do Parents Respond to Changes in Class Size?,”Economics of Education Review,23, pp.1-9.
Bressoux, Pascal; Kramarz, Francis and Corinne Prost(2004):“Teachers’ Training, Class Size and Students’ Outcomes: Learning from Administrative Fore-casting Mistakes,” Economic Journal, 119(536), pp.540-561.
Ciccone, Antonio and Wallter Garcia-Fontes(2008):“The Quality of the Cata-lan and Spanish Education Systems,” Universidad Pompeu Fabra.
Cooley, Jane (2010): “Desegregation and the Achievement Gap: Do Diverse Peers Help?”, Department of Economics, University of Wisconsin-Madison.
Correa, Hector and Gene W. Gruver (1987): “Teacher-Student Interaction: A Game Theoretic Extension of the Economic Theory of Education”, Mathematical Social Sciences, 13, 19-47.
De Bortoli, Lisa and John Cresswell (2004): “Australia’s Indigenous Students in PISA 2000 : Results from an International Study”, Indigenous Education.
De Fraja, Giani; Oliveira, Tania and Luisa Zanchi(2010): “Must Try Harder. Evaluating the Role of Effort on Examination Results”, Review of Economics and Statistics, 92, 577-597.
De Fraja, Gianni and Pedro Landeras (2006): “Could Do Better: The Effec-tiveness of Incentives and Competition in Schools”,Journal of Public Economics, 90, 189-213.
El Pa´ıs (2012): “Rebeli´on contra los deberes para casa,” http :
//sociedad.elpais.com/sociedad/2012/04/02/vidayartes/1333390053270755.html.
Eren, Ozkan and Daniel J. Henderson (2011): “Are we wasting our children’s time by giving them more homework?,”Economics of Education Review, 30, 950-961.
Fuchs, Thomas and Ludger W¨oßmann(2007): “What accounts for international differences in student performance? A re-examnination using PISA data”,Empirical Economics, 32, 433-464.
Frempong, George and Xin Ma (2006): “Improving Reading Skills: Policy Sen-sitive Non-School and Family Factors”, Final Report Learning Policy Directorate, Strategic Policy and Planning, Human Resources and Skills Development, Canada.
Gibbons, Stephen; Silva, Olmo and Stephen Machin (2008): “Choice, Com-petition, and Pupil Achievement,” Journal of the European Economic Association, 6(4), 912-947.
Hanushek, Eric and Ludger Woessmann (2010): “The Economics of Interna-tional Differences in EducaInterna-tional Achievement”, NBER Working Paper, No. 15949.
Hoxby, Caroline M. (2000): “Does Competition among Public Schools Benefit Students and Taxpayers,” The American Economic Review, 90(5), 1209-1238.
International Labor Organization (1990): International Standard Classification of Occupations. International Labor Office, Geneva.
J¨urges, Hendrik; B¨uchel, Felix and Kerstin Schneider (2005): “The Effect of Central Exit Examinations on Student Achievement: Quasi-Experimental Evidence from TIMSS Germany,” Journal of the European Economic Association, 3(5), 1134-1155.
Kim, Sunwoong and Ju-Ho Lee (2010): “Private Tutoring and Demand for Education in South Korea,” Economic Development and Cultural Change, 58(2), 259-296.
Kotte, Dieter; Lietz, Petra and Maria Martinez Lopez (2005): “Factors influencing reading achievement in Germany and Spain: Evidence from PISA 2000”,
International Education Journal, 6(1), 113-124.
Kuehn, Zo¨e and Pedro Landeras (2012): “The Effect of Family Background on Student Effort”, Documento de Trabajo 2010-30, FEDEA.
Lavy, Victor (2010): “Do Differences in School’s Instruction Time Explain Interna-tional Achievement Gaps in Math, Science, and Reading? Evidence from Developed and Developing Countries”, NBER WP No.16227.
Lin, Chung-Cheng and Ching-Chong Lai (1996): “Why Parents and Teachers May Prefer Punishment to Encouragement for Child Education?”, Southern Eco-nomic Journal, 63, 244-247
Metcalfe, Robert; Burgess, Simon, and Steven Proud(2011): “Student effort and educational attainment: Using the England football team to identify the edu-cation production function”, CMPO (Centre for Market and Public Organisation) Working Paper No. 11/276.
OECD (2011): Quality Time for Students. Learning in and out of school, Organi-zation for Economic Co-Operation and Development, Paris.
OECD(2010): PISA 2009 Results: Executive Summary, Organization for Economic Co-Operation and Development, Paris.
OECD (2009): PISA Data Analysis Manual SPSS Second Edition, Organization for Economic Co-Operation and Development, Paris.
OECD (2008): Informe PISA 2006. Competencias cient´ıfcas para el mundo del ma˜nana, Organization for Economic Co-Operation and Development, Paris.
OECD (2007): PISA 2006: Science Competencies for Tomorrow’s World Executive Summary, Organization for Economic Co-Operation and Development, Paris.
OECD (2006a): Education at a Glance 2006 OECD Indicators, Organization for Economic Co-Operation and Development, Paris.