Munich Personal RePEc Archive
Impact of Monetary Policy on the
Volatility of Stock Market in Pakistan
Qayyum, Abdul and Anwar, Saba
Pakistan Institute of Development Economics
2011
Online at
https://mpra.ub.uni-muenchen.de/31188/
Impact of Monetary Policy on the Volatility of Stock
Market in Pakistan
Abdul Qayyum
Professor
Pakistan Institute of Development Economics
(Email;
abdulqayyum@pide.org.pk
)
and
Saba Anwar
Research Economist
Pakistan Institute of Development Economics
Pakistan Institute of Development Economics
P. O. Box 1091, Islamabad
Impact of Monetary Policy on the Volatility of Stock
Market in Pakistan
This paper addresses the linkages between the monetary policy and the stock market in Pakistan. The estimation technique employed includes Engle Granger two step procedure and the bivariate EGARCH method. The results indicate that any change in the monetary policy stance have a significant impact on the volatility of the stock market. Thus contributing to the ongoing debate in the monetary policy rule literature regarding the proactive and reactive approach1.
JEL code: G120, E430.
Keywords: Interest Rate, Stock Market, Monetary Policy, EGARCH, Pakistan
1. Introduction
Financial sector in Pakistan has been experiencing the process of reforms since eighties. The two important outcomes of the financial sector reforms in Pakistan has been the opening up of the stock markets for foreign investors and adoption of market based instruments, such as interest rate, of monetary policy. Opening up of the stock markets resulted in a sharp increase in the inflows of portfolio investment (Hussain and Qayyum, 2007). On one side such an investment helps in raising the investable funds and on other side it produced wild swings in the stock market. For example, the Karachi Stock (KSE)-100 Index increased to 2600 in 1995 but declined sharply to just 878 in 1998. From this low level it crossed 10 thousand marks in early 2005 and by May 2005 it had declined to around 7 thousand mark (Hussain and Qayyum, 2007). It is argued that the volatility is high in the ‘bullish’ market than in the ‘bear’ market. The Repo rate as indicator of monetary policy these years has also shown volatility. Since 1995 the Repo rates have been fluctuating between 23.5 to 0.21 percent.
Theoretically, monetary policy affects the stock prices through the wealth effect channel and the balance sheet channel as pointed out by Bernanke, Gertler and Gilchrist (1996), Bernanke and Gertler (1999) and Goodhart and Hofmann (2000). The traditional interest rate channel which implies that a tighter monetary policy leads to an increase in the interest rate that at which the firm’s future cash flows are capitalized causing stock prices to decline. While the easing of the monetary policy increases the overall level of economic activity and stock price responds in a positive manner as indicated by Cassola and Morana (2004). The traditional interest rate channel was also investigated by Bernanke and Blinder (1992), Thorbecke (1997) and Rigobon and Sack (2003). One third of the changes in the equity prices are associated with news on monetary policy (Fair, 2002).
However, there is no study available in Pakistan that has investigated the relationship between the stock prices and the monetary policy. The core objective of the study, therefore, is to explore the impact of monetary policy on the returns to stock market.
1
The study is arranged as follows. After this introductory part, section II overviews the stock market and the monetary policy developments in Pakistan. The section III elaborates the methodological framework. The data availability and preliminary data analysis is discussed in section IV. The cointegration analysis and EGARCH model results are presented in section V. The VI section concludes the study.
2. Overview of the Stock Market and the Monetary Policy Developments
The capital market in Pakistan is regulated by the Security and Exchange Commission of Pakistan (SECP) established in 1997 by replacing the Corporate Law Authority. There are three stock exchanges in Pakistan, namely the Karachi Stock Exchange (KSE), the Lahore Stock Exchange (LSE) and the Islamabad Stock Exchange (ISE). These are established on 1947, 1974, and 1997, respectively. The Karachi Stock Exchange (KSE) is the main and leading stock Exchange. The growth of the equity market during the decade of 1960s was due to industrialization policies pursued by the government of Pakistan. The decade of 1970’s started with political turmoil and unrest in the eastern part of the country. The worsening domestic situation in the East Pakistan and war with India disaggregated Pakistan. The out come was the separation of former East Pakistan and emergence of new country Bangladesh. The Government of Pakistan has adopted the policy of nationalization of all types of private sector industries and financial institutions in 1973-74, which had completely eliminated private sector out of the country. The new government reversed and formulated the policy of denationalization of industries and financial institutions in 1985-86.
The decade of 1990’s witnessed changes in the policies and functioning of the stock market. In the beginning of 1991 significant measures were taken including the opening of the market to international investors; removal of constraints to repatriation on investment proceeds, gains, and dividend; deregulation of economy and allowing commercial banks in the private sector; liberalization of foreign exchange restrictions and allowing Pakistanis to have foreign currency accounts. The market responded positively to liberalization measure and unprecedented increase in all indicators was observed in the first year of the opening of the market. The bullish trends were observed in the first year. In terms of its performance, the market was ranked third in 1991 (Husain and Qayyum, 2007). Nevertheless in terms of listings the market deepened. The new companies (i.e., 86) were listed during the year that helped to increase the turnover of shares and market capitalization. The market improved significantly in terms of size and activity. As a result, the ratio of market capitalization to GDP increased from 7% to almost 18% in the first year of liberalization and further to 26% after two years.
trading value and turnover ratio was tremendous. Since late 90s the turnover ratio has been phenomenal and increased to almost 500% in 2003. As a result Pakistan ranks first in the world in terms of turnover ratio. The KSE has been among the best performing markets for the last two years.
3. Monetary Policy Developments
The State Bank of Pakistan has been established on July 1, 1948 as a central bank. The banking system had collapsed at the time of partition; SBP at first very carefully took measures to rehabilitate and expand the existent banking structure. These included the declination of the foreign banks’ offer to open branches in the interior of the country on the grounds that the local dominance of the most powerful financial sector of the economy is in the best interest of the new born country. The National Bank of Pakistan was thus established in 1949. To encourage the local banks to spread their branches into the interior of the country, the SBP provided clearing and cheap remittance facilities. A number of other specialized banks and were also set up namely Agricultural Development Finance Corporation in 1952 and Asian Development Bank in 1959 – later merged into Agricultural Development Bank in 1961, Pakistan Industrial Finance Corporation in 1957 – later on converted into Industrial Development Bank, Pakistan Industrial Credit and Investment Corporation in 1957, House Building Finance Corporation in 1952, National Investment Trust, Investment Corporation of Pakistan etc.
SBP has been using a selective credit control measures like the imposition of minimum margin requirements as an instrument of monetary policy. The interest rate was kept low during 19480-70 to contain rise in the public debt and to encourage larger expansion of the banking credit for financing the public and private investment. The SBP in addition to the use of moral suasion with the banks to encourage lending to the small parties used margin requirement as a tool. To restraint the growth of money supply the reserve ratios were used 1965. In addition a Quota System was introduced in August 1963, in respect of its advances to the scheduled banks against government securities. Under this agreement banks were assigned a quota every quarter equal to half of its statutory reserves with the state bank in the preceding quarter. The borrowing beyond this quota was subject to progressively high higher rates. In 1965 the quota was made more stringent by reducing the amount from 50 to 25 percent of the average statutory reserves and making it applicable it for all types of borrowing of the banks from SBP.
A comprehensive banking reforms was introduced in 1972 by the government with consultation of the new governor SBP. The emphasis was on the flow of the bank credit to priority sectors and small businessman in agriculture and industry through the creation of the National Credit Consultative Council. However, owing to the ineffectiveness of the reforms the SBP was nationalized in 1974. The system of the ceilings on the credit by the individual banks to private sector remained a really potent weapon to restrain growth of money and credit. Thus the monetary and credit policies were directed towards providing adequate credit to productive sectors in general and priority sectors in particular
The beginning of the 90s witnessed the Banking Reforms II comprising of the market based policies of system and credit management. In 1992 the Prudential Regulations were introduced. This included introduction of public debt auctioning, abolition of credit ceiling and credit deposit ratio (CDR), phasing out of directed, concessionary credit and finally removal of cap on interest rates [Ashraf Janjua]. On February 1, 1992, the SBP extended a 3 day Repo facility for the Treasury Bills. The OMO, which SBP started on ad hoc basis in October 1991, supplemented by the changes in the discount rates and cash reserve requirements and issuance of T bills of different maturity in June 1998, facilitated in the management of the monetary and credit expansion. In 1999 the multiple exchange rate system was replaced by unified exchange rate by the SBP. From July 1, 2000, the integration of the exchange rate and the monetary policies took place.
The SBP gained autonomy in 90s with the reforms. In 2002, to strengthen the SBP autonomy, the State Bank of Pakistan Act, 1956, was amended. A section 9B was introduced which further clarified the role of Monetary and Fiscal Policies Coordination Board. To strengthen the SBP core banking capabilities and for creation of SBP Banking Services Corporation. The restructuring led to the formation of two subsidiaries. The SBP Banking Services Corporation in January 2002 and The National Institute of Banking and Finance (NIBAF) in January 1997. During the 1989–2000 period, monetary and credit policies mainly operated within the Annual Credit Plan (ACP). In December 2000, the Federal Investment Bonds were complemented with Pakistan Investment Bond.
During FY01, the monetary policy was initially tightened by increasing the discount rate twice from 11 to 12 percent and from 12 to 13 percent in September and October 2000 respectively and increasing the cash reserve requirement by 2 percent to effectively curb the depreciation of the rupee. Monetary policy witnessed an important transition in 2005, the focus of the monetary policy shifted on controlling inflation rather then reviving growth in the economy. The monetary policy was aggressively tightened in the second half of the fiscal year. In order to curb cost push inflation, SBP raised the discount rate (for the first time after June 2001) during April 2005, by 150 basis points. This rise in interest rates was supported by high liquidity absorptions through OMOs and a slow down in reserve money growth. This coupled with higher acceptance ratio in T-bill auctions during these months compared with initial nine months of the fiscal year, further drained inter bank liquidity and resulted in an increase in discounting activities.
4. Methodology
Engle and Granger (1987) two step method is used to test the existence of cointegrating relationship between the stock market prices and the money market rate. The first step estimates the long run equation and in the second step ADF test is applied on the residual from the cointegrating equation. The Engle-Granger two step method is
LRSt = α + β LRRt + εt (1a)
Δεt = ρεt-1 +β1Δεt-1 + β2Δεt-2+ … + βpΔεt-p +μt (1b)
where LSPIt is log of stock price index, LREPt is log of Repo rate, t is residual from
cointegrating equation and μt is residual from the equation of ADF unit root test which is
assumed to be white noise.
Because the tendency of stock prices to be negatively correlated with changes in the stock volatility, therefore, the relationship between the two markets, i.e., stock market and Repo market is estimated by utilizing ARCH-GARCH methods proposed by Engle (1982). The simple GARCH (p, q) model cannot capture the leverage effect. Keeping in view the importance of leverage effect in stock assets returns Bollerslev (1986) and Nelson (1991), amongst others, have developed the Exponential Generalised Autoregressive Conditional Heteroskedecity (EGARCH) model. Braun et al (1995), Kroners and Ng (1996, 1998), Henry and Sherma (1999) and Engle and Cho (1999) have extended Exponential Generalised Autoregressive Conditional Heterosckedecity (EGARCH) model into bivariate version. The model helps us in the estimation both static as well as dynamic forecast of the mean, forecast standard error and the conditional variance.
This paper applies a bivariate VAR-EGARCH model to investigate the relationship between the stock market and Repo rate. The VAR-EGARCH (p, q) model for the stock market is given
in the following two equations;
t j t t
m j j i t n i i
t rs rr ecs
rs
1 0 1 0 (2a)
1 1 1 1 2 1 2 ln ln ln ln t t t t s t s t s t rr rr zrs E zrs zrs rs rs (2b)Where i = 1, 2, .. , n and j = 0, 1, ..,m tΩt-1 ~ N[ 0, (s t)²]
The equation (2a) is vector autoregressive (VAR) model of the conditional mean equation of returns on stock market assets (rst). It indicates that rst depends on the past values of stock
returns (rst-i), the current and past values of Repo rate (rrt-j), the error correction term (ecst-1)
representing the cointegrating relationship between the stock market prices and Repo rate, and the random variable. The random variable (i.e., εt) is assumed to have zero mean and
conditional variance. Hence the second equation of the model (i.e., 2b) represents the conditional variance of the stock market returns.
parameters θs and βs capture the last period forecast variance and stock market news effects,
respectively. Further, the θ’s allow asymmetry in effects of news from the stock market. The estimated parameter of GARCH term that is δs indicates persistence of volatility in the stock
market asset returns.
5. Preliminary Data analysis
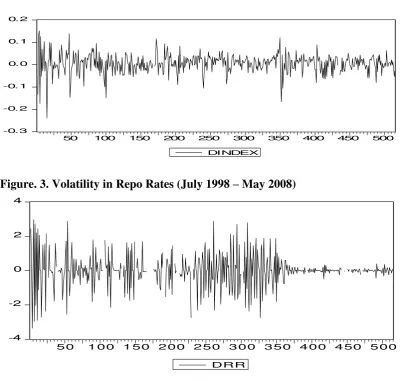
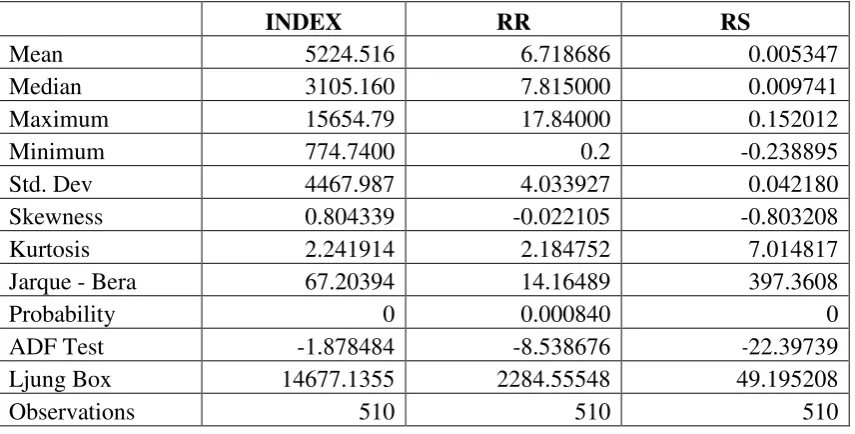
[image:8.595.81.516.366.640.2]For the analysis we use weekly data from 1st July 1998 to 27 May 2008. The data on stock index (i.e. KSE-index 100) are obtained from the Karachi Stock Exchange and the data on Repo rate is obtained from State Bank of Pakistan. The short run interest rate i.e. repo rate is used as the monetary policy instrument. The data on KSE-index 100 and repo rates is presented in fig 1. The figure 2 and 3 show volatility in the stock market returns and repo rates respectively.
Figure. 1. Stock Price Returns and Repo Rates (July 1998 – May 2008)
0 2000 4000 6000 8000 10000 12000 14000 16000 18000
week
week
0 2 4 6 8 10 12 14 16 18 20
week
Figure. 2. Volatility in Stock Price Returns (July 1998 – May 2008)
-0. 3 -0. 2 -0. 1 0.0 0.1 0.2
50 100 150 200 250 300 350 400 450 500
DINDEX
Figure. 3. Volatility in Repo Rates (July 1998 – May 2008)
-4 -2 0 2 4
5 0 1 0 0 1 5 0 2 0 0 2 5 0 3 0 0 3 5 0 4 0 0 4 5 0 5 0 0 DR R
The Fig. 1 traces the movements in the stock price index and the Repo rates over the period under analysis. As long as the Repo rates were declining the stock price index remained low. However, the upward movement of the Repo rates led to a sharp increase in the stock market returns.
[image:9.595.76.471.140.285.2]Table 1: Preliminary Data Analysis: Summary Statistics.
INDEX RR RS
Mean 5224.516 6.718686 0.005347
Median 3105.160 7.815000 0.009741
Maximum 15654.79 17.84000 0.152012
Minimum 774.7400 0.2 -0.238895
Std. Dev 4467.987 4.033927 0.042180
Skewness 0.804339 -0.022105 -0.803208
Kurtosis 2.241914 2.184752 7.014817
Jarque - Bera 67.20394 14.16489 397.3608
Probability 0 0.000840 0
ADF Test -1.878484 -8.538676 -22.39739
Ljung Box 14677.1355 2284.55548 49.195208
Observations 510 510 510
6. Empirical Results
6.1 Cointegration Analysis
The possibility of a long run relationship between the two series is investigated by applying Engle-Granger (1987) two step method. This helps us to determine whether an error correction term should be included in the EGARCH model or not. In the first step the stock prices are regressed on the repo rates. The results are presented below (t-statistics in parenthesis).
LRS = 6.612589 + 0.006121 T - 0.016951 LRR (286.14) (95.92) (-1.82)
R-squared 0.95 F-statistics 4607.38 ADF -2.791505
In the second step, the presence of cointegration between the two variables is tested by applying the ADF test of unit roots on the residual obtained from the cointegration equation 1a. The Engle-Granger five percent critical value is (3.17). The results thus indicate the existence of a unit root in the residual series, implying that the two series are not cointegrated for the period under analysis. This leads to the estimation of the EGARCH model without error correction term in the conditional mean equations.
6.2 EGARCH Model of Stock Returns
(3.421304) (1.871928) (-1.87918) 000731 . 0 080740 . 0 010021 .
0 1 1
t t
t rs rr
rs (3a)
5.656768
1.928632
ln 006783 . 0 199633 . 0 2.575004 87.42408 7.25028 -061934 . 0 ln 943131 . 0 5793636 . 0 ln 1 1 1 1 2 1 2 t t t t t t rr zrs E zrs zrs rs rs (3b)
The mean equation (3a) reveals that the returns to the stock market are not only affected significantly by its lag but the monetary policy in terms of the repo rates also plays a significant role in determining the returns to the stock market. Thus any increase (decrease) in the repo rates, indicating a monetary policy tightening (expansioning), decreases (increases) the returns to the stock market. The same is true for the variance equation (3b) whereby any increase (decrease) in the repo rates, indicating a monetary policy tightening (expansioning), enhances the volatility of the stock market with one week lag. Implying thereby that the monetary policy has a positive impact on the volatility of the stock market.
The parameter, indicate asymmetric impact of news on the stock market return. If it is negative, a negative innovation tends to reinforce the size effect, while a positive innovation tends to partial out. In case of Pakistan, it is positive and statistically significant. The positive and significant value implies that positive news tends to amplify the interest rate volatility more than the negative news.
The relative importance of the negative innovation to the positive innovation is 0.88, measured by the ratio │-1+ │/ (1+). This ratio also considers the differing impact of a market’s own innovation on the current conditional variance (Yang and Doong, 2004). It reveals that the positive innovation in the stock market have a one time larger impact on volatility of the stock market returns than the impact of negative innovations in the stock market.
The sum of ARCH and GARCH coefficients is 1. If it is close to one, it reflects the persistence in the volatility shocks. The sum of ARCH and GARCH coefficients in case of Pakistan shows that the volatility shocks in the stock market returns have been very persistent and they die out rather slowly.
Based on the half-life of a shock, the life of volatility is measured as ln (0.5)/ ln (δ). It turns out to be almost 12 weeks. This implies that it takes almost twelve weeks for the stock market to regress half–way back to its steady state value (Mari G. Reyes, 1996).
The leverage effect is statistically significant in case of Pakistan. This implies that the past negative shocks increase current volatility more than do past positive shocks.
News Impact Curve of Stock Market Returns
0 500 1000 1500 2000 2500 3000
-10 -5 0 5
Z
S
IG
2
Given information up to current time, the news impact curve examines the relationship between the news and future volatility. The news impact curve plots news scenarios on the horizontal axis against the resulting volatility on the vertical axis. The curve shows that the conditional variance of the stock market returns reacts differently to equal magnitudes of negative and positive shocks. An increase in the stock market returns leads to more uncertainty when compared to a decrease of equal magnitude.
7. Conclusion
In an economy there are several paths and channels through which monetary policy can effect the real activity of the economy. The traditional transmission mechanisms of the monetary policy i.e. the credit and the money channel, have one thing common that they operate through the financial market. Most economists agree that the stock market price index, being one of the leading indicators in the developed economies, is affected by the monetary policy rules. Thus indicating that identifying the link between the monetary policy and the stock market is highly important to gain useful insight of the transmission mechanism of the monetary policy.
References
Bernanke, B. and Kuttner, N. (2005) What Explains the Stock Market’s Reaction to the Federal Reserve Policy? The Journal of Finance, Vol. LX, 1221-1257
Bollerslev, T. (1986) Generalized Autoregressive Conditional Heteroscedasticity, Journal of Econometrics, 31
Cassola, N. and Morana, C. (2004) Monetary Policy nad Stock Market in the Euro Area. Journal of Policy Modelling 26, 387 – 399
Engle, R. F., and Granger, C. W. (1987) Cointegration and Error Correction: Representation, Estimating and Testing, Econometrica, 55, 251, 76
Engle, R. F. (1982) Autoregressive Conditional Heteroskedasticity and Estimates of the Variance of UK Inflation, Econometrica, Vol. 50, 987-1008
Fair, Ray C. (2002) Events that Shook the Market. Journal of Business, 75,713 – 731
Goodhart, C., and Hofmann, B. (2000) Financial Variables and the conduct of Monetary Policy”, Sveriges Riskbank Working Paper, No. 12
Hussain, F. and Qayyum, A. (2007), Stock Market Liberalisations: The South Asian Experience, Journal of Management Science, 1:1
Ioannidis, C. and Kontonikas, A. (2006) Monetary Policy and the Stock Market: Some International Evidence, University of Glasgow Working Paper, No. 2006_12.
Janjua, Asharf (2003), History of the State Bank of Pakistan 1977-1988, SBP.
Janjua, Asharf (2004), History of the State Bank of Pakistan 1988-2003, SBP.
Nelson, D. B. (1991) Conditional Heteroscedasticity in Asset Returns: A New Approach, Econometrica, Vol. 59, 347-370
Niazi, A. K. (2005) Monetary Policy in Historical Perspective (Pakistan Experience, 1978-2005), Pakistan Business Review, Vol. 8 (3), 3-43.
Niazi, A. K. (2007) Monetary Policy in Historical Perspective (Pakistan Experience, 1970-1978), Pakistan Business Review, Vol. 8 (4), 3-40.