Physics and Astronomy Dissertations Department of Physics and Astronomy
8-11-2015
Brain Connectivity changes after Stroke and
Rehabilitation
Sahil Bajaj
Follow this and additional works at:https://scholarworks.gsu.edu/phy_astr_diss
This Dissertation is brought to you for free and open access by the Department of Physics and Astronomy at ScholarWorks @ Georgia State University. It has been accepted for inclusion in Physics and Astronomy Dissertations by an authorized administrator of ScholarWorks @ Georgia State University. For more information, please [email protected].
Recommended Citation
by
SAHIL BAJAJ
Under the Direction of Mukesh Dhamala, PhD and Andrew J. Butler, PhD
ABSTRACT
Several cortical and subcortical areas of brain interact coherently during various tasks such as
motor-imagery (MI) and motor-execution (ME) and even during resting-state (RS). How these
interactions are affected following stroke and how the functional organization is regained from
rehabilitative treatments as people begin to recover have not been systematically studied. Role
of primary motor area during MI task and how this differs during ME task are still questions of
interest.
To answer such questions, we recorded functional magnetic resonance imaging (fMRI) signals
from 30 participants: 17 young healthy controls and 13 aged stroke survivors following stroke and
following rehabilitation - either mental practice (MP) or combined session of mental practice
and physical therapy (MP + PT). All the participants performed RS task whereas stroke survivors
performed MI and ME tasks as well. We investigated the activity of motor network consisting of
regions was reduced significantly following stroke (ii) did not increase significantly after MP
alone and (iii) among the regions after MP+PT increased significantly towards the causal flow
values for young able-bodied people. Second, we found that there was suppressive influence of
SMA on M1 during MI task where as the influence was unrestricted during ME task. We reported
that following intervention the connection between PMC and M1 was stronger during MI task
whereas along with connection from PMC to M1, SMA to M1 also dominated during ME task.
Behavioral results showed significant improvement in sensation and motor scores and
significant correlation between differences in Fugl-Meyer Assessment (FMA) scores and
differences in causal flow values as well differences in endogenous connectivity measures before
and after intervention. We conclude that the spectra of causal information flow can be used as a
reliable biomarker for evaluating rehabilitation in stroke survivors. These studies deepen our
understanding of motor network activity during the recovery of motor behaviors in stroke.
Understanding the stroke specific effective connectivity may be clinically beneficial in identifying
effective treatments to maximize functional recovery in stroke survivors.
by
SAHIL BAJAJ
A Dissertation Submitted in Partial Fulfillment of the Requirements for the Degree of
Doctor of Philosophy
in the College of Arts and Sciences
Georgia State University
Copyright by Sahil Bajaj
by
SAHIL BAJAJ
Committee Chair: Mukesh Dhamala
Andrew J. Butler
Committee: Vadym Apalkov
Igor Belykh
Brian D. Thoms
Electronic Version Approved:
Office of Graduate Studies
College of Arts and Sciences
Georgia State University
To my loving parents and my first teachers, Sham Lal and Darshana Bajaj
And
First and foremost, a big thanks to my principal supervisor, Dr. Mukesh Dhamala.
It would not have been possible to write this thesis without his endless help, support, and
patience. His good advice, guidance and friendship have always been invaluable to me. I
would like to acknowledge Dr. Andrew J. Butler for always being so generous and for his
expertise and precious time. I am honored to have had the privilege of working with both of
you- Dr. Dhamala and Dr. Butler. You consistently conveyed a spirit of adventure with regard to
research.
I am very grateful to all the members of Neurophysics Research group and all my committee
members. I would like to extend my thanks to Dr. Daniel Drake and Dr. Bhim M. Adhikari for
their invaluable suggestions.
I also want to take this opportunity to thank my schoolteachers and mentors (especially, late Sh.
Ranjit Sharma) for always inspiring me. A big thanks goes to my parents for their love and
support throughout my life and for giving me strength to chase my dreams. Both of you are a
great source of true inspiration- mom-dad. Also, I am very grateful to my elder brothers- Dr.
Avinash Bajaj and Ashish Bajaj and their families who supported me in all my pursuits. My
special thanks to my loving wife, Ramandeep, for all her devotion and love. Her sacrifices and
encouragement throughout my career are truly undeniable.
Finally, I would like to thank all the wonderful people, friends and relatives who inspired and
ACKNOWLEDGEMENTS ... v
LIST OF TABLES ... x
LIST OF FIGURES ... xi
LIST OF ABBREVIATIONS ... xii
1 INTRODUCTION ... 1
2 STROKE AND REHABILITATIVE TREATMENTS ... 2
2.1 Stroke ... 2
3 BRAIN CONNECTIVITY MEASURES ... 5
3.1 Directed functional and effective connectivity measures ... 5
3.2 Spectral Granger causality measures ... 8
3.3 Dynamic causal modeling (DCM) ... 9
3.3.1 Bayesian model selection (BMS) approach ... 10
3.3.2 Bayesian model averaging (BMA) approach ... 10
4 FUNCTIONAL REORGANIZATION AND RESTORATION DURING REST FOLLOWING STROKE AND INTERVENTION ... 11
4.1 Introduction ... 11
4.2 Materials and methods ... 13
4.2.1 Participants ... 13
4.2.4 Data analysis ... 17
4.2.5 Spectral Granger causality measures and significant tests ... 18
4.3 Results ... 19
4.3.1 Power and GC spectra ... 19
4.3.2 Directed functional connectivity ... 20
4.3.3 Connectivity modulations ... 21
4.3.4 Brain and behavior correlation ... 24
4.4 Discussion ... 28
4.4.1 Low-frequency network activity ... 29
4.4.2 Altered functional connectivity following stroke ... 30
4.4.3 Recovered functional connectivity following rehabilitation ... 31
4.4.4 Conclusions ... 34
5 EFFECTIVE CONNECTIVITY DURING IMAGERY AND MOTOR-EXECUTION FOLLOWING STROKE AND REHABILITATION ... 34
5.1 Introduction ... 34
5.2 Materials and methods ... 37
5.2.1 Participants and pre-scan measures ... 37
5.2.2 Tasks ... 38
5.2.5 FMRI preprocessing ... 40
5.2.6 Volumes of interest (VOIs) ... 40
5.2.7 Dynamical causal modeling (DCM) ... 41
5.3 Results ... 42
5.3.1 Effective connectivity ... 42
5.3.2 Brain and behavior correlation ... 60
5.4 Discussion ... 61
5.4.1 Effective connectivity during motor-imagery and motor-execution ... 62
5.4.2 Effect of intervention on effective connectivity ... 63
5.5 Conclusions ... 65
6 SUMMARY ... 65
REFERENCES ... 67
APPENDICES ... 84
Appendix A ... 84
A.1: Power spectra for young able-bodied and aged stroke-survivors ... 84
Table 4.1 Clinical and demographic data. ... 15
Table 4.2 Brain and behavior scores. ... 27
Table 5.1 Optimal model selection and modulatory parameters for dominating models.
... 43
Table 5.2 Effective connectivity measures. ... 52
Figure 4.1 Power spectra and peak power. ... 20
Figure 4.2 Granger causality (GC) spectra and integrated causal flow for young able bodied and aged stroke survivors before and after intervention. ... 22
Figure 4.3 Percent difference and modulation. ... 23
Figure 4.4 Network activity comparisons ... 25
Figure 4.5 Brain and behavioral correlation ... 26
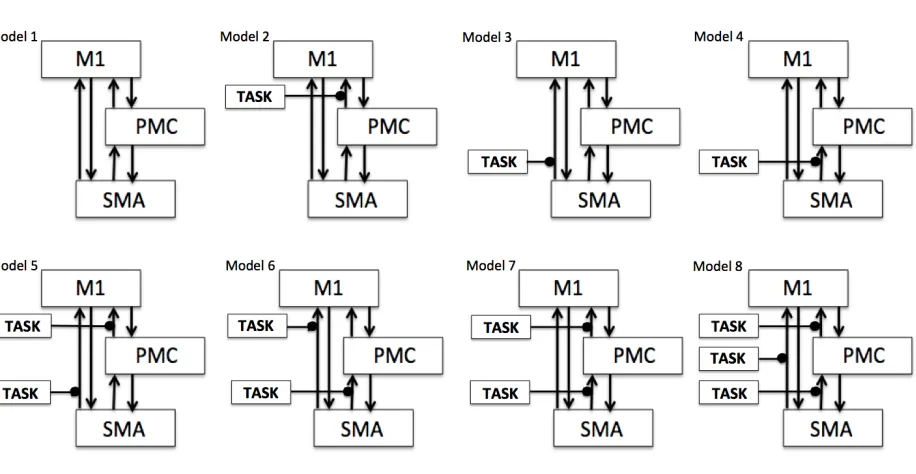
Figure 5.1 Model space specification. ... 42
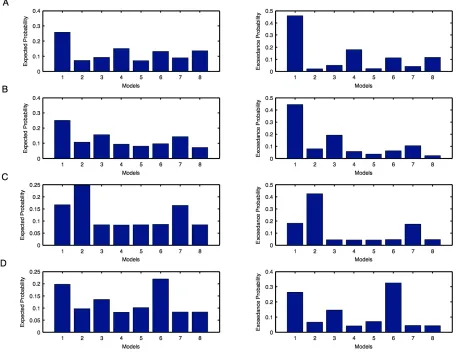
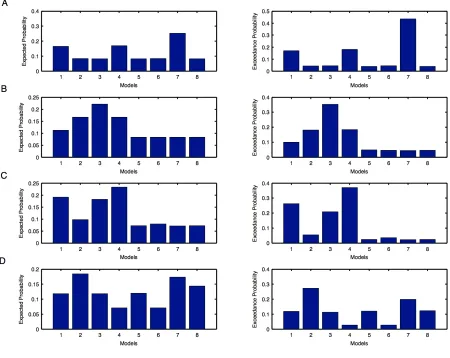
Figure 5.2 Individual model probabilities during motor imagination (MI) task for unaffected hemisphere. ... 46
Figure 5.3 Individual model probabilities during motor imagination (MI) task for affected hemisphere. ... 47
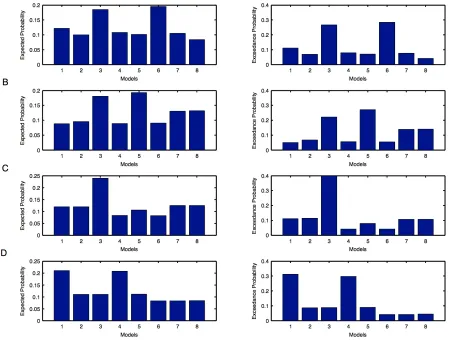
Figure 5.4 Individual model probabilities during motor execution (ME) task for unaffected hemisphere. ... 48
Figure 5.5 Individual model probabilities during motor execution (ME) task for affected hemisphere. ... 49
Figure 5.6 Modulatory parameters from optimal model selection. ... 51
Figure 5.7 Effective connectivity network for motor-imagery (MI) task. ... 58
Figure 5.8 Effective connectivity network for motor-execution (ME) task. ... 59
AB able-bodied
BOLD blood oxygenation level dependence
D percent difference
DCM dynamic causal modeling
df small frequency interval
f frequency
F female
FA flip angle
FMA Fugl-Meyer Assessment
FMRI functional magnetic resonance imaging
FOV field of view
GC Granger causality
IA imagine affected
IU imagine unaffected
iGC integrated Granger causality
LFOs low frequency oscillations
LM1 left primary motor area
LPMC left premotor cortex
M male
M percent modulation
ME motor execution
MR magnetic resonance
M1 primary motor area
MMSE Mini-Mental State Exam
MP mental practice
MP+PT combination of mental practice and physical therapy
PA pinch affected
PMC premotor cortex
PT physical therapy
PU pinch unaffected
rs-fMRI resting state- functional magnetic resonance imaging
RM1 right primary motor area
ROIs regions of interest
RPMC right premotor cortex
RS resting state
S spectral density matrix
SMA supplementary motor area
SS stroke survivors
TE echo time
TR repetition time
VOIs volumes of interest
ΔFMA difference between FMA scores before and after intervention
1 INTRODUCTION
This dissertation mainly describes two studies on human brain motor network activity in
stroke-survivors before and after intervention. First study describes reorganization and restoration
of motor-network activity of stroke-survivors during resting-state 1. Second study expands our
understanding of motor network effective connectivity during motor-imagery and motor-execution
tasks following stroke and intervention 2.
In chapter 2, we briefly describe the known causes behind stroke and available treatments.
Chapter 3 includes a detailed description of the methodology, spectral version of Granger causality
and dynamical causal modeling, used to explore connectivity patterns among regions involved in
motor network. Chapter 4 describes how to identify an effective means of treatment for
stroke-survivors to regain the strength of motor-behaviors and compares their strength with healthy
volunteers. Chapter 5 pinpoints the role of primary motor area to differentiate the connectivity
pattern discovered during motor-imagery and motor-execution tasks. Chapter 6 summarizes the
main conclusions of both the studies.
This dissertation is based upon the following two peer-reviewed publications:
v Bajaj, S., Butler, A.J., Drake, D., Dhamala, M. (2015) Functional organization and
restoration of the brain motor-execution network after stroke and rehabilitation. Frontiers in
Human Neuroscience 9:173.
v Bajaj, S., Butler, A.J., Drake, D., Dhamala, M. (2015) Brain effective connectivity during
motor-imagery and execution following stroke and rehabilitation. NeuroImage: Clinical 8:
572-582.
v Bajaj, S., Adhikari, B. M., Dhamala, M. (in preparation). Bridging the gap: Dynamical
causal modeling versus Granger causality analysis during resting state fMRI.
v Bajaj, S., Drake, D., Butler, A.J., Dhamala, M. (2014). Oscillatory motor network activity
during rest and movement: an fNIRS study. Frontiers in Systems Neuroscience 8 (13).
v Bajaj, S., Lamichhane, B., Adhikari, B.M., Dhamala, M. (2013). Amygdala mediated
connectivity in perceptual decision-making of emotional facial expressions. Brain
Connectivity 3, 386–397.
v Bajaj, S., Adhikari, B. M., Dhamala, M. (2013). Higher frequency network activity flow
predicts lower frequency node activity in intrinsic low-frequency BOLD fluctuations. PLoS
ONE 8: e64466.
2 STROKE AND REHABILITATIVE TREATMENTS
2.1 Stroke
The brain is known to be a self-organizing dynamical system with ongoing neural
oscillations coherent across anatomically distinct and efficiently connected brain regions 3. These
coherent oscillations are the backbone of whole-brain functional connectivity networks such as
default mode network and motor network 4. Stroke often leads to functional imbalance within the
motor network due to insufficient or no blood flow to part of the brain or due to direct tissue loss.
This functional imbalance within the motor system following stroke 5-8 can be due to the damage in
the white axonal tracts connecting brain motor areas 9,10. In about 80% cases, this happens due to
clotting of blood, known as ‘ischemic stroke’ and in the rest, this happens due to bursting of weak
Main causes behind ischemic stroke include (i) building up of atheroma, abnormal small
fatty lumps, along the walls of an artery (ii) infections that narrow blood vessels leading to brain
and (iii) sudden drop in blood pressure. About 10% of strokes occur in young adults (under the age
of 45) and the main causes included hypertension, tumors, migraine, consumption of alcohol and
other drugs such as cocaine and amphetamines, which may also narrow the blood vessels.
Sometimes breaking off atheroma also causes blockage of blood when it flows with the blood and
stops in smaller arteries. On the other hand, hemorrhagic stroke mainly occurs when weak blood
vessels rupture due to (i) abnormal accumulation of blood (ii) head injury (iii) brain tumors and (iv)
decrease in the levels of blood platelets due to bleeding disorders. There is another kind of stroke,
known as ‘transient ischemic attack’ or TIA, also called ‘mini-stroke’ or ‘warning stroke’. It has
same origins as that of ischemic stroke but it lasts only few minutes (less than 5 minutes) and
doesn’t cause permanent disability. About one-third of people who have TIA, suffer from stroke
within a year.
Stroke may result into temporary or permanent physical disability among stroke survivors.
Every year, more than 750,000 people suffer from stroke and about 80% of them experience trouble
in moving their body parts. General statistics by National stroke association show 10% of stroke
survivors recover almost completely whereas 15% die shortly after stroke and the rest either recover
with impairments or require special long-term care. These statistics are a mere reflection of the lack
of our understanding of the extent of brain function damage due to stroke and recovery following
rehabilitative treatments. Functional neuroimaging studies on healthy volunteers have shown that
several cortical areas of the human brain motor system interact coherently in the low frequency
range (< 0.1 Hz), even in the absence of explicit stimulation or tasks. Following stroke, these
functional organization is regained from rehabilitative treatments as people begin to recover motor
behaviors has not been systematically studied.
2.2 Rehabilitative treatments
Goal of rehabilitative treatments is to help the stroke survivors in learning the lost skills e.g.
coordinating their hand movements in order to do a task, when some part of their brain is affected
or completely damaged. Recently, several new rehabilitative interventions have been introduced.
Some stroke survivors use multiple interventions or combination of few interventions and for some
duration of intervention is longer compared to others, depending on their recovery, severity of their
symptoms and how they respond to the treatments.
Rehabilitative treatments mainly include- (i) dynamic splinting which helps the stroke
survivors to straighten their wrists and fingers (ii) electrical muscle simulation (EMS) which helps
in moving weak limb by using electric impulses delivered directly to skin using electrodes (iii)
robotic therapy devices-which guide the users to execute repeated movements (iv) transcranial
magnetic stimulation (TMS) which uses electromagnetic induction to induce weak currents and
helps in causing activity in specific parts of brain and (v) mirror therapy- to make it appear as if
stroke survivors are moving their affected arm, however, they actually look at the movement of
their unaffected hand. These days’ mental practice (MP) and physical therapy (PT) are two
frequently used evidence-based clinical interventions to enhance upper limb motor function
purportedly to improve motor movement, coordination and balance following stroke 11-13. Motor
imagery (MI) and motor execution (ME) are generally considered to be the most effective tasks in
these treatments. MP or MI represent mental rehearsal of a motor action without any overt action;
and has been shown to improve motor behaviors in people with neurologic disorders 14-16. It
referring to an experience, which can be auditory, visual, tactile or kinesthetic representing
movement. Likewise various forms of PT have been shown to be effective in ameliorating motor
weakness following stroke 17,18. It consists of more or less intensive affected limb exercise,
restricting the unaffected arm over a long period of time.
In this thesis, we report findings from 17 young able-bodied participants and 13-aged stroke
survivors. Six stroke participants were randomized to “mentally practice” (MP) a series of upper
limb functional motor tasks for four hours per day (8-30 minute sessions), with the guidance of an
audio tape, for a total of 60 hours over three weeks. Rest seven participants were randomized to
undergo MP+ physical therapy (PT). The MP+PT group underwent 15 days (4 hours per day) of
intensive one-on-one therapy, consisting of listening to the same MP tape for 60 minutes per day
plus 3 hours of physical therapy per day. Identical tapes were given to all participants and the six
mental practice tasks did not change, but small details of the mental practice scenarios such as the
type of drink or color/type of telephone one reached for were altered to enhance motivation and
lessen boredom. All sessions had identical contact durations and were monitored by a licensed
rehabilitation specialist. The investigators were blind to group assignment. Following the
three-week “training” period all participants underwent a second testing session recording both clinical
and physiologic measures.
3 BRAIN CONNECTIVITY MEASURES
3.1 Directed functional and effective connectivity measures
Over the last few years, many techniques have been proposed describing how different brain
areas interact with each other under different tasks and conditions. Several neuroimaging studies are
demerits of different connectivity approaches. Recently, the concepts of directed functional
connectivity and effective connectivity have become very prominent in the field of computational
neuroscience 19. Directed functional connectivity approaches, e.g. Granger causality (GC) 20,
assesses the cyclic functional association, among different brain areas. This approach is exploratory
enough and uses the idea of predictability and statistical dependencies to establish causal relations.
On the other hand, effective connectivity approaches, e.g. dynamic causal modeling (DCM) 21,
assumes brain as a dynamic system and makes inferences about the influence of one neural system
over the other. This approach is based on strong theoretical assumptions and specifies different
hypothesis in terms of different models.
GC and DCM are the two most common and predominant techniques for exploring
directionality among brain regions using electro/magneto encephalography (EEG/MEG) and fMRI
data. However, both have been a topic of debate from quite a long time because of their own merits
and demerits over each other. GC is mostly implemented via linear vector autoregressive (VAR)
modeling. It has capability of having time and frequency components simultaneously at which
different areas interact with each other. It can also be formulated in a way to evaluate exchange of
causal information among multivariate sets of responses.
Applications of GC have also been mentioned as controversial recently 19,22 and had been a
topic of debate in recent years. Some of the studies showed empirical and theoretical concerns
regarding its applications for fMRI data 22-24. Especially, it was thought that GC could be
problematic and miss-lead the causal influences because of variability in shape and latency of
hemodynamics response functions (HRFs) within brain and subject-wise as well 25-27. FMRI
demonstrates that hemodynamic response function is not identical and varies over the brain regions
well accepted measure used in analysis of electrophysiological time-series because of zero
temporal-lag between the responses 28,29. Although, Seth and colleagues in 2013 confirmed through
a set of simulations that GC is invariant to convolution of hemodynamic response function but
down-sampling the data to a variety of frequency severely interrupts the inferences made from GC
30. Also, a simulation study done by Deshpande and his colleagues in 2010 found that GC was
flexible enough to compensate hemodynamic variability 31. Bressler and Seth in 2010 very well
explained the applicability of GC to fMRI- showing GC as a well established methodology to
estimate causal statistical influences directly from data 32. They stated that HRFs are invariable
across the conditions and de-convolution of fMRI BOLD signals can be used to measure the neural
processes 26,33. In addition to that, not only neural activity but various other factors like slice timing
differences, baseline cerebral blood flow, baseline hematocrit, hemo-dilution, alcoholic/lipid
intakes, different respiration rates across individuals are also responsible for HRFs variability
31,34-36. Apart from that, it was also found that lower sampling rates could misinterpret fMRI GC 30,31. In
the near future, because of advancement in technology, it seems that the concerns associated with
lower sampling rate won’t remain a major problem 37. Wen and colleagues in 2013 addressed the
effect of various factors like (a) latency differences in HRF across different brain areas (b)
low-sampling rates and (c) noise by linking fMRI GC and neural GC using simulated data 38. For TR = 2
s and signal to noise ratio (SNR) = 5 (20% noise), they found a significant positive linear
relationship (r = 0.96, p =0) between the two in case of unidirectional coupling where as there was
no correlation found in reverse coupling. Correlation was improved at higher sampling rates. This
study in agreement with various other studies clarified that the convolution of HRF had no negative
impact on GC calculations where as severe down sampling and presence of noise beyond a certain
On the other side, DCM relies on probabilistic graphical models, which are specified in
terms of priors on the coupling parameters. It assumes that causal interactions among brain areas
are mediated by hidden neuronal dynamics, specified in terms of non-linear differential equations in
continuous time. Parameters of these equations reflect the connection strength, which are estimated
using Bayesian techniques 21,41. DCM doesn’t encounter the controversies raised due to
non-identical nature of hemodynamic response function because it directly models the hidden state
variables, which cause observed data. It was found that DCMs, which involved hidden state
variables, outperformed the DCMs, which were based on observations only 42.
Besides the fact that both GC and DCM are based on different facts and ideas, yet it was
suggested that both are complementary to each other and may be converging at some point 43,44. In
the present thesis, we have used both of these approaches: GC for resting-state fMRI data and DCM
task based fMRI data.
3.2 Spectral Granger causality measures
Spectral Granger causality measures are a subset of spectral interdependency measures 45.
Spectral interdependency measures are a means of statistically quantifying the inter-relationship
between oscillatory processes; say 1 and 2, as a function of frequency of oscillations. It consists of
three sub-measures: total interdependence (M1, 2), one-way directional influence either from 1 to 2
(M1→2) or 2 to 1 (M2→1) and instantaneous causal flow (M1.2) (Granger causality measures), which
are derived from a spectral density matrix (S) and are related by equation:
(3.1)
Spectral matrix (S) is constructed parametrically from the time-series of oscillatory systems
using autoregressive (AR) modeling 46. Diagonal elements of the matrix, S represent node activity
in terms of spectral power as a function of frequency whereas directional influences i.e. Granger
causality (GC) between 1 and 2 are given by:
(3.2)
where represent new transfer function matrices
for 1 and 2 respectively in terms of noise covariance matrix, Σ and transfer function matrix, H.
These are estimated from the residual errors and the inverse of the Fourier transforms of the
coefficients in autoregressive models respectively.
3.3 Dynamic causal modeling (DCM)
DCM is a hypothesis-based technique, which aims to describe how observed fMRI
responses are generated using a set of differential equations. DCM allows incorporating known
effects of interest and assessing task-dependent as well as tasking independent interactions among a
set of regions through a set of matrices, known as endogenous connectivity matrix, A and
modulatory matrix, B respectively 21,47. It estimates three sets of parameters: (a) task independent
endogenous connectivity (matrix A) among the regions representing influence without any external
perturbation (b) task dependent modulation affects (matrix B) representing changes in endogenous
connection strength due to external perturbations and (c) direct influence of an external input to a
region (matrix C). The underlying idea behind this is that it considers the brain as a non-linear
dynamic system where inputs are known along with experimental perturbations 21. This makes it
different and effective than other traditional approaches like Granger causality and structural M1→2(f)=ln
S22(f)
H11(f)Σ11H * 11(f)
M2→1(f)=ln
S11(f)
H22(f)Σ22H * 22(f)
,
H11=H11+ Σ12
equation modeling which assume interactions being linear without considering external inputs
and/or perturbations 48.
Basically, DCM inferences following two types of hypothesis based on question of interest:
3.3.1 Bayesian model selection (BMS) approach
BMS inferences on model structure as a whole, which is done by defining and constructing a model
space. Model space is usually a set of models, where each model defines specific endogenous
connections that are modulated by experimental perturbations. It is BMS procedure that identifies
the model which best explains how the data is generated by calculating exceedance probability of
each model 49,50. Exceedance probability represents the degree of belief about a model having
higher posterior probability than rest of the models 51.
Recently, the approach of BMS at the group level has been revised by Rigoux and his
colleagues 52. They extended BMS approach by introducing the ‘Bayesian omnibus risk (BOR)’
factor, which measures the statistical risk while performing group level BMS analysis. This
approach compares the likelihood of apparent differences in model frequencies by comparing
‘protected exceedance probabilities’ of proposed models i.e. it quantifies if a model is more
frequent than the other, above and beyond chance 52.
3.3.2 Bayesian model averaging (BMA) approach
For computational efficiency, BMA employs Occam’s window and discards all the models with
probability ratio < 0.05 compared to the optimal model 41,53. It inferences on each connection of the
optimal model found from BMS by averaging over all the optimal models from all the participants.
For group level inferences, BMS and BMA can be employed by either using fixed-effects
(FFX) analysis or random-effects analysis (RFX) depending upon whether the effect of interest
(model structure or parameters) is fixed or a random variable due to inter-subject variability (e.g. in
case of patients) across the population 54.
4 FUNCTIONAL REORGANIZATION AND RESTORATION DURING REST
FOLLOWING STROKE AND INTERVENTION
4.1 Introduction
Hemiparesis is one of the most common deficits observed following stroke 55. It means
slight weakness or paralysis on one side of the body. About 80% of people suffering from stroke
suffer from weakness on one side of their bodies. Due to limited clinical data compared to healthy
volunteers data, recovery and restorative brain mechanisms in stroke survivors are not clearly
understood. Specifically, scientists have yet to identify specific node and network activities of dam-
aged brains that are invoked and/or restored following rehabilitative treatments.
Mental practice (MP) and physical therapy (PT) are two evidence-based interventions
currently used to improve motor movement, coordination and balance following stroke 11-13. Here,
we studied the brain network mechanism for motor function recovery as a result of: MP only and
MP in combination with PT. We predicted that the interventions to improve motor performance in
stroke survivors would change the characteristic features of the brain motor network activity in such
a way as to have network commonalities with those of able-bodied healthy participants. The
strength of oscillatory network activity would correlate with the improvement in motor behaviors
independent of intervention or in either intervention. We tested this hypothesis by examining and
interventions and healthy controls using intrinsic blood oxygenation kevel dependence (BOLD)
functional magnetic resonance imaging (fMRI) measurements.
MP or motor imagery (MI) represents mental rehearsal of a motor action without any overt action;
and has been shown to improve motor behaviors in people with neurologic disorders 14-16. Likewise
various forms of PT have been shown to be effective in ameliorating motor weakness following
stroke 17,18. Recent neuroimaging studies 56-59 have extensively studied the brain motor networks
during resting-state (RS), motor imagery (MI) and motor execution (ME) and have shown that
overlapping networks are engaged in these task conditions. Planning, initiation, guidance and
coordination of voluntary movements could modulate functional connectivity in the motor networks
in these tasks 60. The motor network commonly includes: the primary motor area (M1), the
pre-motor cortex (PMC) and the supplementary pre-motor area (SMA) 59,61,62, which taken together play a
dominant role in the development, specification and execution of action. Activity in these cortical
areas during resting-state is thought to maintain a dynamic equilibrium but is modulated during a
motor task by disturbing the balance and coordination of local mutation inhibition 60. The primary
motor area (M1) is one of the principle brain areas that generates and sends neuronal signals to
control the execution of motor commands whereas secondary motor areas SMA and PMC are
involved in motor planning, sending neuronal impulses to M1. Also, asymmetries in PMC play an
important role in controlling interhemispheric interactions during bimanual motor task 63.
Anatomically, M1 is connected to SMA and PMC in the same as well as in the opposite hemisphere
allowing bilateral activity during rest, unimanual and bimanual hand movements 3,64-66.
Low frequency oscillations (LFOs) (< 0.1 Hz) in BOLD fMRI signals reflect self-organizing
dynamic behavior of the brain. Several cortical and subcortical regions, including motor regions
frequency (< 0.1 Hz) range during resting-state 4,67. The origin and functional relevance of these
oscillations have not been completely investigated 68-71. An emerging, well-accepted notion is that
these slow intrinsic fluctuations are believed to be associated with neural level excitability changes
in cortical and subcortical networks 69,72,73 which provides neural substrates for the flexibility and
variability in cognition and motor behaviors 74,75. These slow coherent oscillations are the backbone
of whole-brain functional connectivity networks such as default-mode networks 76,77 which are
actively being investigated in basic and clinical neuroscience 78,79. Despite tremendous progress in
revealing these network patterns in resting-state and clinical cases, the spectral features of
oscillatory network activity and their modulations in patients by task conditions or therapy are not
completely understood.
In this study, using the spectral version of Granger causality techniques 46,80,81, we
investigated how the oscillatory network activity in the low frequency band (<0.1 Hz) within the
motor network reorganizes in aged stroke survivors compared to young able-bodied participants as
these stroke survivors undergo two interventions, mental practice and combined mental practice and
physical therapy. The motor network we studied included: the left M1 (LM1), the right M1 (RM1),
the left PMC (LPMC), the right PMC (RPMC) and the SMA. Our prediction was that the strength
of oscillatory network activity would correlate with the improvement in motor behaviors
independent of intervention or in either intervention.
4.2 Materials and methods
4.2.1 Participants
We recorded resting-state fMRI data from a total of 30 adult participants (17 young
fixated on a cross in the center of a screen, relax and try not to fall asleep. Mean age of young
able-bodied participants (all right-handed, 12 males) was 25.17±4.68 years and the mean age of aged
stroke survivors (1 left-handed, 9 males) was 59.23±9.49 years.
Able-bodied participants: All the participants had no abnormal neurological history. None of them reported use of medication known to affect any neurological function. A written consent was
obtained from each participant before the experiment. The experimental protocol had appropriate
institutional review boards (IRB) approval.
Stroke survivors: To be included in the study, all stroke survivors had to be at least 18 years old, independent in standing, toilet transfer, and the ability to maintain balance for at least 2 min. with
arm support. Upper extremity movement criteria included the ability to actively extend the affected
wrist ≥20° and extend 2 fingers and thumb at least 10° with a motor activity log (MAL) score of
less than 2.5 82. All of them survived their first stroke within 54 months prior to enrollment. Either
MR imaging or computed tomography (CT) was used to confirm stroke and its location (Table 4.1).
Stroke latency ranged from 1 to 54 months. Six of them had left hemiparesis resulting from infarct
or hemorrhage located in the thalamus, basal ganglia, internal capsule, caudate, and/or precentral
gyrus. The remaining volunteers had right hemiparesis due to infarctions of the middle cerebral,
pontine or internal carotid arteries (Table 4.1) 8. The Mini-Mental State Exam (MMSE) was used to
assess cognitive aspects of mental function where a maximum score of 30 describes normal
cognition function 83 (Table 4.1). This measure constituted two sets of questions - one set tested
orientation, memory and attention whereas the second set tested the participant’s ability to name,
follow verbal and written commands, write a sentence spontaneously and copy a complex polygon.
The Fugl-Meyer Motor Assessments (FMA) was used to assess sensation and motor functions. This
extension synergy, movement combining synergies, movement out of synergy, normal reflex
assessment, wrist movement, hand movement, co-ordination and speed, each with a scale from 0 - 2
(0 for no performance, 1 for partial performance and 2 for complete performance) 84. The total
possible score was 66 where a score of nearly 33 represents moderate impairment of the affected
upper limb.
Table 4.1 Clinical and demographic data.
Age (in years), sex, post stroke duration (in months), the Mini-Mental State Exam scores and stroke
locations of the stroke group.
Participant Age
(years)
Sex Post stroke
(months)
MMSE Stroke location
1 55 F 5 30 L thal. hem.
2 55 M 1 27 L basal ganglia
3 52 M 8 24 R cingulate gyrus infarct
4 74 F 9 30 R caudate infarct
5 65 F 7 28 L caudate infarct
6 54 M 11 27 R putamen hem.
7 50 M 5 30 R lacunar infarct
(Globus pallidus)
8 69 F 8 28 R motor cortex infarct
9 64 M 54 28 R basal ganglia, thalamic hem.
M = male; F = female; MMSE = Mini-Mental State Exam.
4.2.2 Imaging
Each of the young able-bodied participants underwent one resting-state fMRI (rs-fMRI) scanning
session. Imaging was performed using a 3-Tesla Siemens whole-body MRI scanner. Functional
imaging was 7 minutes and 54 seconds long, and included a T2*- weighted echo planner imaging
(EPI) sequence (echo time (TE)=40 ms; repetition time (TR)=2000 ms; flip angle=90 degrees; field
of view (FOV)=24 cm, matrix=64x64; number of slices=33 and slice thickness=5 mm.
High-resolution T1-weighted images were acquired for anatomical references using an MPRAGE
sequence with an isotropic voxel size of 2 mm. Stroke participants underwent two rs-fMRI
scanning sessions. The second session was executed following an intervention where stroke
participants underwent either mental practice (MP) alone or mental practice combined with physical
therapy (MP+PT). The gap between the sessions ranged from 14-51 days and had a different
protocol than for young able-bodied participants. Their fMRI data was collected from a Siemens 3.0
T Magnetom Trio scanner (Siemens Medical Solutions, USA) and included TR/TE/FA=2350 ms/28
ms/90°, 130 time points (~5 min each), resolution=3x3x3 mm3and 35 axial slices.
4.2.3 Intervention details
The MP consisted of imagining four basic MI tasks using the affected or unaffected hand.
For instance, participants were asked: (1) to imagine brushing or combing their hair, (2) to imagine
picking up and bringing different types of fruit to their mouth, (3) to imagine extending their arm to
11 55 M 7 28 L internal capsule
12 62 M 7 28 L thalamic hem.
pick up a cup from a cabinet and place it on the counter and gently release it, and (4) to imagine
cleaning the kitchen counter using a cloth.
The PT consisted of repetitive, task-oriented training of the more-impaired upper extremity for
several hours a day (depending on the severity of the initial deficit). Task oriented training involved
functionally based activities performed continuously for a period of 15-20 min. (e.g. writing in a
journal). In successive periods of task training, the spatial requirement of the activity, or other
parameters (such as duration), were changed to require more demanding control of limb segments
for task completion. Feedback about overall performance was provided at the end of the 15-20 min.
period. A large bank of tasks was created for use among participants. Frequent rest intervals were
provided through the training session.
4.2.4 Data analysis
FMRI preprocessing: FMRI data were preprocessed by using SPM8 (Wellcome Trust Centre for Neuroimaging, London; http://www.fil.ion.ucl.ac.uk/spm/software/spm8/). The preprocessing steps
involved slice time correction, realignment, normalization and smoothing. Motion correction to the
first functional scan was performed within participant using a six-parameter rigid-body
transformation. Six motion parameters (three translational and three rotational) were stored and
used as nuisance covariates. Four able-bodied participants had either more than 2 mm of translation
or more than 1.5° of rotation about the three axes and were excluded from the analysis. The mean of
the motion-corrected images was then co-registered to the individual structural image using a
12-parameter affine transformation. The images were then spatially normalized to the Montreal
Neurological Institute (MNI) template 85 by applying a 12-parameter affine transformation,
an 8-mm isotropic Gaussian kernel and band-pass-filtered (0.04-0.1 Hz) in the temporal domain.
Regions of interest:Regions of interest (ROIs) for motor-execution network were defined using seed-based correlation mapping procedure to assess functional connectivity among the regions. The
left primary motor area (LM1) was selected as seed region with a 6 mm radius sphere centered at
(-33.0, -19.8, 52.1) in the MNI coordinate system. Voxel-wise BOLD time series for all the regions
were extracted by making masks using MARSBAR (http://marsbar.sourceforge.net/). The
correlated regions to the LM1 were the right primary motor area (RM1) centered at (35.7, -18.1,
52.0), the left pre-motor cortex (LPMC) centered at (-34.3, -1.4, 55.8), the right pre-motor cortex
(RPMC) centered at (35.1, 0.1, 54.9) and the midline supplementary motor area (SMA) centered at
(0.0, -4.2, 64.7) as used in a previous study 8. Previously, power spectra for data with TR>2 seconds
showed peak at frequency less than 0.04 Hz due to motion parameters 71. Therefore, in current
analysis, we extracted data from all the regions, linearly detrended and band-pass filtered within the
frequency range of 0.04 to 0.1 Hz.
4.2.5 Spectral Granger causality measures and significant tests
Using equation 3.2, Granger causality (GC) values were calculated among all the regions of interest
and were integrated (iGC) over the frequency range from 0.04 Hz ( ) to 0.1 Hz ( ), say from
region 1 to 2:
(4.1)
Thresholds for significance level of Granger causality for each participant - able-bodied (AB),
stroke survivors (SS), stroke survivors under treatments: mental practice (MP) and mental practice
and physical therapy (MP+PT) were computed by random permutation method 87. We considered
f1 f2
iGC1→2= 1
f2−f1
M1→2(f)df
f1
AB condition as reference level for SS to calculate percentage difference (D) in connectivity
strength. SS was used as reference for MP and MP+PT to calculate percent modulation (M) after
treatment of MP and MP+PT. This percent difference (D) and percent modulation (M) for SS and
for MP and MP+PT respectively were calculated as follows 3:
(4.2)
(4.3)
Here , , and represent integrated causal flow for stroke survivors (SS)
(no treatment), young able-bodied (AB) participants, stroke survivors with treatment of mental
practice (MP) only and stroke survivors with combined mental practice and physical therapy
(MP+PT) respectively.
4.3 Results
4.3.1 Power and GC spectra
Power and GC spectra for all five ROIs (LM1, RM1, LPMC, RPMC and SMA) were
computed for AB, SS, MP and MP+PT conditions. Average power spectra were computed from all
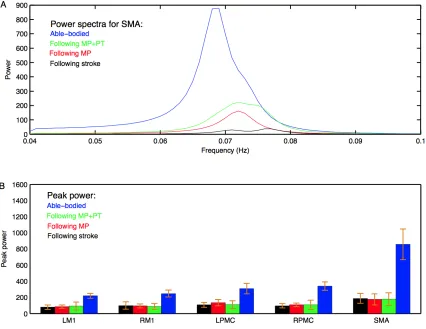
subjects (Appendix A.1). Figure 4.1A shows group level comparison of power spectra of SMA for
AB, SS, MP and MP+PT conditions. In all four conditions, for all the ROIs, the peaks for power
were in the frequency band 0.06-0.08 Hz (Appendix A.1). Figure 4.1B shows a comparison of peak
power of all ROIs for all conditions with standard error of mean. The peaks for GC spectra
(Appendix A.2: A-G) were also found in the same frequency band 0.06-0.08 Hz. Dashed lines in
the GC plots show a significant threshold (p < 0.01, sample size = 26) calculated from combined set
of data for AB and SS. D=iGCSS−iGCAB
iGCAB
×100%
M =iGCMP/MPPT−iGCSS
iGCMP/MPPT
×100%
Figure 4.1 Power spectra and peak power.
(A) Peak of power spectra for SMA occurs within the frequency band 0.06 – 0.08 Hz for young
able-bodied participants (blue colored plot), aged stroke survivors who underwent MP+PT (green
colored plot), aged stroke survivors who underwent MP only (red colored plot) and for aged stroke
survivors before intervention (black colored plot). (B) Peak power and the associated standard error
of the mean for each ROI in each condition is shown.
4.3.2 Directed functional connectivity
Directed functional connectivity among five ROIs was computed for AB, SS, MP and
who underwent MP+PT. For AB, seven connections were found that had significant causal flow,
including bidirectional causal flow between LM1 and SMA (Appendix A.2: A, D; blue line) and
between RPMC and SMA (Appendix A.2: B, G; blue line). Other connections having significant
causal flows were from RPMC to LM1 (Appendix A.2: C; blue line), SMA to RM1 (Appendix A.2:
E; blue line) and SMA to LPMC (Appendix A.2: F; blue line). Compared to AB, the stroke
survivors did not show significant causal flow (Appendix A.2: A-G; black lines). Compared to AB,
stroke survivors who underwent MP only did not demonstrate any connections with significant
causal flow (Appendix A.2: A-G, red line). On the other hand, stroke survivors who underwent
combined MP + PT showed three connections: between LM1 and SMA (Appendix A.2: D; green
line) and from SMA to LPMC (Appendix A.2: F; green line), with significant causal flows.
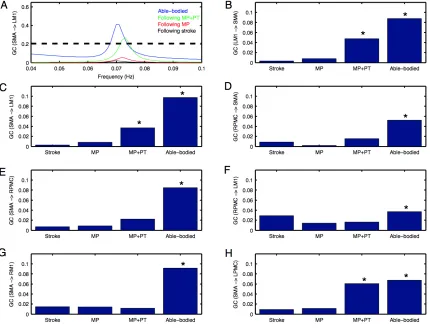
Integrated causal flow for all seven connections was calculated by using equation 4.1 (Figure 4.2:
B-H). Significant causal flows are marked with ∗ (p < 0.01, sample size = 26).
4.3.3 Connectivity modulations
We used equation 4.2 to compute percent difference (D) in connection strength for aged
stroke-survivors (SS) with respect to young able-bodied (AB) people. We found that the strength of
all the connections, which showed significant causal flow in AB, decreased and ranged from -21%
to -97% (Figure 4.3: A-B). Connection between SMA and LM1 was the most negatively affected
Figure 4.2 Granger causality (GC) spectra and integrated causal flow foryoung able bodied
and aged stroke survivors before and after intervention.
Significant causal flow is obtained from (A) SMA to LM1 for young able-bodied participants (blue
colored plot) and for aged stroke survivors who underwent MP+PT (green colored plot) whereas it
is not significant before intervention (black colored plot) and when the aged stroke-survivors
underwent MP only (red colored plot). Integrated causal flow for frequency band 0.04 – 0.1 Hz is
calculated for all the seven significant connections (B-H). Here * represents significant causal flow
values. Three connections: (B) LM1 to SMA (C) SMA to LM1 and (H) SMA to LPMC showed
significant causal flow values for aged stroke survivors after MP+PT whereas none of the causal
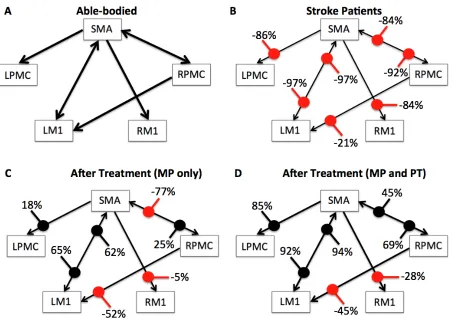
Figure 4.3 Percent difference and modulation.
Compared to (A) young ablebodied participants, percent decrease of the causal flow ranged from
-21% to -97% for aged stroke patients as shown in (B), whereas compared to aged stroke patients,
there was a percent modulation ranging from 18% to 65% for aged stroke patients who underwent
MP as shown in (C) and from 45% to 94% for aged stroke patients who underwent MP+PT as
shown in (D). Percent decrease and percent modulations are shown with red and black colored dots
respectively.
We used equation 4.3 to compute the percent modulation (M) of aged stroke survivors, who
had either MP or MP+PT treatment. We found that percent modulation for MP ranged from 18% to
modulated by 62%-65%. Three connections, from SMA to RM1, RPMC to LM1 and RPMC to
SMA were negatively modulated by 5%, 52% and 77% respectively. We found that percent
modulation for MP+PT ranged from 45% to 94% (Figure 4.3D). Here the most affective
connections were modulated by 92%-94%, which is much higher than during MP only. Two
connections, from SMA to RM1 and RPMC to LM1 were negatively modulated by 28% and 45%
respectively.
We were also interested in finding whether or not the behavior of the network differs for
AB, SS, MP and MP+PT groups and therefore we combined all seven significant connections in the
network and performed two-sample (un-paired) t-test for AB vs. SS, SS vs. MP, SS vs. MP+PT and
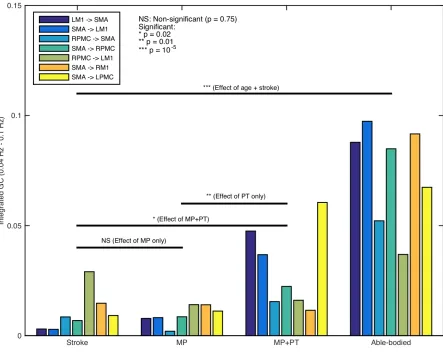
MP vs. MP+PT (Figure 4.4). We found that the network as a whole, consisting of seven significant
connections, was significantly stronger for young able-bodied volunteers than for aged
stroke-survivors (p = 10-5, sample size = 13, denoted by ∗∗∗). We also found that there was no significant
difference between the strength of networks when the aged stroke survivors had only performed MP
(p = 0.75, denoted by NS) whereas the network became significantly stronger when the aged stroke
survivors underwent combined, MP+PT (p = 0.02, denoted by ∗). We also found that the effect of
MP+PT was significantly stronger than MP only (p = 0.01, denoted by ∗∗).
4.3.4 Brain and behavior correlation
FMA scores were recorded for all the aged stroke-survivors before and after the intervention. Using
paired t-test, we found that FMA scores showed a trend towards significant increase when the
participants underwent MP (sample size = 6; p = 0.056; paired t-test) (Figure 4.5A) whereas the
scores increased significantly when the participants underwent MP+PT (sample size 7; p= 0.033;
Figure 4.4 Network activity comparisons
Considering the causal influences for all significant connections, stronger network activity (***p =
10-5) was observed for young able-bodied participants than aged stroke-survivors. No significant
difference between integrated causal flow values was found between aged stroke survivors before
and after mental practice (MP) (p = 0.75) whereas network activity was significantly higher when
they underwent combined session of mental practice and physical therapy (MP+PT) (*p = 0.02). We
also found that the network activity was significantly higher following MP+PT than following MP
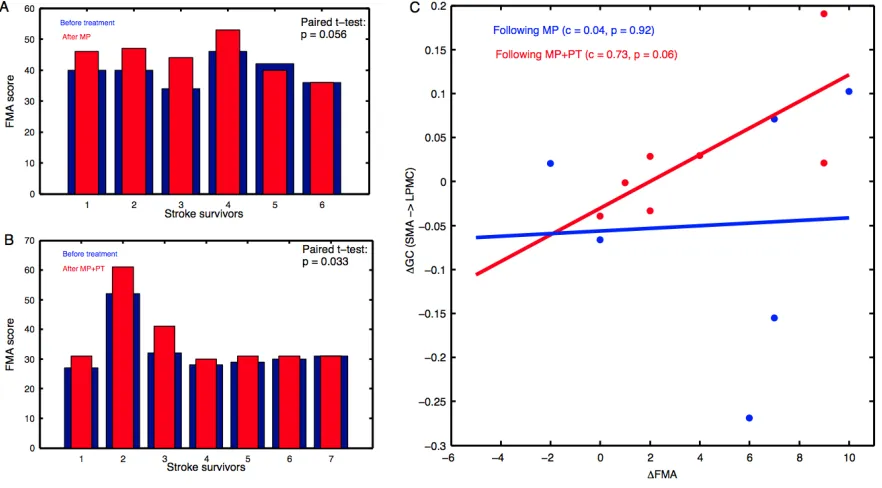
Figure 4.5 Brain and behavioral correlation
The Fugl-Meyer Motor Assessment (FMA) scores for aged stroke-survivors: (A) before
intervention (blue bars) and after MP (red bars), and (B) before intervention (blue bars) and after
MP+PT (red bars) are plotted. We also observed that for connection: (C) from SMA to LPMC, the
correlation between differences in FMA scores (ΔFMA) and GC values (ΔGC) before and after
MP+PT intervention showed a linear trend towards statistical significance but there was no trend
observed for MP alone.
For the brain and behavior correlation, the behavioral FMA score difference (ΔFMA) and brain GC
difference (ΔGC) showed a correlation trend for SMA to LPMC direction in case of MP+PT
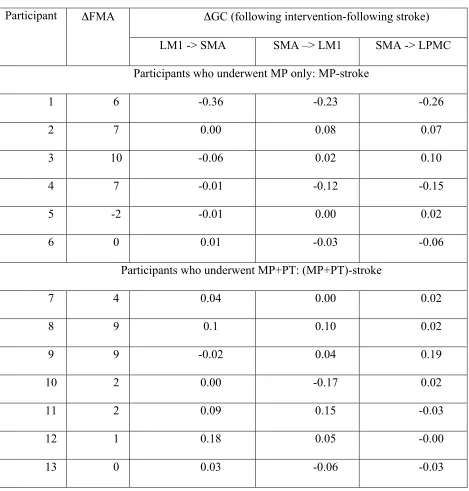
Table 4.2 Brain and behavior scores.
Differences in FMA scores (ΔFMA) and GC values (ΔGC) before and after the intervention.
Participant ΔFMA ΔGC (following intervention-following stroke)
LM1 -> SMA SMA –> LM1 SMA -> LPMC
Participants who underwent MP only: MP-stroke
1 6 -0.36 -0.23 -0.26
2 7 0.00 0.08 0.07
3 10 -0.06 0.02 0.10
4 7 -0.01 -0.12 -0.15
5 -2 -0.01 0.00 0.02
6 0 0.01 -0.03 -0.06
Participants who underwent MP+PT: (MP+PT)-stroke
7 4 0.04 0.00 0.02
8 9 0.1 0.10 0.02
9 9 -0.02 0.04 0.19
10 2 0.00 -0.17 0.02
11 2 0.09 0.15 -0.03
12 1 0.18 0.05 -0.00
13 0 0.03 -0.06 -0.03
4.4 Discussion
In this study, we used the spectral GC approach on resting-state fMRI data of 30 participants
to investigate the organization of motor-execution network for young able-bodied and aged stroke
survivors along with substantial changes after the stroke survivors underwent mental practice alone
or combined mental and physical therapy. We found that node and network activities were
dominant in the frequency band 0.06 Hz - 0.08 Hz for all participants in all conditions. We found
that node activity for each ROI was significantly higher in AB condition than SS condition but there
was no significant difference between node activities for SS, MP and MP+PT conditions. There
were bidirectional causal influences between LM1 and SMA, RPMC and SMA, RPMC and LM1,
SMA and RM1, and SMA to LPMC for young able-bodied participants, but none of the directions
were significant for aged stroke survivors even when they underwent a session of MP. Some of the
connections, for example between LM1 and SMA and from SMA to LPMC, showed significant
causal flow when aged stroke survivors underwent combined session of MP and PT (MP+PT).
Percent decrease in connection strength reflected by causal flow for aged stroke survivors compared
to young able-bodied ranged from -21% to -97% whereas the percent modulation for aged stroke
survivors with MP and MP+PT compared to those individuals receiving no treatment ranged
between 18% to 65% and 45% to 94% respectively. Furthermore, as predicted young able-bodied
participants demonstrated significantly stronger causal influence than aged stroke survivors. There
was no significant difference in causality before and after the MP treatment in aged stroke
survivors. But, causal flow was significantly stronger after MP+PT. Furthermore, causal flow after
MP+PT was also found to be significantly stronger than after MP only. We also found that the
FMA scores were significantly higher following intervention (MP+PT) in post-stroke hemiplegic
correlation, which tended towards significant value, between difference in FMA scores and
difference in directed functional connectivity measures from SMA to LPMC following stroke and
when the stroke-survivors underwent MP+PT.
4.4.1 Low-frequency network activity
Intrinsic functional networks usually show coherent oscillatory activity in the low
frequency band, less than 0.1 Hz. Spontaneous synaptic activity of neurons is known to give rise to
fluctuations in fMRI BOLD signals. These low-frequency oscillations are believed to mediate
long-distance synchronization of distributed brain regions, modulation of which represents cortical
excitability 3,4,69. Further evidence points to the notion that these oscillations have a definite
neuronal basis rather than the result of physiological artifact 4,88,89. The resting-state activity and the
spontaneous fluctuations also reflect the dynamic self-organizing nature of brain 90. The power of
such low-frequency fluctuations of brain signals may differ significantly between stroke survivors
and able-bodied healthy individuals 91, which is consistent with our results. Tsai and colleagues 92
reported that during the resting-state, the amplitude of low frequency oscillations is altered in
people with impaired consciousness following a stroke. Significant differences in the amplitude of
low frequency oscillations was also reported during resting-state in the brain areas of people
suffering from depression 93.
However, it has been postulated that following a stroke, brain network activity may deviate.
Fluctuations with frequency less than 0.1 Hz have been shown to contribute to resting-state
functional connectivity in auditory, visual and motor cortices 88. Strong coherence relationship
between motor areas have been found in the frequency band 0.02-0.15 Hz during rest as well as in
networks and of 0.01-0.14 Hz in limbic networks suggest the involvement of distinct frequency
bands in the resting-state fMRI signals 95.
4.4.2 Altered functional connectivity following stroke
Detailed descriptions of resting-state connectivity in stroke survivors may help rehabilitation
scientists recognize and target insulted neural networks with evidence-based therapies. It has been
suggested that coupling between distinctive cortical areas and their functionality following stroke
can be better understood in the absence of any active task 7. The degree of network disturbance and
reduction in network activity following stroke is mainly caused by weak or abnormal neural
coupling between higher order pre-motor and motor areas and is dependent on the age, location of
lesion and intensity of anatomical damage. Stroke may also leave a strong negative impact on the
coupling between the cortex and spinal cord and among cortical areas, which are contiguous or
removed from the location of lesion. Our findings are consistent with a dynamic causal modeling
(DCM) study by Rehme and colleagues, where changes in effective connectivity within M1, PMC
and SMA were observed following stroke 96 in which a reduction in positive coupling of SMA and
PMC with M1 was reported. In another DCM study of 12 sub-acute stroke patients during a hand
movement task, Grefkes and colleagues found intra-hemispheric and interhemispheric disturbances
due to subcortical lesions 97. They reported that the intrinsic neural coupling between SMA and M1
was significantly reduced in patients recovering from stroke. The deficiency in motor skills due to a
single subcortical lesion was thought to be related to pathological interhemispheric interactions
among core motor regions. In comparison to able-bodied participants, weaker paths weights have
been found from PMC to M1 for stroke patients 98. Patients with stroke had significantly diminished
confirmatory model. Our findings also showed a significantly diminished motor network compared
to healthy participants. In addition, abnormal effective connectivity has been shown between PMC,
SMA and prefrontal cortex in patients with Parkinson’s disease due to disturbed functionality of a
subcortical circuit 99.
4.4.3 Recovered functional connectivity following rehabilitation
Several studies on animals and humans provide insight demonstrating the basis of recovery
mechanisms. Studies in rodent models have shown multiple cellular level changes occur in the
unaffected hemisphere during recovery from stroke 100. A study on non-human primates have
shown that the degree of motor impairment after stroke depends upon the damage to direct
corticospinal connections between neurons in motor areas M1, PMC and SMA and alpha-motor
neurons 101. Motor recovery may be associated with increased activation in the SMA 102. Various
hypotheses have been proposed describing the source of activations in SMA. It is believed that
without execution of a motor plan, MP or mental rehearsal forms a hypothetical environment of
movements, which causes activation of motor preparation or motor execution network 61. Lotze and
colleagues (Lotze, et al. 103) in an fMRI study of healthy participants have verified this observation,
where supplementary motor area (SMA), premotor cortex (PMC) and primary motor area (M1) are
found to be consistently active during motor execution as well as during motor imagery task.
Activation of the same neural populations during MP and physical actions may be because of the
same vegetative responses elicited by both 13. Performance times are also found to be close for
imagined and physically performed tasks with different levels of difficulty 104,105. Treatment by MP,
which is fundamentally rehearsal of an action mentally without any physical effort, is usually
networks following MP has been observed in the current study which may be because both
motor-imagery and motor-execution are known to associate with similar brain networks. Brain studies
have confirmed a correspondence between imagined and executed movements and considered MI
as a dynamic process with a strong correlation with motor-execution. Mental rehearsal by itself or
in combination with physical practice has been proven to be beneficial for healthy as well as for
mentally challenged individuals 15,106. Our report that MP with motor imagery may cause the
internal simulation of movements but not enough to match with young able-bodied participants
whereas repetitive physical practice combined with MP causes a stronger cortical reorganization
and improved functional interactions is consistent with previous findings 13,107. Our findings of the
directed functional connectivity changes for stroke patients following rehabilitation are consistent
with a study by Rehme and colleagues who also reported an increase in coupling between SMA,
M1 and PMC following rehabilitation 96. SMA and PMC are found to have direct extensive
projections to M1 in non-human primates 108 and may play a critical role in motor recovery.
Findings from a study by James and colleagues suggested that the unaffected hemisphere has a
strong and direct influence on the affected hemisphere following stroke, but this influence
diminishes with recovery 5. Despite the variability due to heterogeneity of lesion locations in our
sample of aged stroke-survivors, our current findings suggest a significant influence of
rehabilitation therapy such as MP+PT on motor networks and upper limb motor recovery in
post-stroke hemiplegic patients.
Previous studies 13,109,110 have shown that the combination of MP and PT is helpful in
improving functional and motor skills more than PT only. MP by itself is considered an effective
technique to enhance motor performance by tracing the overlap between motor imagery and motor
deficiency in motor skills following MP is less than physically trained participants 112. We found
that the combination of MP and PT significantly improved the connectivity between specific
cortical areas as well as for motor-execution network as a whole and tended towards connectivity
values of healthy participants. These findings are in-line with our behavioral results where we
reported that the FMA scores for patients who received MP+PT are significantly higher than before
intervention. Differences in FMA scores and GC values before and after MP+PT also follow a
linear trend. Page and colleagues also observed that the patients who received MP+PT improved
significantly by an average of 7.81 and 6.72 points on the Action Research Arm (ARA) test and
Upper Extremity Fugl-Meyer Assessment of Motor Recovery After Stroke (FM) respectively
whereas patients who received PT and relaxation showed significantly lower scores of only 0.44
points and 1 point on the ARA and FM respectively 113.
We also found that there was decrease in causal flow values from SMA to RM1, RPMC to
LM1 and RPMC to SMA after MP. The decrease in causal values was less when aged stroke
patients underwent MP+PT. The decrease in value could be because mental practice or imagery
usually consists of a set of relatively independent processing sub-systems 114,115. Lack of
simultaneous activations in these sub-systems may result in weakening of the connections in motor
network. Mental practice may also involve some manipulation, producing descriptions of the task
or daydreaming 114,116. Hence, whether and how long these weak interactions arising from mental
practice are retained is an interesting question for future investigations.
Limitations: Lesion locations in our sample of participants were not homogeneous. This may have added variability to the connectivity measures for some of the regions of interest.
The sample included stroke survivors with a wide age and time since stroke, hence further adding
able-bodied volunteers can provide better references for brain connectivity comparisons and may give
better estimates of connectivity improvements comparable with able-bodied patients. Despite the
variability and this limitation, our data show excellent correlation between brain network activity
flow and behavioral measures within the recovering stroke patients of similar age group.
4.4.4 Conclusions
In conclusion, the results of the current study suggest that the fMRI BOLD brain signals can
capture the network activity flow changes within the cortical motor-execution network following
stroke and during the course of rehabilitation and recovery. The combination of mental practice and
physical therapy is an effective treatment option, capable of producing significant behavioral and
brain activity changes. The directed functional connectivity approach allows us to probe the brain
network mechanisms during the course of motor recovery from stroke, providing the basis for
clinical decisions making and selection of treatments for stroke patients.
5 EFFECTIVE CONNECTIVITY DURING IMAGERY AND
MOTOR-EXECUTION FOLLOWING STROKE AND REHABILITATION
5.1 Introduction
Motor-imagery and motor-execution tasks have been used to study motor recovery in people
following stroke 13,15,117,118. Previous studies have investigated the effects of stroke on motor
networks 5,14,110,119 but there is little data on the effects of interventions on motor behavior and
motor network interactions. Here, by using a dynamical causal modeling (DCM) approach 21,44,120,
we investigated effective connectivity among three motor areas: the primary motor cortex (M1), the