https://doi.org/10.5194/hess-22-5657-2018 © Author(s) 2018. This work is distributed under the Creative Commons Attribution 4.0 License.
Challenges to implementing bottom-up flood risk decision analysis
frameworks: how strong are social networks
of flooding professionals?
James O. Knighton1, Osamu Tsuda2, Rebecca Elliott3, and M. Todd Walter1
1Department of Biological and Environmental Engineering, Cornell University, Ithaca, 14850, USA 2Department of Architecture, Art, and Planning, Cornell University, Ithaca, 14850, USA
3Department of Sociology, London School of Economics, London, WC2A 2AE, UK
Correspondence:James O. Knighton ([email protected]) Received: 11 June 2018 – Discussion started: 13 July 2018
Revised: 29 September 2018 – Accepted: 18 October 2018 – Published: 1 November 2018
Abstract.Recent developments in bottom-up vulnerability-based decision analysis frameworks present promising op-portunities for flood practitioners to simplify complex deci-sions regarding risk mitigation and climate adaptation. This family of methodologies relies on strong social networks among flood practitioners and the public to support careful definition of stakeholder-relevant thresholds and vulnerabili-ties to hazards. In parallel, flood researchers are directly con-sidering distinct atmospheric mechanisms that induce flood-ing to readily incorporate information on future climate pro-jections. We perform a case study of flood professionals actively engaged in flood risk mitigation within Tompkins County, New York, USA, a community dealing with moder-ate flooding, to gage how much variance exists among pro-fessionals from the perspective of establishing a bottom-up flood mitigation study from an atmospheric perspective. Re-sults of this case study indicate disagreement among flooding professionals as to which socioeconomic losses constitute a flood, disagreement on anticipated community needs, weak understanding of climate–weather–flood linkages, and some disagreement on community perceptions of climate adap-tation. In aggregate, the knowledge base of the Tompkins County flood practitioners provides a well-defined picture of community vulnerability and perceptions. Our research supports the growing evidence that collaborative interdisci-plinary flood mitigation work could reduce risk, and poten-tially better support the implementation of emerging bottom-up decision analysis frameworks for flood mitigation and cli-mate adaptation.
1 Introduction
Societal vulnerability to riverine flooding is a complex func-tion of physical hydrological processes, overlaid with our economic relationship to the land (Wheater and Evans, 2009), community perceptions and responses to risk (e.g., Vinh Hung et al., 2007), and the fundamental ability of ex-perts to clearly communicate these risks to facilitate deci-sions by policy makers (Pappenberger et al., 2013). Recent flood losses across North America, Europe, and Asia have been exacerbated by uninformed and inaccurate prior be-liefs surrounding riverine flood hazards (Merz et al., 2015), fundamental issues in how governmental organizations store and leverage data (Lane et al., 2011; Harries and Penning-Rowsell, 2011), the cognitive biases of individuals (Merz et al., 2015; Harries, 2008), socially organized apathy (Nor-gaard, 2011), and governmental response to societal devia-tions from anticipated rational behavior (Lupton, 2013).
Flooding governance is typically discussed as being “top-down” or “bottom-up.” Top-down typically refers to a tech-nocratic hierarchy, often in the form of national institutions acting as the sole decision makers (e.g., Serra-Llobet et al., 2016; Plate, 2002). These approaches have been associated with a reliance on hazard-based assessments of risk. Bottom-up approaches, in contrast, leverage the knowledge, experi-ences, preferexperi-ences, and vulnerabilities of end users explic-itly in problem definition and selection of mitigation ac-tions. In bottom-up approaches, decision-making is generally a collaborative process across institutions. Previous work has shown that flood risk mitigation can benefit from a combina-tion of top-down and bottom-up approaches whereby deci-sions are collaboratively refined and implemented across in-stitutions (Serra-Llobet et al., 2016), often with direct input from stakeholders (e.g., Edelenbos et al., 2017; J. Knighton et al., 2017). Pahl-Wostl et al. (2013) demonstrate, through a case study of three European nations, the relative bene-fits of different governance schemes. Top-down mitigation, as found in Germany, allowed for clearer roles in decision-making, centralized repositories of knowledge, and more rapid action within limited windows of opportunity. The ver-tically integrated approaches of the Netherlands and Hun-gary allowed for greater integration of new information into policy decisions. In an effort to tackle some of the “wicked problem” characteristics of water resources challenges, re-searchers have been engaged in developing bottom-up frame-works for decision-making with a focus on problems accom-panied by deep uncertainty (e.g., Many-Objective Robust Decision Making Kasprzyk et al., 2013; Scenario Neutral Planning Prudhomme, 2010, Decision Scaling Brown et al., 2012) with applications developed specifically to aid flood risk decision analysis (e.g., Evers et al., 2018; J. Knighton et al., 2017).
Bottom-up decision analysis methodologies initially focus on understanding system vulnerabilities (i.e., what are the negative consequences of a flood that we wish to avoid?), mapping these vulnerabilities onto a wide range of plausible hazard scenarios (e.g., if an n-year flood occurs, which of the previously defined losses will we experience and possi-bly to what severity?), and then evaluating which of these hazard scenarios are most likely given our current under-standing of atmospheric and hydrological processes. Flood decision-making can be stalled by contentious discussions about the reliability of hazard data (e.g., is climate change driving changes to local storms? Should climate change be accounted for in mitigation planning?). A bottom-up per-spective can improve decision-making in that uncertain data and potentially controversial methodologies can be evaluated within the context of community risks. For example, climate-change-driven changes to storm intensity may not increase frequency severe economic losses, and therefore can possi-bly be disregarded. Such public debates over the “accuracy” of hazard data and risk estimation, of the kind illustrated by recurrent controversies surrounding flood insurance rate
maps in the USA (Elliott and Rush, 2017), reflect a techno-cratic faith that pegs decision-making to the purported abil-ity of risk analysis to arrive at single true estimates of risk, which models typically do not and cannot provide (Wein-kle and Pielke Jr., 2017). Vulnerability-based assessments, by contrast, map hazards directly to community vulnerabili-ties in order to produce stakeholder-relevant predictions and outcomes, thereby enhancing the broader legitimacy of any subsequent actions taken.
This is not, however, how risk mitigation planning and design has historically been conceptually modeled within the USA. Instead, it has been treated as a top-down pro-cess, with knowledge transfer between two distinct groups comprised of lay people and experts (Wood et al., 2012; Birkholz et al., 2014), the former typically understood as be-ing ignorant or “overly emotional” while the latter are pre-sumed to be rational and “analytical” (Lupton, 2013). How-ever, this fails to capture how both groups approach issues of risk and natural hazards. As discussed in Norgaard (2011), a “knowledge deficit” model that assumes lay people would take (rational) action if they “only knew” is too limiting, as it leaves aside the institutional structures (Harries and Penning-Rowsell, 2011) and cultural differences (e.g., Masuda and Garvin, 2006) that shape orientations to risk, institutional re-sponses, and community vulnerabilities.
Furthermore, the simplistic distinction between profes-sionals and lay people is often blurred in practice. Though the momentum driving flood risk mitigation originates at the federal level within the USA (Burby, 2001) and many other nations, implementation of national policies and redistribu-tion of resources relies on social infrastructure at the local level (Few, 2003; Rauken et al., 2015; Vogel and Henstra, 2015). Within the USA, Canada, Australia, and Europe, flood governance is frequently the collective effort of organiza-tions operating across scales, including governmental orga-nizations, nongovernmental organizations (NGOs), privately owned firms, citizen-led groups, and private research organi-zations (Plummer et al., 2018). Within these organiorgani-zations, the individuals who participate can be considered experts in one subdiscipline of flood risk mitigation, with shifting leadership roles throughout the process. For instance, gov-ernmental organizations may take the lead on policy and leg-islation, while privately owned firms contribute hydrologic modeling, and residents and citizen-led groups share knowl-edge about local vulnerabilities to and effects of exposure to flood risk. These coalitions benefit by leveraging the skills, knowledge, and social position of the varied organizations to more effectively reduce flooding risk.
institutions and the public have previously led to more ef-fective means of disaster risk mitigation and climate adapta-tion at the state level (Clarvis and Engle, 2015; Haer et al., 2016). Opportunities to limit cognitive biases should be ex-plored to reduce institutional vulnerability to flooding (Merz et al., 2015), though few research projects have considered how differences among flooding practitioners may be under-stood or modified to further reduce vulnerability to flooding hazards (e.g., Morss et al., 2005; Downton et al., 2005).
Given the intensity and complexity of the cooperation and coordination required to plan and implement flood risk miti-gation, establishing common understandings – of community vulnerability to flooding, baseline flood loss frequency, com-munity willingness, and project-desired goals – is a challeng-ing and nontrivial task (Pahl-Wostl, 2009), particularly given diverse backgrounds, education, work experience, and risk exposure of stakeholders found in interdisciplinary working groups. de Brito and Evers (2016) reviewed multi-criteria de-cision analysis efforts and found that interdisciplinary deci-sion analysis efforts across multiple stakeholder groups (in-cluding both professionals and lay people) were rare. It is therefore worth re-examining existing social networks and constructs at the local level to determine where such common understandings can be enhanced in the context of bottom-up methodologies for flood risk analysis. This need is particu-larly relevant when flood risk mitigation planning incorpo-rates climate adaptation goals surrounded by deep uncertain-ties (Downton et al., 2005; Merz et al., 2015).
We address this gap with a case study survey of 50 pro-fessionals working on riverine flood risk mitigation within Tompkins County, New York, USA. We define “profes-sional” and “practitioner” here as a subset of flooding risk stakeholders within Tompkins County who have more agency around flood hazard mitigation than that of a commu-nity member stakeholder. Our operational definition of pro-fessional includes propro-fessionals in private practice and re-search, elected government officials, appointed government officials, governmental employees, and volunteer members of advocacy groups with a water resources focus. This fo-cus allows us to understand how the social connectedness among flooding practitioners and their community influences the flood risk mitigation planning and design process. We specifically focus this research on understanding how well positioned this network of flooding professionals is to be-gin a bottom-up vulnerability-based flood hazard mitigation plan. The results of this research show that professionals are not a monolithic category, as they vary in their knowledge of historical hydrologic events, perceptions of existing flood-ing vulnerability and risk, and perceptions of the need to in-corporate future climate estimates into flood risk mitigation planning and design at the outset of a flood mitigation plan-ning process. We compare survey results to available hydro-logic data to determine how classic approaches focused on hydrologic data can be supplemented with socio-hydrologic
information, and identify opportunities for strengthening in-terdisciplinary networks.
2 Methodology
2.1 Study region: Tompkins County
Tompkins County lies within central New York, USA. Ar-eas of high population density are clustered within 15 towns and villages, each developed adjacent to a fourth-order or higher stream. The county population is approximately 100 000 people across 1300 km2, with a median household income of approximately USD 48 000 (United States Cen-sus, 2017) (about USD 10 000 below the 2016 median house-hold income for the USA). Tompkins County legislature is presently composed of 10 registered Democrats, 4 registered Republicans, and 1 Independent (TC, 2018), suggesting a Democratic partisan lean.
Federal Emergency Management Adjacency (FEMA) flood insurance rate maps, last updated in 1996, suggest that 3749 parcels lie within the 100-year special flood haz-ard area, of which 1874 are located within the City of Ithaca. From 1978 through 2012, 229 flood loss claims (6.7 claims yr−1) were submitted through the National Flood Insurance Program (NFIP), totaling USD 1 593 201 (∼46 900 USD yr−1) (TC, 2013). The Tompkins County Hazard Mitigation Plan, established in 2013 to review county flood losses and propose corrective actions, is updated annu-ally.
Tompkins County contains four fourth-order or greater streams that are tributaries to Cayuga Lake. An active Na-tional Weather Service (NWS) flood stage has been es-tablished for USGS gage 04234000 (USGS, 2018), which is representative of flooding within the City of Ithaca, a low-lying densely populated community within Tompkins County. Based on annual peak flow records, exceedance of the 2 m levees or discharge in excess of 120 m3s−1 within Fall Creek (adjacent to the City of Ithaca) is estimated to be a 9-year event (J. Knighton et al., 2017), though we note that this estimate may vary depending on the period of record considered.
Tompkins County receives an average of 1000 mm of pre-cipitation annually, with 15 % as snowfall (NCDC, 2018). The county is approximately 45 % forested, 45 % agricul-tural land use (row crops), and 10 % urban (Fry et al., 2011). A shallow confining layer (0.5 to 1.5 m) leads to a preva-lence of saturation excess runoff (Easton et al., 2007). Re-gionally, surface runoff is primarily generated during the spring following extratropical rain-on-snow coincident with frozen or saturated soils and during the fall period of tropical-moisture-derived precipitation (Knighton and Walter, 2016; J. Knighton et al., 2017; J. O. Knighton et al., 2017).
rel-ative to the conterminous USA (Slater and Villarini 2016). Downscaled CMIP5 projections of future precipitation (pro-jected years 2015–2100) suggest a slight increase in air tem-peratures and an associated increase in annual maxima pre-cipitation intensity (Schoof and Robeson, 2016; Ning et al., 2015). Inter-seasonal predictions of future precipitation for Tompkins County show high variability, and potentially in-accurate estimates of seasonal extreme rainfall related to nu-merical and physical limitations of current general circula-tion models (GCMs) (Wobus et al., 2017; J. Knighton et al., 2017). The difficulty in predicting future extreme precipita-tion and strong influence of the land surface on flood runoff (Ivancic and Shaw, 2015; J. O. Knighton et al., 2017) has yielded projections of mild to no increase in future riverine flooding hazard in the Northeast USA, often accompanied by high uncertainty (e.g., Hirabayashi et al., 2013; Wing et al., 2018), or an average increase in risk, but with high spatial variability (e.g., Wobus et al., 2017). Broadly, this region ex-ists with relatively high uncertainty with respect to future cli-mate trends and riverine flood frequency. We anticipate that this lack of a clear signal from state-of-the-art climate and flood projections on the anticipated future flooding risk may create added difficulty and ambiguity for local decisions con-cerning the need for local climate adaptation.
2.2 Questionnaire design
Prior to designing the survey, we conducted semi-structured interviews (methodology described by Hermanowicz, 2002) with 10 flooding professionals within Tompkins County from January 2017 through August 2017. Each interview was ini-tiated with a series of general questions on the topic of flood-ing, and shortly thereafter interviewees were encouraged to move the discussion in their own direction of interest. The purpose of these interviews was to develop an exhaustive in-ventory of themes concerning the challenges faced by profes-sionals engaging in group decision-making and to catalogue ideas about flooding commonly held by flood risk mitigation practitioners. Common themes included a professional’s un-derstanding of where flooding has occurred frequently within the county, a professional’s understanding of what socioeco-nomic losses constituted a flood, a professional’s perceived community concern about shifting flooding risk under cli-mate change, and potential disagreement among profession-als around the design goprofession-als of a countywide flood mitigation project.
We distributed a questionnaire to community members who engage directly with flooding through development of policy and legislation, science and engineering, educa-tion, community outreach, and advocacy. Candidate partic-ipants were identified by the Tompkins County Environmen-tal Management Council (EMC), the citizen advisory board to Tompkins County. The EMC’s varied experience, long-standing community connections, and formal liaison role be-tween the public, Tompkins County Planning Department,
and Tompkins County Legislature allowed it to make in-formed selections for this study. A review of the final survey was performed by the Cornell University Institutional Re-view Board and found to have no ethical implications related to human subjects’ participation. A draft of the survey is in the Supplement.
Survey questions were a mixture of Likert-scale ques-tions, multiple choice selection, and open-ended response. The questionnaire was developed by the authors and piloted with five members of the Tompkins County EMC. The ques-tionnaire was administered by email on 27 October 2017 via an online platform. Four survey responses were delivered on paper due to limited access to the internet.
The first goal of the questionnaire was to understand if historical socio-hydrologic data are distributed broadly among flood professionals within Tompkins County. The survey prompted recipients to enter anecdotal information on historical flooding events, specifically, location, date of event, magnitude (i.e., known high water elevations), and known economic losses. The survey then focused on col-lecting information on participants’ perceptions of current regional flood hazard, risk, and community needs. Individ-uals were asked to determine what forms of social or eco-nomic loss constituted a flood. Individuals were then asked to report their perception of current flooding frequency within their community, and what frequency of flooding would be deemed acceptable. As recommended by Merz et al. (2014) flood studies may benefit from a consideration of how unique weather types and patterns impact flooding. In drawing this explicit link between global climate and local weather we may better understand potential nonstationary nature of flooding, and how and when climate adaptation should be considered within flood hazard mitigation. The final section of the survey aimed to determine an individual’s understand-ing of how local and regional weather drive floodunderstand-ing within Tompkins County. We asked several questions aimed at un-derstanding flood practitioners’ perceptions of community knowledge and desires for climate adaptation planning.
As will be discussed in the results, our survey population was comprised of a relatively small working group of pro-fessionals within Tompkins County, New York (n=50). Our focus on this specific population within Tompkins County led to an inherently small sample size, though the surveyed pop-ulation was representative of a large proportion of the total population identified (n=89). We therefore used qualitative interpretation of our survey results in place of formal statis-tical tests. Our survey question and all results are publicly available in Knighton (2018).
2.3 Hydrometeorological data analysis
a catalog of tropical storms (Roth and Weather Predictions Center, 2012), and the personal account of Michael Thorne (City of Ithaca Superintendent of Public Works, personal communication, 2018) to identify two recent ice jam events. Return periods for extreme daily precipitation totals were es-timated with NOAA Atlas 14 (Percia et al., 2015).
We compare the spatial distribution of flooding as esti-mated from the FEMA National Flood Hazard Layer (NFHL) 100-year floodplain (FEMA, 2018) and flood practitioner re-ports.
Historical streamflow records were collected for Fall Creek (USGS, 2018) for the period of 1925 to 2018. We use an annual block maxima approach to identify the significant floods within the publically available long-term hydrologic record. We compare reports of historical flooding from com-munity members to understand how we can best develop a complete record of county flooding.
3 Results
3.1 Response rate
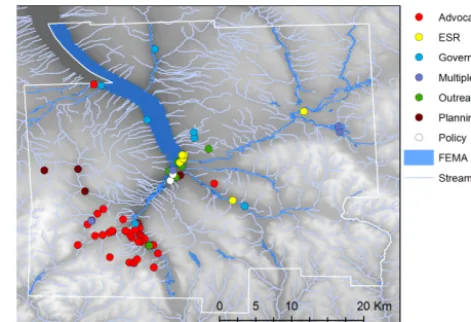
The survey was distributed to 89 professionals, of which 50 responded (response rate of 56 %). Individuals were asked to self-sort into one of six possible roles: community plan-ning (n=8), education and outreach (n=8), local govern-ment leadership (n=9), policy (n=5), advocacy (n=9), and Engineering, Science and Research (ESR;n=11). We first asked flooding professionals whether they believed they had a good understanding of flood risk mitigation, to which 52 % indicated they had a strong grasp of the subject, 38 % knew of a professional who could inform them, and 10 % were not knowledgeable on the subject (two policy, one edu-cation and outreach, one government, and one advocacy). 3.2 Spatial distribution of socioeconomic flood losses Anecdotal reports of flooding were compiled to provide a spatial depiction of commonly flooded locations within Tompkins County (Fig. 1), as recalled by research par-ticipants. Anecdotal flood reports by community members demonstrate that flooding is a countywide issue, with the most commonly recollected flooding centered on the most densely populated areas. The reported locations of flooding cover substantially more locations than those falling within the official 100-year special flood hazard area, as depicted on FEMA’s flood insurance rate map (FEMA, 2018). This is typical of many flood-prone areas; over 20 % of flood insur-ance claims come from losses outside of currently mapped high-risk zones (where flood insurance is available but not mandatory) (FEMA, 2015).
NWS flood stage on Fall Creek in Ithaca is estimated to be exceeded with a 9-year recurrence interval. However, re-ported dates of flooding events (Table 1) suggest that for much of Tompkins County, professionals have collected
in-Figure 1.Spatial distribution of survey-reported flooding within Tompkins County (filled circles) and FEMA 100-year flood plain (dark blue).
formation on negative socioeconomic consequences from events that are hydrologically more frequent than the 9-year Fall Creek baseline, suggesting that primary sources of hy-drologic data alone do not provide a complete depiction of flooding hazards within the county.
Weather types assigned to each reported historical flood-ing event indicate that floodflood-ing has been induced by local extreme convective precipitation, tropical-moisture-derived precipitation, extratropical rain-on-snow/snowmelt, and ice jams. Weather types for events prior to 1930 were not identi-fied due to inconsistency among available sources.
3.3 Defining flooding by socioeconomic losses
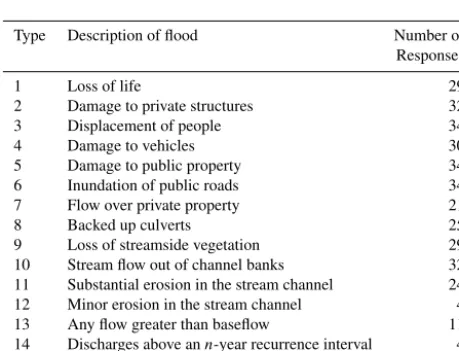
Exploratory interviews with community leaders suggested that there were 13 socioeconomic losses that individuals commonly used to define a past flooding event (Table 2). The survey presented these 13 possible flooding losses and asked flooding practitioners to define which types of loss consti-tuted a flood. Surveyed individuals also had the option to write in their own preferred definition.
[image:5.612.310.546.68.229.2]Table 1.Reported historical flooding events. Rainfall totals are the maximum daily precipitation (NCDC, 2018). Return periods are deter-mined from NOAA Atlas 14 (Percia et al., 2015).
Date Rainfall Return period Weather type (m/d/yr) (cm day−1) (yr)
4/18/1905 1.2 < 1 – 6/3/1905 4.3 < 1 – 6/17/1905 4.6 < 1 – 7/3/1905 4.8 < 1 –
7/8/1935 20.0 > 1000 Tropical/local convective rain∗ 11/3/1954 4.0 < 1 Hurricane Hazel
6/23/1972 9.0 10 Hurricane Agnes 10/28/1981 12.9 25 Local convective rain 1/19/1996 4.7 < 1 Rain on snow 4/3/2005 5.7 2 Rain on snow 9/8/2011 11.3 25 Tropical Storm Lee 1/11/2014 0.0 < 1 Ice jam
6/14/2015 10.4 10 Local convective rain 7/1/2017 0.9 < 1 Local convective rain 1/12/2018 2.4 < 1 Ice jam
∗Statewide flooding was reported to result from a mixture of a tropical moisture export and local
[image:6.612.308.547.339.514.2]convective rainfall.
Table 2.Results of which socioeconomic losses were considered a flooding event. Types 14 and 15 are write-in responses.
Type Description of flood Number of
Responses
1 Loss of life 29
2 Damage to private structures 32
3 Displacement of people 34
4 Damage to vehicles 30
5 Damage to public property 34
6 Inundation of public roads 34
7 Flow over private property 21
8 Backed up culverts 25
9 Loss of streamside vegetation 29
10 Stream flow out of channel banks 32
11 Substantial erosion in the stream channel 24
12 Minor erosion in the stream channel 4
13 Any flow greater than baseflow 11
14 Discharges above ann-year recurrence interval 4
15 Any negative impact to resources 1
3.4 Perceptions of current and desired flood frequency Estimates of the current flooding return period for Tomp-kins County varied slightly by discipline; however, most es-timates were below the baseline flood return period estab-lished for Fall Creek of the 9-year event (Fig. 3a). The de-sired reduction in flooding return period varied considerably by discipline. The median ESR, community planning, and outreach response suggests that the expected flood frequency after mitigation efforts should be slightly higher than cur-rent flooding hazard (Fig. 3b). The median responses from governmental employees working on legislation and policy desired flood frequency to be reduced to the 100-year event,
Figure 2.Socioeconomic losses that defined flooding events by dis-cipline (Table 2 subset by disdis-cipline). Values in parentheses indicate the number of respondents who did not offer an answer.
suggesting a high level of disagreement between disciplines on anticipated outcomes of flood hazard mitigation. This dif-ference could potentially be due to governmental focus on well-established floodplain thresholds (FEMA, 2018) versus perceptions of the physical limits of hydrologic alteration.
[image:6.612.51.281.370.545.2]net-Figure 3.Estimated(a)current flood loss return period and(b) de-sired return period resulting from flood hazard mitigation efforts. Reports of desired frequency above 100 years are presented as 100-year for visualization. Red lines indicate the median.
work for communication of risks as knowledge was spatially constrained by discipline. The Tompkins County hazard mit-igation plan contains county records of historical events. This record is presently derived exclusively from federal sources (TC, 2013; NCDC, 2018), with no formal mechanism to col-lect and archive anecdotal accounts of flooding within the community. In the absence of a centralized county database to collect and share personal experiences among profession-als, an individual’s primary spatial knowledge of flooding may be most derived from their own individual experiences, related to place of residence or locations of previous work. Local flood hazard mitigation plans in the USA typically suf-fer from low quality as they are primarily developed as a re-quirement to maintain access to federal funding instead of functional plans for risk mitigation (Lyles et al., 2014).
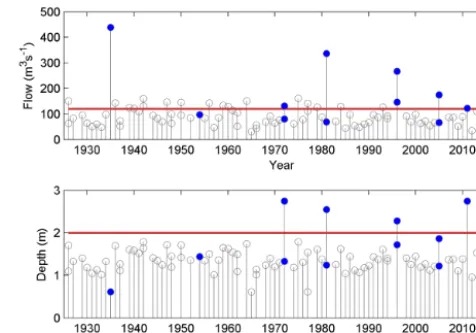
We compare aggregated reports of flooding (Fig. 1, Ta-ble 1) to the long-term historical record of Fall Creek (Fig. 4a and b). Results indicate that aggregated records from all com-munity members successfully identify the substantial flood-ing events for which Fall Creek overtopped the 2 m levee or greatly exceeded the channel capacity of 120 m3s−1. It is worth noting that prior to 1970 annual peak flow frequently exceeded 120 m3s−1, yet did not exceed the current NWS flood stage of 2 m. This could be due to a change stream dis-charge monitoring, or a physical change in the stream rating curve. It was beyond the scope of this study to investigate the cause of the shift in hydrologic response.
[image:7.612.49.287.66.160.2]The continuous hydrologic data of Fall Creek discharge and stage do not successfully identify all reported flooding events. Though Fall Creek is the largest watershed within Tompkins County (contributing drainage area of 325 km2) and has been monitored continuously for over a century, a purely hydrologic-hazard-based assessment considering only primary hydrologic measurements does not provide a com-plete picture of flooding across the county. The large con-tributing drainage area (time of concentration∼6 h) results in a hydrologic system sensitive only to weather events on the order of 6 h or longer. Continuous hydrologic monitor-ing records contain accurate information at the location of measurement, which is useful for developing flood frequency
Figure 4.Annual block maxima:(a)peak instantaneous discharge and(b)peak stage for Fall Creek. Blue dots indicate that the event was identified as a flood by at least one survey response. Red lines indicate the hazard thresholds for(a)exceeding channel capacity, and(b)overtopping the 2 m levee within the City of Ithaca.
curves and hydrologic models. Survey reports of flooding, while less quantitative, benefit from broader spatial cover-age and often include anecdotal accounts of socioeconomic losses (e.g., Marjerison et al., 2016). Together, primary hy-drologic measurements (e.g., continuous stream depth) and anecdotal survey reports of flooding losses help to develop a more complete picture of the flooding hazard and risk profile within Tompkins County.
3.5 Climate–flood linkages
Surveyed individuals were asked to report which type of weather mechanism (1 – extratropical system, 2 – local con-vective rainfall, 3 – tropical moisture derived rainfall, 4 – snowmelt events, 5 – ice jam) contributed to flooding within Tompkins County, with the option to write in flooding mech-anisms. Optional write-in mechanisms included “Sever [sic] thunderstorms,” “dramatic increase in stream levels for any reason”, and “extreme rain”. Responses and write-in results suggest that there is a general understanding that rainfall and air temperatures relate to flooding events; however, there was no strong agreement within any group that a given weather mechanism contributed directly to flooding outside of county planners agreeing that local convective rainfall contributed to flooding (Fig. 5). This result suggests that practitioners may have a limited understanding of weather–flood linkages.
[image:7.612.309.547.67.233.2]Figure 5. Reported flooding mechanisms that contribute to local flooding: 1 – extratropical system, 2 – local convective rainfall, 3 – tropical moisture derived rainfall, 4 – snowmelt events, 5 – release of ice jam. Values in parentheses indicate the number of respondents who did not offer an answer.
Table 3.Perceptions of future riverine flooding risk within Tomp-kins County by flooding practitioners.
Not Less Same More sure risk risk risk
Community planning 0 0 0 8 Education and outreach 1 0 1 5 Local government leadership 2 0 1 5 Policy development 3 0 0 2 Public advocacy 3 0 0 6
ESR 4 0 3 4
Total 15 0 5 30
results, with only 48 % (n=24) and 38 % (n=19) of all responses suggesting snowmelt and ice jam release, respec-tively, were important flooding mechanisms within Tomp-kins County.
Anticipation of the need to incorporate climate adaptation into flood risk planning, as well as anxiety around “commu-nity perceptions” and “public opposition to planning for cli-mate change” were common themes that emerged during the 2017 semi-structured interviews. Flooding practitioners were asked which direction they anticipated future flooding risk within Tompkins County would move. The majority of indi-viduals, 30, believed that flooding risk would increase, and 15 responded that they were not sure (Table 3).
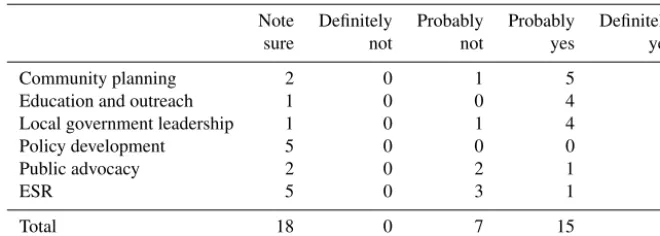
Surveyed professionals were asked if they perceived a community desire to implement climate adaptation practices in flood mitigation planning. The result here was less clear, with 18 responding they were not sure, 7 probably not, 15 probably yes, and 6 definitely yes (Table 4). The Tompkins County Planning Department acknowledges hazards posed
by climate change and the need for climate adaptation; how-ever, the current county plan only focuses on maintaining ex-isting natural and built infrastructure. No large-scale flood mitigation projects currently incorporate climate adaptation in planning and design (TC, 2015). There was some dis-agreement among disciplines on public preference for cli-mate adaptation, with ESR and public advocacy perceiving less interest, and outreach and government perceiving more interest (Table 4).
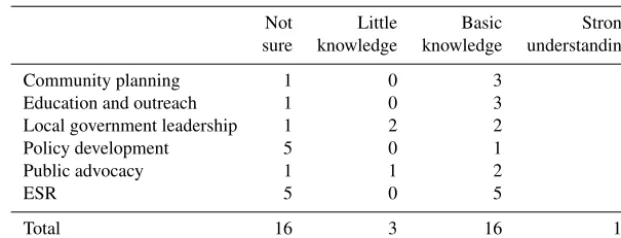
We next asked practitioners to report their perceptions of the level of climate science knowledge of residents of Tomp-kins County. Results were divided, with 16 responding that they were not sure, 16 believing that residents had basic knowledge, and 10 believe strong knowledge. Results were not substantially different among the disciplines (Table 5). 3.6 Optional write-in responses
At the conclusion of the survey professionals were given the option to provide any additional information or thoughts on the topic beyond the survey responses provided. We sum-marize here the results of these submissions. Though we do not aim to interpret these results, they can offer important insights beyond what was captured in the survey questions.
Five professionals supplied optional comments in which they said that they had little knowledge of community per-ceptions and expressed difficulty in answering these partic-ular questions, with one professional suggesting that com-munity perception was perhaps too broad to accurately de-fine with one single answer. Three responses suggested that they had a good understanding of community perceptions through involvement with county government and expressed that there was a willingness among the Tompkins County public to involve climate adaptation practices in flood risk mitigation. Four responses attributed recent flooding events to improper control of existing flood mitigation infrastruc-ture by local, state, and federal government. One response listed the ecological benefits of flooding, and suggested that rather than seek mitigation opportunities to control floods, we seek to adapt human behavior.
4 Discussion
4.1 Definitions and extents of flooding
[image:8.612.48.285.354.472.2]Table 4.Perceptions of community desire to implement climate adaptation planning in flood risk mitigation.
Note Definitely Probably Probably Definitely sure not not yes yes
Community planning 2 0 1 5 2 Education and outreach 1 0 0 4 0 Local government leadership 1 0 1 4 1 Policy development 5 0 0 0 1
Public advocacy 2 0 2 1 0
ESR 5 0 3 1 2
Total 18 0 7 15 6
stakeholder needs. A conceptual disconnect on the definition of flooding points to issues with the core problem statement that coalitions of flooding professionals are self-organized to solve.
While formal guidelines exist at the US national level (Obama, 2015), these definitions often conflate risk and haz-ard. Formal federal definitions in the USA commonly fo-cus on hydrologic hazard posed by a static water surface elevation, as in FEMA flood insurance rate maps (FEMA, 2018), neglecting hazard associated with discharge velocity, duration of inundation, and suspended material. In addition, the focus on hydrologic hazard can obscure from view the uneven socio-spatial distribution of exposure and vulnera-bility, which often aligns with prevailing axes of inequality along lines of race and class. The same flood event may be a nuisance for an affluent community and complete devas-tation for a poor one. Differences in reported flooding loca-tions between the survey and established FEMA flood zone maps (Fig. 1) could potentially be explained by the distinc-tion between hazard- and vulnerability-based definidistinc-tions of flooding. For instance, when floods hit particularly vulnera-ble communities, their impacts may be dramatized in ways that allow them to retain salience in the minds and memories of stakeholders.
Gober and Wheater (2015) propose a broad reconceptu-alization of flood risk analysis that accounts for emergent and complex interactions between water and society includ-ing the role of social memory in magnifyinclud-ing risk perception (Di Baldassarre et al., 2015) or actual risks (Collenteur et al., 2015), public perception, policy limitations, windows of opportunity, and an imperfect flow of knowledge through so-ciety. Such conceptual models may extend unrealistically be-yond the capacity of local flood professionals, though we can consider that expanding the definition of flooding beyond the traditional flood frequency realm could allow practitioners to more easily realize the benefits of bottom-up flood risk anal-ysis frameworks. Flooding practitioners increasingly face de-cisions about the appropriate level of abstraction when defin-ing socio-hydrology problem statements (Troy et al., 2015; Blair and Buytaert, 2016). Preemptively limiting the com-plexity of a problem in the planning stage possibly
intro-duces new vulnerabilities in the form of “surprise” (Merz et al., 2015). It is possible that surprise can be avoided or re-duced, even without consensus on community vulnerability through encouraging interdisciplinary discourse (Di Baldas-sarre et al., 2016).
4.2 Perceptions of climate–weather–flood linkages and climate adaptation planning
Researchers are moving towards reframing flooding risk from the perspective of the distinct atmospheric mechanisms that induce floods (Merz et al., 2014) in an effort to sim-plify the interpretation of how mesoscale global trends (e.g., global climate change, decadal global oscillations) influ-ence local weather patterns and subsequently local flooding. Within the Northeast USA, this problem is often expressed as nonstationary rainfall intensity and warming air temperatures that may drive flooding hazards (e.g., DeGaetano, 2009).
Current climate projections of summer extreme precipita-tion for Tompkins County predict increases in air tempera-tures and precipitation intensity (DeGaetano, 2009), though regional estimates of future flooding hazard are accompanied by high uncertainty (J. Knighton et al., 2017). While warm-ing air temperatures are likely to enhance the melt rate of the standing snowpack, it could also limit total snowpack accu-mulation, tempering the effect of climate change on winter flooding (J. O. Knighton et al., 2017). Similarly, during the summer season warming air temperatures will likely result in reduced soil moisture, tempering extreme runoff. Though an increase in the intensity of precipitation is often expected to translate directly into increased discharge (e.g., Trenberth, 2011), this outcome is not necessarily expected in the North-east USA (Ivancic and Shaw, 2015).
Table 5.Perceptions of general community knowledge level of climate science and adaptation.
Not Little Basic Strong sure knowledge knowledge understanding
Community planning 1 0 3 5 Education and outreach 1 0 3 1 Local government leadership 1 2 2 2 Policy development 5 0 1 0
Public advocacy 1 1 2 1
ESR 5 0 5 1
Total 16 3 16 10
around established climate–flood linkages. As demonstrated in Table 1, individuals reported historically significant flood-ing events. Through a simplistic weather-typflood-ing analysis, we determined that these events encompassed the atmospheric mechanisms of extratropical rain-on-snow events, snowmelt, local convective precipitation, tropical storms, and release of ice jams. The reported knowledge of weather systems that induce flooding suggested that professionals did not have a strong grasp on climate–flood linkages, particularly among those engaged in policy development (Fig. 5). Many write-in answers indicated that individuals often did not consider the atmosphere–land surface complexity beyond that of a simple input–output system.
Individuals were asked about their beliefs on future flood-ing risk and two questions pertainflood-ing to perceptions of com-munity knowledge and preferences around climate adapta-tion planning. First, responses indicated that approximately one-third of all professionals surveyed were unsure about community perceptions of climate science and the impor-tance of implementing climate adaptation practices into flood hazard mitigation. Practitioners agreed that communities had some understanding of climate science that was either basic or good. Practitioners disagreed on the community desire to incorporate climate adaptation practices into flood mitigation planning, which may reflect the politically contentious nature of climate change in US political discourse and policymaking more generally. Previous research has demonstrated discon-nections between public climate–flood risk perceptions and expert opinion (e.g., Hamilton et al., 2016; Ogunbode et al., 2017; Shepard et al., 2018). In this case study, profession-als disagreed on both community perceptions (Table 4) and climate education (Table 5). While there may be conceptual differences in the beliefs of lay people and experts, we pos-sibly take for granted that experts effectively understand and represent complex community needs and beliefs in the flood mitigation planning process.
4.3 Perceptions of flooding expertise and social networks of professionals
As previously described, 52 % of flooding professionals within Tompkins County reported that they had a good un-derstanding of flood risk mitigation, and 40 % reported that they did not, but had a resource who could inform them, suggesting a well-connected network among professionals. Survey results indicate strong disagreement among flooding professionals as to which socioeconomic losses constitute a flood (Table 2), incomplete knowledge of the spatial extent of flooding within Tompkins County (Fig. 1), disagreement on anticipated community needs (Fig. 3b), weak understand-ing of climate–weather–flood linkages (Fig. 5), and some dis-agreement on community perceptions on climate adaptation (Tables 4 and 5).
The results of this research suggest a case in which prac-titioners may believe that they are well informed and share commonly held beliefs, while in reality the network of flood-ing professionals is less well established or holds divergent perceptions or terminologies regarding flooding. Instances in which decision makers believe their perspective is commonly held can open problematic possibilities and new vulnerabili-ties. Flood risk is a particularly difficult problem to address, owing to the infrequent nature of hydrologic extremes, non-linear relationship between rainfall, runoff, and exposure, and potential socioeconomic feedbacks that develop between society and flood hazards (e.g., the “levee effect”; Collenteur et al., 2015). The large number of professionals who reported that they have a strong grasp of the subject could potentially indicate a susceptibility to cognitive biases influencing flood mitigation planning and design (Merz et al., 2015). For ex-ample, practitioners may be particularly susceptible to over-confidence and confirmation bias with respect to their cur-rently held understanding of existing flood risks.
this research identifies gaps in the social networks of flooding professionals. Inflexibility among professionals to consider variations in project goals or risk tolerance can lead to un-desirable flood mitigation outcomes (Downton et al., 2005). Disagreements on the definitions of flooding and community preferences for flood mitigation are perhaps expected results at the inception of a flood mitigation project and present op-portunities for flooding professionals to engage more directly across disciplines.
Implementation of emerging robust decision-making frameworks (e.g., Prudhomme 2010; Brown et al., 2012) commonly dictate that a bottom-up approach be taken with regard to defining the problem and weighting desirable out-comes. These approaches place significant emphasis on un-derstanding community vulnerability (Pielke et al., 2012) as the initial objective. Our results suggest that profession-als engaging in flood mitigation within Tompkins County are in agreement about exposure (Fig. 3a), but have some disagreement around flood vulnerabilities (Fig. 1) and an-ticipated needs (Fig. 3b). Substantial differences emerged in how the six groups of professionals responded to cer-tain questions. ESR preferred to define flooding from a clas-sic perspective, focusing on hydrologically relevant metrics (e.g., the n-year discharge and exceedance of bankfull dis-charge), whereas individuals in planning, government, and advocacy defined flooding very broadly, from a bottom-up perspective of the associated socioeconomic losses. This par-ticular result is not surprising as there is substantial variation in professional norms among the participating flood mitiga-tion roles owing to educamitiga-tion, experience, and their respec-tive audiences/constituencies.
Distinct institutions working on flood mitigation may en-gage differently with primary and secondary data sources. For example, engineering, science, and biophysical research groups are typically focused on the collection and interpreta-tion of meteorological and hydrologic data, while those en-gaged in public outreach may be more responsible for the collection and interpretation of socio-hydrologic data (i.e., historical flooding economic losses, migration), and govern-mental organizations may best understand policy implica-tions of flood investments. The organization of social net-works of professionals working in the realm of flood risk re-duction remains a fairly unstudied subject, though it is partic-ularly relevant as communication of highly uncertain infor-mation among professional disciplines remains a challeng-ing task (e.g., Pappenberger et al., 2013; Morss et al., 2005; Downton et al., 2005). Social organizations may lead to the development of risk perception networks, whereby clusters of individuals share the same risk perception (Scherer and Cho, 2003). Conversely, dissimilar groups may tend to de-velop less connected relationships, where information qual-ity is only high within a subset of organizations and shared only when necessary. Finally, disagreement surrounding the role of primary data and expression of hydrologic uncertainty
can lead to suboptimal solutions or inaction (e.g., Downton et al., 2005).
Independently operating institutions at the local level com-monly hold individual goals (Butler and Pidgeon, 2011; Measham et al., 2011), which may be distinct from the col-lective flood risk mitigation goal. Given their orientation and obligations toward voters and taxpayers, governing organi-zations are commonly driven by a desire for continued local economic (re)development (Molotch, 1999) as well as preoc-cupied with concerns around “blame” and “credit” for social outcomes (Leong and Howlett, 2017). This sometimes re-sults in a narrow temporal focus and decisions that are made with limited consideration for decadal or longer processes (Gober and Wheater, 2015). Private firms may be concerned with maintaining profitable contracts, job security, ethics, and liability. NGOs and advocacy groups may be concerned with developing and maintaining public interest (Lorenzoni and Pidgeon, 2006). Research organizations are often con-cerned with developing new science and engineering tech-niques, with a tendency to avoid advocacy and maintenance of impartial stances on controversial subjects (Singh et al., 2014).
Disconnections among the network of professionals could also be related to compartmentalization of urban and nonur-ban problems. Tompkins County contains 1 urnonur-ban center (City of Ithaca) and 14 less densely populated towns and villages. Observed differences in flooding perception among professionals could stem from the differences in community structures and land use within Tompkins County. Urban fill substantially alters the hydrologic response of urban areas, potentially confounding the relationship between rainfall and runoff (Knighton et al., 2014) that is not experienced in less developed areas with native soils. We note that reports of flooding and flood loss claims are greatest within the City of Ithaca (TC, 2013), possibly suggesting that a combination of regional hydrology and population density is driving the per-ception of flooding risk and the need for mitigation within the City of Ithaca; however, Marjerison et al. (2016), through a broader spatial study, suggest that local population density may not be a sufficient regional factor to determine flooding frequency perception. Beyond density, urban vulnerabilities and problems are often considered to be distinct from nonur-ban areas due to greater sociopolitical institutional complex-ity and less deliberate communcomplex-ity planning (Zevenbergen et al., 2008).
2016; Edelenbos et al., 2017). Public willingness to take risk reduction measures has previously been attributed myr-iad variables including actual risk and societal norms (Lo, 2013), income (Lo, 2014), exposure to or protection from past events (Di Baldassarre et al., 2013), and trust in expert opinion (Wachinger et al., 2013). Though disagreement be-tween flooding practitioners and the public may occur, estab-lishing these social connections could be an important step towards establishing trust, building public support for miti-gation projects, and opening opportunities to collect socio-hydrologic data which could improve flood mitigation plan-ning and design.
4.4 Broader impacts
European nations (e.g., Næss et al., 2005), the UK (e.g., Brown and Damery, 2002), African and Asian nations (e.g., Huntjens et al., 2011), and the USA face the prospect of enacting water governance and developing policy within a changing climate. Recent research has focused heavily on the shortcomings of top-down approaches to flood hazard miti-gation as enacted by a variety of governmental organizations. For example, Brown and Damery (2002) explore the struc-tural issues present in a top-down governance scheme within the UK and conclude that a focus on hazard leads to im-proper problem definitions and “undersocialized” solutions. Subsequent research has proposed that governance leverag-ing both top-down and bottom-up schemes could improve the efficiency with which a nation incorporates societal vulnera-bility information into policy (e.g., Pahl-Wostl et al., 2010), thereby lowering societal risk.
Recent applications of decision analysis frameworks for flood mitigation within Europe (e.g., Evers et al., 2018) and the USA (e.g., J. Knighton et al., 2017) highlight the tech-nical potential of these approaches, yet as a research com-munity, we have not fully explored these frameworks outside of a handful of carefully controlled case studies. As more attention is being given to bottom-up approaches as a poten-tial panacea for flood hazard mitigation, a critical assessment of governmental organizations, institutions, and practitioners becomes more necessary to explore possibilities for new un-foreseen vulnerabilities that may emerge.
It is worth discussing that several aspects of our study catchment may have implications for how these results can be interpreted and applied to other locations. Our re-search focuses exclusively on a network of professionals within Tompkins County, New York (USA), with a dis-tinctly bottom-up structure for flood governance. The county is moderately sized (population of 100 000) and experiences moderate flooding (∼9-year recurrence interval for socioe-conomic riverine flood losses).
With respect to county population and flood loss fre-quency, we can possibly anticipate that the social connect-edness of professionals would increase with increasing com-munity size and flood frequency. Both larger populations and
increased frequency of hazards could lead to more complete records of historical floods and increased connectivity among professionals. It is possible that increased exposure to flood frequency would reduce cognitive biases (e.g., Merz et al., 2015), leading to an “adaptation effect” (Di Baldassarre et al., 2015). Conversely, less exposure, as would be expected with a smaller population and less flooding risks, would be expected to decrease social understanding of flooding risks (Collenteur et al., 2015) and less established networks of pro-fessionals.
Broadly, there are several aspects of this research which may allow our results to be more globally applicable. First, the local governmental and institutional organization of this case study mirrors that of other US and Euro-pean cities, which suggests the possibility of similar insti-tutional vulnerabilities associated with local governmental, private, and community organizations. For example, Bracken et al. (2016), studying flood management within the UK, describe a similarly loose coalition of experts from govern-mental and nongoverngovern-mental organizations to those observed within our research. Second, the reliance of bottom-up deci-sion analysis frameworks on networks of people exists in-dependent of local governmental structure, and would likely contribute similar vulnerabilities as we have observed. Merz et al. (2015) review a series of historical floods across Eu-rope that resulted in increased devastation as a result of sur-prise. Surprise is then attributed by Merz et al. (2015) to cog-nitive biases “hardwired in the human brain.” It is possible that the divergent perceptions and definitions that we observe among Tompkins County professionals are indicative of uni-versal human traits, rather than simply a local phenomenon. Finally, our methodology is easily adapted, and could be ap-plied to uncover new vulnerabilities in parallel governmental structures in other nations.
5 Conclusion
Research advances have demonstrated that explicitly sepa-rating storms by weather types allows for stronger inferences on future flooding hazards.
Flood hazard and risk mitigation in the USA is often car-ried out at the local level by an informal collection of gov-ernmental, nongovgov-ernmental, private, and academic institu-tions. Previous research has observed variations in how insti-tutions approach flood hazard, owing to differences in edu-cational and professional backgrounds, variations in their re-lationship to socio-hydrologic data, and which goals or out-comes are deemed desirable. Given these discrepancies, there is a strong need to review differences among disciplines to ensure that emerging bottom-up vulnerability-based frame-works can be readily incorporated into local planning efforts. Our research demonstrates that there are broad differ-ences in belief among practicing professionals within Tomp-kins County, New York, USA, as to what socioeconomic losses constitute a flooding event and spatially disaggre-gated knowledge of historically flooded locations. There was strong agreement on the frequency of flooding experienced by residents, but disagreement around the desired level of protection from a flood mitigation effort. These results sug-gest that there is some variance among flooding profession-als in the definition of community vulnerability to flooding. Undisclosed or unknown disparities in perceptions among flooding practitioners could serve as barriers to successfully implementing vulnerability-based frameworks for decision analysis. Developing strong definitions of flooding vulner-ability may not require explicit agreement among all practi-tioners, but rather venues that allow for productive processes of deliberation. These venues necessarily involve multiple, diverse stakeholders, whose input shapes an outcome that all parties can agree is procedurally fair and acceptable.
Explicit consideration of climate–flood linkages showed similar barriers based on practitioners’ knowledge. Profes-sionals identified historical events induced by five unique mechanisms, but failed to identify these types of weather events as important causes of local floods. Among the sur-vey results there is an intuitive sense that intense rain causes flooding, though it is possible this limited understanding pre-vents conceptual connections of local epre-vents to regional and global climate patterns. These discrepancies could serve as a barrier to implementing important advances in flood risk engineering that aim to use relevant climate projections to inform local planning.
In aggregate, the knowledge base of the Tompkins County flood practitioners served to provide a well-defined picture of community vulnerability and perceptions, though the be-liefs of individuals varied. Previous research suggests that collaborative efforts can work to improve connections be-tween social networks of experts and lay people. This re-search demonstrates the need for interdisciplinary rere-search, planning, and design throughout flood risk mitigation and climate adaptation planning to maintain strong social
con-nections, not just between lay people and experts, but among experts.
Data availability. Our data are publically available in Knighton (2018).
Supplement. The supplement related to this article is available online at: https://doi.org/10.5194/hess-22-5657-2018-supplement.
Author contributions. Research concept design was the joint effort of JK, OT, and MTW. Survey design, distribution, and collection of responses were performed by JK and OT. Data analysis was formed by JK. Interpretation of the results and discussion was per-formed by JK, RE, and MTW.
Competing interests. The authors declare that they have no conflict of interest.
Acknowledgements. This research was supported by an En-gaged Opportunity Grant from the Cornell University Office of Engagement Initiatives. We acknowledge the contributions of the Tompkins County Environmental Management Council in identifying flood hazard mitigation practitioners within Tompkins County. We specifically thank Michael Thorne (City of Ithaca Superintendent of Public Works) and Scott Doyle (Tompkins County Planning Department) for their guidance on this research.
Edited by: Xing Yuan
Reviewed by: two anonymous referees
References
Agel, L., Barlow, M., Qian, J. H., Colby, F., Douglas, E., and Eich-ler, T.: Climatology of daily precipitation and extreme precipita-tion events in the northeast United States, J. Hydrometeorol., 16, 2537–2557. https://doi.org/10.1175/JHM-D-14-0147.1, 2015. Birkholz, S., Muro, M., Jeffrey, P., and Smith, H. M.:
Rethinking the relationship between flood risk perception and flood management, Sci. Total Environ., 478, 12–20, https://doi.org/10.1016/j.scitotenv.2014.01.061, 2014.
Blair, P. and Buytaert, W.: Socio-hydrological modelling: a review asking “why, what and how?”, Hydrol. Earth Syst. Sci., 20, 443– 478, https://doi.org/10.5194/hess-20-443-2016, 2016.
Bracken, L. J., Oughton, E. A., Donaldson, A., Cook, B., Forrester, J., Spray, C., Cinderby, S., Passmore, D., and Bissett, N.: Flood risk management, an approach to managing cross-border haz-ards, Nat. Hazhaz-ards, 82, 217–240, https://doi.org/10.1007/s11069-016-2284-2, 2016.
Brown, J. D. and Damery, S. L.: Managing flood risk in the UK: towards an integration of social and technical perspectives, T. I. Brit. Geogr., 27, 412–426, 2002.
Burby, R. J.: Flood insurance and floodplain management: the US experience, Global Environ. Chang., 3, 111–122, https://doi.org/10.1016/S1464-2867(02)00003-7, 2001. Butler, C. and Pidgeon, N.: From “flood defence” to “flood risk
management”: exploring governance, responsibility, and blame, Environ. Plann. C, 29, 533–547, https://doi.org/10.1068/c09181j, 2011.
Clarvis, M. H. and Engle, N. L.: Adaptive capacity of water gov-ernance arrangements: a comparative study of barriers and op-portunities in Swiss and US states, Reg. Environ. Change, 15, 517–527, https://doi.org/10.1007/s10113-013-0547-y, 2015. Collenteur, R. A., de Moel, H., Jongman, B., and Di Baldassarre, G.:
The failed-levee effect: Do societies learn from flood disasters?, Nat. Hazards, 76, 373–388, https://doi.org/10.1007/s11069-014-1496-6, 2015.
de Brito, M. M. and Evers, M.: Multi-criteria decision-making for flood risk management: a survey of the current state of the art, Nat. Hazards Earth Syst. Sci., 16, 1019–1033, https://doi.org/10.5194/nhess-16-1019-2016, 2016.
DeGaetano, A. T.: Time-dependent changes in extreme-precipitation return-period amounts in the continental United States, J. Appl. Meteorol. Clim., 48, 2086–2099, https://doi.org/10.1175/2009JAMC2179.1, 2009.
Di Baldassarre, G., Viglione, A., Carr, G., Kuil, L., Salinas, J. L., and Blöschl, G.: Socio-hydrology: conceptualising human-flood interactions, Hydrol. Earth Syst. Sci., 17, 3295–3303, https://doi.org/10.5194/hess-17-3295-2013, 2013.
Di Baldassarre, G., Viglione, A., Carr, G., Kuil, L., Yan, K., Brandimarte, L., and Blöschl, G.: Debates–Perspectives on socio-hydrology: Capturing feedbacks between physical and social processes, Water Resour. Res., 51, 4770–4781, https://doi.org/10.1002/2014WR016416, 2015.
Di Baldassarre, G., Brandimarte, L., and Beven, K.: The seventh facet of uncertainty: wrong assumptions, unknowns and surprises in the dynamics of human–water systems, Hydrolog. Sci. J., 61, 1748–1758, https://doi.org/10.1080/02626667.2015.1091460, 2016.
Downton, M. W., Morss, R. E., Wilhelmi, O. V., Grunt-fest, E., and Higgins, M. L.: Interactions between scien-tific uncertainty and flood management decisions: Two case studies in Colorado, Global Environ. Chang., 6, 134–146, https://doi.org/10.1016/j.hazards.2006.05.003, 2005.
Easton, Z. M., Gérard-Marchant, P., Walter, M. T., Petrovic, A. M., and Steenhuis, T. S.: Hydrologic assessment of an urban variable source watershed in the northeast United States, Water Resour. Res., 43, W03413, https://doi.org/10.1029/2006WR005076, 2007.
Edelenbos, J., Van Buuren, A., Roth, D., and Winnubst, M.: Stake-holder initiatives in flood risk management: exploring the role and impact of bottom-up initiatives in three “Room for the River” projects in the Netherlands, J. Environ. Plann. Man., 60, 47–66, https://doi.org/10.1080/09640568.2016.1140025, 2017. Elliott, R. and Rush, E: Stormy Waters: The Fight Over New York
City’s Flood Lines, Harper’s Monthly, 2017.
Evers, M., Almoradie, A., and de Brito, M. M.: Enhancing Flood Resilience Through Collaborative Modelling and Multi-criteria
Decision Analysis (MCDA), Urban Disaster Resilience and Se-curity, 221–236, https://doi.org/10.1007/978-3-319-68606-6_14, 2018.
Federal Emergency Management Agency (FEMA): Flood Risk and Insurance: Know the Facts, avail-able at: https://www.fema.gov/media-library-data/ 1435760601581-d4712885b8b40afcaab671d02333ff2a/FS_ FloodRisk_nInsuranceKnowtheFacts_May2015.pdf (last access: 23 October 2018), 2015.
Federal Emergency Management Agency (FEMA): National Flood Hazard Layer, available at: https://www.fema.gov/ national-flood-hazard-layer-nfhl (last access: 23 October 2018), 2018.
Few, R.: Flooding, vulnerability and coping strategies: local responses to a global threat, Prog. Dev. Stud., 3, 43–58, https://doi.org/10.1191/1464993403ps049ra, 2003.
Fry, J., Xian, G., Jin, S., Dewitz, J., Homer, C., Yang, L., Barnes, C., Herold, N., and Wickham, J.: Completion of the 2006 na-tional land cover database for the conterminous United States, Photogramm. Eng. Rem. S., 77, 858–864, 2011.
Gober, P. and Wheater, H. S.: Debates – Perspectives on socio-hydrology: Modeling flood risk as a public policy problem, Water Resour. Res., 51, 4782–4788, https://doi.org/10.1002/2015WR016945, 2015.
Haer, T., Botzen, W. W., and Aerts, J. C.: The effective-ness of flood risk communication strategies and the in-fluence of social networks – Insights from an agent-based model, Environmental Science and Policy, 60, 44–52, https://doi.org/10.1016/j.envsci.2016.03.006, 2016.
Hamilton, L. C., Wake, C. P., Hartter, J., Safford, T. G., and Puchlopek, A. J.: Flood realities, perceptions and the depth of divisions on climate, Sociology, 50, 913–933, https://doi.org/10.1177/0038038516648547, 2016.
Harries, T.: Feeling secure or being secure? Why it can seem bet-ter not to protect yourself against a natural hazard, Health Risk Soc., 10, 479–490, https://doi.org/10.1080/13698570802381162, 2008.
Harries, T. and Penning-Rowsell, E.: Victim pressure, in-stitutional inertia and climate change adaptation: The case of flood risk, Global Environ. Chang., 21, 188–197, https://doi.org/10.1016/j.gloenvcha.2010.09.002, 2011. Hermanowicz, J. C.: The great interview: 25 strategies for studying
people in bed, Qual. Sociol., 25, 479–499, 2002.
Hirabayashi, Y, Mahendran, R., Koirala, S., Konoshima, L., Ya-mazaki, D., Watanabe, S., Kim, H., and Kanae, S.: Global flood risk under climate change, Nat. Clim. Change, 3, 816–821, https://doi.org/10.1038/nclimate1911, 2013.
Huntjens, P., Pahl-Wostl, C., Rihoux, B., Schlüter, M., Flachner, Z., Neto, S., Koskova, R., Dickens, C., and Nabide Kiti, I.: Adaptive water management and policy learning in a changing climate: a formal comparative analysis of eight water management regimes in Europe, Africa and Asia, Environ. Policy Gov., 21, 145–163, 2011.
Ithaca Times: UPDATE: Flooding reported in Ithaca, available at: http://www.ithaca.com/ news/update-flooding-reported-in-ithaca/article_
Ivancic, T. J. and Shaw, S. B.: Examining why trends in very heavy precipitation should not be mistaken for trends in very high river discharge, Climatic Change, 133, 681–693, https://doi.org/10.1007/s10584-015-1476-1, 2015.
Johnson, H.: The New York State Flood of July 1935. Water-Supply Paper 773-E, United States Government Printing Office, Wash-ington, D.C., 1936.
Kasprzyk, J. R., Nataraj, S., Reed, P. M., and Lempert, R. J.: Many objective robust decision making for complex environmental sys-tems undergoing change, Environ. Modell. Softw., 42, 55–71, https://doi.org/10.1016/j.envsoft.2012.12.007, 2013.
Knighton, J.: Tompkins County Flood Expert Survey, HydroShare, https://doi.org/10.4211/hs.93dbbcda406349e691030e92c882fb3a, 2018.
Knighton, J., White, E., Lennon, E., and Rajan, R.: Development of probability distributions for urban hydrologic model parameters and a Monte Carlo analysis of model sensitivity, Hydrol. Pro-cess., 28, 5131–5139, https://doi.org/10.1002/hyp.10009, 2014. Knighton, J., Steinschneider, S., and Walter, M. T.: A
Vulnerability-Based, Bottom-up Assessment of Future Riverine Flood Risk Us-ing a Modified Peaks-Over-Threshold Approach and a Physically Based Hydrologic Model, Water Resour. Res., 53, 10043–10064, https://doi.org/10.1002/2017WR021036, 2017.
Knighton, J. O. and Walter, M. T.: Critical rainfall statis-tics for predicting watershed flood responses: rethinking the design storm concept, Hydrol. Process., 30, 3788–3803, https://doi.org/10.1002/hyp.10888, 2016.
Knighton, J. O., DeGaetano, A., and Walter, M. T.: Hydrologic State Influence on Riverine Flood Discharge for a Small Temperate Watershed (Fall Creek, United States): Negative Feedbacks on the Effects of Climate Change, J. Hydrometeorol., 18, 431–449, https://doi.org/10.1175/JHM-D-16-0164.1, 2017.
Lane, S. N., Landström, C., and Whatmore, S. J.: Imagining flood futures: risk assessment and management in practice, Philos. T. R. Soc. A, 369, 1784–1806, 2011.
Leong, C. and Howlett, M.: On credit and blame: disentangling the motivations of public policy decision-making behaviour, Pol-icy Sci., 50, 599–618, https://doi.org/10.1007/s11077-017-9290-4, 2017.
Lo, A. Y.: The role of social norms in climate adapta-tion: Mediating risk perception and flood insurance purchase, Global Environ. Chang., 23, 1249–1257, https://doi.org/10.1016/j.gloenvcha.2013.07.019, 2013.
Lo, A. Y.: Negative income effect on perception of long-term environmental risk, Ecol. Econ., 107, 51–58, https://doi.org/10.1016/j.ecolecon.2014.08.009, 2014.
Lorenzoni, I. and Pidgeon, N. F.: Public views on climate change: European and USA perspectives, Climatic Change, 77, 73–95, https://doi.org/10.1007/s10584-006-9072-z, 2006.
Lupton, D.: Risk and emotion: towards an alternative the-oretical perspective, Health Risk Soc., 15, 634–647, https://doi.org/10.1080/13698575.2013.848847, 2013.
Lyles, W., Berke, P., and Smith, G.: A compari-son of local hazard mitigation plan quality in six states, USA, Landscape Urban Plan., 122, 89–99, https://doi.org/10.1016/j.landurbplan.2013.11.010, 2014. Marjerison, R. D., Walter, M. T., Sullivan, P. J., and Colucci,
S. J.: Does Population Affect the Location of Flash Flood
Reports?, J. Appl. Meteorol. Climatol., 55, 1953–1963, https://doi.org/10.1175/JAMC-D-15-0329.1, 2016.
Masuda, J. R. and Garvin, T.: Place, culture, and the so-cial amplification of risk, Risk Anal., 26, 437–454, https://doi.org/10.1111/j.1539-6924.2006.00749.x, 2006. Mathias, S. A., McIntyre, N., and Oughton, R. H.: A
study of non-linearity in rainfall-runoff response us-ing 120 UK catchments, J. Hydrol., 540, 423–436, https://doi.org/10.1016/j.jhydrol.2016.06.039, 2016.
Measham, T. G., Preston, B. L., Smith, T. F., Brooke, C., Gorddard, R., Withycombe, G., and Morrison, C.: Adapting to climate change through local municipal planning: barri-ers and challenges, Mitig. Adaptat. Strat. Gl., 16, 889–909, https://doi.org/10.1007/s11027-011-9301-2, 2011.
Merz, B., Aerts, J., Arnbjerg-Nielsen, K., Baldi, M., Becker, A., Bichet, A., Blöschl, G., Bouwer, L. M., Brauer, A., Cioffi, F., Delgado, J. M., Gocht, M., Guzzetti, F., Harrigan, S., Hirschboeck, K., Kilsby, C., Kron, W., Kwon, H.-H., Lall, U., Merz, R., Nissen, K., Salvatti, P., Swierczynski, T., Ulbrich, U., Viglione, A., Ward, P. J., Weiler, M., Wilhelm, B., and Nied, M.: Floods and climate: emerging perspectives for flood risk assess-ment and manageassess-ment, Nat. Hazards Earth Syst. Sci., 14, 1921– 1942, https://doi.org/10.5194/nhess-14-1921-2014, 2014. Merz, B., Vorogushyn, S., Lall, U., Viglione, A., and Blöschl, G.:
Charting unknown waters – On the role of surprise in flood risk assessment and management, Water Resour. Res., 51, 6399– 6416, https://doi.org/10.1002/2015WR017464, 2015.
Molotch, H.: Growth machine links: Up, down, and across, The urban growth machine: Critical perspectives two decades later, SUNY series in Urban Planning, 247–265, 1999.
Morss, R. E., Wilhelmi, O. V., Downton, M. W., and Gruntfest, E.: Flood risk, uncertainty, and scientific information for decision making: lessons from an interdisciplinary project, B. Am. Me-teorol. Soc., 86, 1593–1601, https://doi.org/10.1175/BAMS-86-11-1593, 2005.
Næss, L. O., Bang, G., Eriksen, S., and Vevatne, J.: Institutional adaptation to climate change: flood responses at the municipal level in Norway, Global Environ. Change, 15, 125–138, 2005. National Climatic Data Center (NCDC): Land-Based
Sta-tion Data, available at: http://www.ncdc.noaa.gov/data-access/ land-basedstation-data, last access: 23 October 2018.
Ning, L., Riddle, E. E., and Bradley, R. S.: Projected changes in climate extremes over the northeastern United States, J. Climate, 28, 3289–3310, https://doi.org/10.1175/JCLI-D-14-00150.1, 2015.
Norgaard, K. M.: Living in denial: Climate change, emotions, and everyday life, MIT Press, 2011.
Obama, B.: Establishing a federal flood risk management standard and a process for further soliciting and con-sidering stakeholder input (United States Executive Or-der 13690), Washington, DC, The White House, avail-able at: https://obamawhitehouse.archives.gov/the-press- office/2015/01/30/executive-order-establishing-federal-flood-risk-management-standard-and- (last access: 23 October 2018), 2015.