www.hydrol-earth-syst-sci.net/14/1745/2010/ doi:10.5194/hess-14-1745-2010
© Author(s) 2010. CC Attribution 3.0 License.
Earth System
Sciences
Modelling the impact of prescribed global warming on runoff
from headwater catchments of the Irrawaddy River and their
implications for the water level regime of Loktak Lake,
northeast India
C. R. Singh1, J. R. Thompson1, J. R. French1, D. G. Kingston1,*, and A. W. Mackay1
1UCL Department of Geography, University College London, Gower Street, London, WC1E 6BT, UK *now at: Department of Geography, University of Otago, P.O. Box 56, Dunedin, New Zealand Received: 19 April 2010 – Published in Hydrol. Earth Syst. Sci. Discuss.: 7 May 2010 Revised: 11 August 2010 – Accepted: 19 August 2010 – Published: 13 September 2010
Abstract. Climate change is likely to have major
impli-cations for wetland ecosystems, which will include altered water level regimes due to modifications in local and catch-ment hydrology. However, substantial uncertainty exists in the precise impacts of climate change on wetlands due in part to uncertainty in GCM projections. This paper explores the impacts of climate change upon river discharge within three sub-catchments of Loktak Lake, an internationally im-portant wetland in northeast India. This is achieved by run-ning pattern-scaled GCM output through distributed hydro-logical models (developed using MIKE SHE) of each sub-catchment. The impacts of climate change upon water lev-els within Loktak Lake are subsequently investigated using a water balance model. Two groups of climate change sce-narios are investigated. Group 1 uses results from seven dif-ferent GCMs for an increase in global mean temperature of 2◦C, the purported threshold of “dangerous” climate change,
whilst Group 2 is based on results from the HadCM3 GCM for increases in global mean temperature between 1◦C and 6◦C. Results from the Group 1 scenarios show varying re-sponses between the three sub-catchments. The majority of scenario-sub-catchment combinations (13 out of 21) in-dicate increases in discharge which vary from<1% to 42% although, in some cases, discharge decreases by as much as 20%. Six of the GCMs suggest overall increases in river flow to Loktak Lake (2–27%) whilst the other results in a modest (6%) decline. In contrast, the Group 2 scenarios lead to an almost linear increase in total river flow to Loktak Lake with
Correspondence to: J. R. Thompson
increasing temperature (up to 27% for 6◦C), although two
sub-catchments experience reductions in mean discharge for the smallest temperature increases. In all but one Group 1 scenario, and all the Group 2 scenarios, Loktak Lake water levels are higher, regularly reaching the top of a downstream hydropower barrage that impounds the lake and necessitating the release of water for barrage structural stability. Although elevated water levels may permit enhanced abstraction for ir-rigation and domestic uses, future increases in hydropower generation are limited by existing infrastructure. The higher water levels are likely to exacerbate existing ecological de-terioration within the lake as well as enhancing problems of flooding of lakeside communities.
1 Introduction
Table 1. Sub-catchments of Loktak Lake.
Sub- Area Forested area Elevation range catchment (km2) (km2) (m a.m.s.l.) 1. Thoubal 963 684 800–2430 2. Iril 1271 902 800–2300 3a. Nambul 178 114 800–2204 3b. Westernb 851 545 800–2000 4. Imphal 354 251 800–2583 5. Khuga 504 358 800–1960 6. Sekmaia 301 99 800–1600 7. Heiroka 405 134 800–1467 8. Kongba 120 61 800–1500
aFlows from these two catchments are now diverted away from Loktak Lake;bThe
Western sub-catchment is comprised of over 20 small streams and rivulets including the Nambul.
likely to occur. Two of India’s 25 Ramsar sites, includ-ing Loktak Lake which is the focus of this paper, are on this record of threatened wetlands. This situation reflects a wider trend for wetlands across the world. For example, the United States Environmental Protection Agency reported that the extent of wetlands in the lower 48 states of the United States was shrinking at a rate of over 24 000 hectares annu-ally, mainly due to developmental pressures and agricultural reclamation (USEPA, 2001). Similarly, over the middle-late 20th Century, European countries including France, Ger-many, Italy and Greece lost between 57% and 66% of their wetlands (CEC, 1995), whilst Davis and Froend (1999) suggested that 70% of wetlands in the coastal plains of south-western Australia have been lost since British settle-ment (1829). Much of these losses are the result of infilling or drainage to create land for agricultural use or urban devel-opment.
The pressures on wetlands from human activities are likely to grow in the future as demand for water and other resources increases (e.g. Hollis, 1998; Ramsar Bureau, 2002a). Result-ing ecological changes within wetlands may be exacerbated by the impacts of climate change with implications for wet-land conservation, restoration and the wise use of wetwet-land re-sources (Poff et al., 2002; Erwin, 2009). Projected intensifi-cation of the hydrological cycle associated with rising global temperatures (IPCC, 2007) will have large implications for wetlands which by their very nature are sensitive to changes in local and catchment-wide hydrometeorological conditions (Baker et al., 2009). The most pronounced impacts of cli-mate change upon wetlands will be modifications to hydro-logical regimes. These will include alterations to the tem-poral and spatial patterns of water levels and changes in the roles of hydrological extremes of droughts and floods. Other
impacts may include changes to wetland biogeochemistry, sediment loading, fire incidence and wave energy (e.g. Ram-sar Bureau, 2002b). The nature and magnitude of climate change impacts will vary between wetland types and loca-tions. For many freshwater wetlands the most important pro-jected impacts of climate change are associated with changes in the amount, state and seasonal distribution of precipita-tion, higher evaporation due to warmer temperatures and the combined effects of these changes upon runoff (e.g. Hartig et al., 1997; Mortsch, 1998; Conly and van der Kamp, 2001). Many freshwater wetlands are particularly vulnerable to cli-mate change induced modifications to hydrological regimes due to the delicate balance between precipitation and evap-oration (Clair, 1998; Thompson et al., 2009). For example, the surface areas of both Lake Chad, West Africa (Talling and Lamoalle, 1998) and Qinghai Lake, China (Bates et al., 2008) have declined following reduced catchment precipi-tation and in turn smaller inflows from contributory rivers. Modified hydrological regimes will have knock-on implica-tions for wetland flora and fauna, which often have very sen-sitive water level preferences (e.g. Mortsch, 1998; Wheeler et al., 2004). Changes to wetland floral and faunal diver-sity may impact the conservation significance of some sites (e.g. Keddy, 2000; Burkett and Kusler, 2000; Herron et al., 2002; Bates et al., 2008; Matthews and Quesne, 2009). Simi-larly, hydrological changes will influence biological, biogeo-chemical, and hydrological functions within wetland ecosys-tems, thereby affecting the socio-economic benefits that are valued by humans (Cox and Campbell, 1997).
Fig. 1. Loktak Lake, its sub-catchments and location of hydrometeorological stations (Irrawaddy Basin outline from GRDC grdc.bafg.de).
2 Loktak Lake
Loktak Lake (area 287 km2) is the largest freshwater wet-land in northeast India (WAPCOS, 1993; LDA and WISA 1997; WISA 2005). The lake, which is located within the state of Manipur, has a total catchment area of 4947 km2 which is divided into eight primary sub-catchments (Fig. 1, Table 1). Two of these (the Heirok and Sekmai), however, have been isolated from the lake by diversion schemes so that
Tertiary Orogeny of the Himalayas from the shallow bed of the Tethys Sea (Chakraborti et al., 2008). Rock types are pri-marily Tertiary and Cretaceous sedimentary formations, in particular limestones, with minor metamorphic and igneous intrusions (NBSS and LUP, 2001). The valley bottom is cov-ered in alluvium composed of clays and mud derived from the weathering of the underlying argillaceous rocks and de-posited by the rivers and streams as they flow from the hills into areas of lower gradient (PWD, 1967).
The valley is characterised by a tropical to semi-tropical climate whilst at higher altitudes the climate is semi-temperate to semi-temperate (WAPCOS, 1993). The south-western monsoon of the Indian sub-continent drives the cli-mate over the lake and its catchment. A rainy season starts with the onset of the monsoon in June and continues until September. Data from seven rain gauges (Fig. 1) operated by the Loktak Development Authority (LDA) between June 1999 and May 2003 shows that the wettest month is Au-gust (average 255 mm) followed by July (229 mm). June and September receive on average 225 mm and 181 mm re-spectively. These four monsoon months account for 63% of the annual average catchment precipitation of 1409 mm. The south-eastern part of the catchment (Pallel rain gauge) re-ceives the lowest annual average precipitation of 1194 mm while the north-west (Sindga) receives the highest annual av-erage precipitation of 1647 mm. The dry winter extends from October to February with the driest months being December and January (4 mm and 10 mm mean precipitation respec-tively). The pre-monsoon summer (March to May) is char-acterised by scattered showers. As the monsoon approaches, the intensity and frequency of precipitation increases (mean monthly precipitation for March, April and May are 45 mm, 99 mm and 147 mm, respectively). The mean annual tem-perature for June 1999–May 2003 derived from four meteo-rological stations within the catchment (Fig. 1) was 20.5◦C. Mean summer temperatures for the same period were 24.0◦C with the highest temperate of 35.5◦C recorded in June 1999 at Keibul Lamjao National Park (KLNP). In winter mean catchment temperature was 14.0◦C. The lowest temperature (−1.5◦C) was recorded at Pallel in January 2000. The four meteorological stations providing temperature data are lo-cated at elevations between 800 and 850 m a.m.s.l. However, temperatures at the higher parts of the catchment can be ex-pected to be lower, especially in winter. Mean annual poten-tial evapotranspiration (PET) (June 1999–May 2003) for the catchment evaluated by the LDA using the Penman-Monteith method was 1063 mm with monthly minimum and maxi-mum of 37 mm and 144 mm in December and May respec-tively. The intense monsoon precipitation combined with steep slopes result in flashy runoff responses from the catch-ment. River flows are highly seasonal with the peak flow period coinciding with the wettest month of August. Dry season flows are less than 5% of those experienced during the monsoon.
Approximately 64% (3150 km2) of the total catchment area is forested with the major types historically compris-ing tropical semi-evergreen, subtropical pine, and montane wet temperate forests (FSI, 2003). However, over 83% (2620 km2)of this forested area has been subject to varying degrees of deforestation by local communities. Dense, rela-tively pristine, forests are now limited to the highest altitudes. Agricultural activities as well as human settlements are con-centrated in the valley, although there is some agriculture in hilly areas through shifting cultivation (known locally as
jhum). Paddy cultivation in the valley provides 65% of total
rice production of Manipur and as a result the valley is known as the “Rice Bowl of Manipur”. Pulses, tobacco, potato, chillies and other vegetables are important crops grown for local consumption while sugarcane and citrus fruits are the main cash crops.
Loktak Lake is oval in shape and varies in depth between 0.5 and 4.5 m (WAPCOS, 1993; LDA and WISA, 1998; Trisal and Manihar, 2004). Seasonal variations in lake wa-ter levels reflect the seasonality in precipitation and in turn river flows. The most striking characteristic of the lake is the occurrence of floating heterogeneous masses of soil, veg-etation and organic matter at various stages of decomposi-tion, known locally as phumdis (e.g. WAPCOS, 1988; Singh, 1992; LDA, 1996; Singh and Shyamananda, 1994; LDA and WISA, 2003). The KLNP is located in the south of the lake and is the only floating wildlife sanctuary in the world (Trisal and Manihar, 2004). It is the sole natural habitat of the world’s most endangered ungulate species, the brow-antlered deer (Cervus eldi eldi) or Sangai (Khan et al., 1992; Prasad and Chhabra, 2001; Dey, 2002; Angom, 2005). The lake supports a human population of 279 935 (Trisal and Manihar, 2004) living on it and around its margins through the provi-sion of water, fish and aquatic vegetation (LDA and WISA, 2003; Trisal and Manihar, 2004). Lake vegetation is har-vested for use as food, fodder, fibre, fuel, material for handi-crafts and for medicinal purposes. Historically the lake pro-vided breeding and nursery habitat for migratory fish which form a major component of the diet of local people. Periodic inundation of the lake margin and floodplains within the cen-tral valley and the resulting deposition of nutrient-rich sedi-ment has benefited the productive agricultural sector.
for hydropower generation. The barrage, which was com-missioned in 1983, has raised mean water levels and reduced the magnitude of seasonal fluctuations. In addition, the lake is under stress from other anthropogenic pressures. Defor-estation within the catchment, agricultural pollution leading to nutrient enrichment and the prolific growth of phumdis as well as encroachment around the lake margin have all in-creased in recent years (Hay, 1998; LDA and WISA, 1998; James, 2000; ERM, 2000). Water resource schemes have also been proposed within both the Khuga and Iril sub-catchments. Climate change represents an additional source of potential hydrological changes which, to date, have not been investigated.
3 Hydrological modelling of the Loktak Lake catchment
Hydrological models of sub-catchments draining to Lok-tak Lake were developed using MIKE SHE, a determinis-tic, fully distributed and physically based modelling system (DHI, 2005; Graham and Butts, 2005) developed from the Syst`eme Hydrologique Europ´een (SHE) (Abbott et al., 1986 a, b). It has been widely used to study a variety of water resource and environmental problems under diverse clima-tologically and hydrological regimes (Refsgaard and Storm, 1995). MIKE SHE is a comprehensive system for modelling all the major processes that occur in the land phase of the hy-drological cycle. It describes a given catchment with a level of detail sufficiently fine to be able to claim a physically-based process description. The distributed nature of MIKE SHE allows the spatial distribution of catchment parameters, climate variables and hydrological response through an or-thogonal grid network and columns of horizontal layers at each grid square in the horizontal and vertical, respectively. Channel flow is simulated using the one-dimensional hy-draulic modelling system, MIKE 11. Dynamic coupling of MIKE SHE and MIKE 11 includes river-aquifer exchange, overland flow from MIKE SHE grid squares to MIKE 11 river branches and the inundation of MIKE SHE grid squares from MIKE 11 (Thompson et al., 2004).
Gauged daily discharge data at the outlet of two of the largest sub-catchments, the Iril (1271 km2) and Thoubal (963 km2)were available for the relatively short period June 1999–May 2003. These data were collected under a project jointly implemented by Wetlands International – South Asia (WISA) and the LDA with financial support from the Min-istry of Environment and Forest (MoEF), Government of In-dia and InIn-dia Canada Environment Facility (ICEF). Data col-lection ceased at the end of this project, restricting the length of the records. Daily discharge data for the same period are also available for the Nambul (178 km2), the largest stream within the Western sub-catchment. This sub-catchment is comprised of over 20 streams and rivulets, which have simi-lar catchment characteristics but, with the exception of the Nambul, are ungauged. Discharge data for the remaining
sub-catchments are not available. Given this paucity of data, the approach to model calibration and validation was to ini-tially calibrate a model of one of the major sub-catchments for which discharge data were available, in this case the Thoubal, and then to apply the same calibrated parameter values to models developed for the other two gauged sub-catchments, the Iril and Nambul. This form of validation exercise was considered appropriate given the similar geol-ogy, soils and vegetation cover within the three catchments. It makes the best use of the available data since the short duration of the discharge records prevents the application of a more traditional split-sample approach (e.g. Klemes, 1986; Xu, 1999). Discharges for the ungauged sub-catchments (ex-cluding the Heirok and Sekmai due to their diversion away from Loktak Lake) were subsequently estimated by weight-ing the simulated discharges by catchment area. An alterna-tive approach would have been to develop MIKE SHE mod-els for these sub-catchments (e.g. Pradhan et al., 2008) but some data required in the models were not available for these areas.
Catchment land use was spatially distributed using a 1:50 000 scale digital land cover map produced by the De-partment of Forest and Environment, Government of Ma-nipur using Indian Remote Sensing Satellite (IRS) 1C 2001 imagery. Seven land cover classes are represented: forest, degraded forest, jhum, agriculture, settlements, water bod-ies and phumdis. The vegetation propertbod-ies of each land use class required by MIKE SHE (leaf area index, LAI and root depth, RD) were taken from Jain et al. (1992) and WISA (2005). In the absence of detailed hydrogeological information and given the focus of representing catchment outflows rather than detailed groundwater level fluctuations, a single uniform saturated zone layer up to 100 m thick was specified and its saturated hydraulic conductivity varied dur-ing model calibration of the Thoubal sub-catchment. A uni-form two-layer unsaturated zone was specified. An initial infiltration rate of 1.4×10⁻⁶m s−1was specified based on catchment soil type and values from the literature (PWD, 1967; Brouwer et al., 1988). It was subsequently varied dur-ing model calibration.
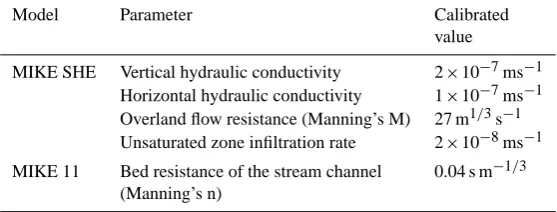
Table 2. Calibrated MIKE SHE parameters values.
Model Parameter Calibrated value
MIKE SHE Vertical hydraulic conductivity 2×10⁻⁷ms−1 Horizontal hydraulic conductivity 1×10⁻⁷ms−1 Overland flow resistance (Manning’s M) 27 m1/3s−1 Unsaturated zone infiltration rate 2×10⁻⁸ms−1 MIKE 11 Bed resistance of the stream channel 0.04 s m−1/3
(Manning’s n)
of the developing world where other sources of high reso-lution topographic data are relatively scarce (e.g. Jarvis et al., 2004; Gorokhovich and Voustianiouk, 2006). Hypsomet-ric curves for the three catchments derived using the origi-nal SRTM data and the same data resampled to the MIKE SHE model grid size were very similar suggested that the re-sampled dataset retains a good representation of catchment topographic characteristics.
MIKE 11 branches were abstracted from 1:50 000 scale 1980 Survey of India topographic maps and an IRS-1D 2002 image. River cross sections were defined based on field sur-veys undertaken by the LDA. All MIKE 11 branches were defined as coupled to MIKE SHE. River-aquifer exchange was evaluated using the Reduced Contact (a) formulation (DHI, 2005) in which conductance is a function of the hy-draulic conductivity of both the aquifer and riverbed materi-als. A uniform value for the latter (the leakage coefficient) of 3×10−71 s−1was applied throughout the river network. Similarly, a uniform Manning’s n resistance was employed for the river channels and this was varied during model cali-bration for the Thoubal sub-catchment.
Daily precipitation was provided by the seven rain gauges operated by the LDA with their spatial coverage specified us-ing Thiessen polygons. Similarly, Thiessen polygons were used to specify the spatial coverage of daily PET calcu-lated using the Penmen-Monteith method and employing data from four LDA meteorological stations.
Refsgaard and Storm (1995) suggested that the number of parameters subject to adjustment during calibration of a dis-tributed hydrological model such as MIKE SHE should be as small as possible. Al-Khudhairy et al. (1999) and Thompson et al. (2004) for example limited calibration parameters for MIKE SHE/MIKE 11 models of UK wetlands to hydraulic conductivity in the saturated zone, the Manning’s roughness coefficient for overland as well as channel flow, the channel leakage coefficient and the drainage time constant used in the representation of sub-grid scale surface drainage. In the current study the calibration parameters were horizontal and vertical hydraulic conductivity of the saturated zone, unsat-urated zone infiltration rate, overland flow resistance (Man-ning’s M), and flow resistance within the stream channels
(Manning’s n). Initial values of these calibration parameters were taken from the literature. Calibration of the Thoubal model was based on a graphical comparison of observed and simulated discharge at the sub-catchment outlet (the Thoubal Bridge gauging station) with calibration terms being modi-fied iteratively. Widely used statistical measures of model performance were evaluated for each model run and were used to refine the final calibration; the Nash–Sutcliffe coef-ficient (R2, Nash and Sutcliffe, 1970; Garrick et al., 1978: Xiong and Gou, 1999; Andersen et al., 2001; Yang et al., 2001) and the correlation coefficient(r)(Weglarczyk, 1998; Yang et al., 2001, 2002). The percentage difference in the observed and simulated mean daily flow was also calculated. The final values of the calibration parameters are shown in Table 2.
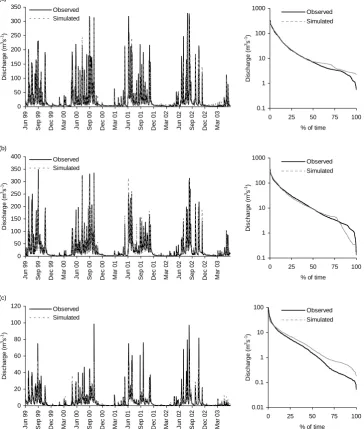
Figure 2a shows the observed and simulated discharge for the Thoubal sub-catchment for the period June 1999–May 2003. It demonstrates that the model is generally success-ful in reproducing the observed daily flows despite the very flashy nature of the sub-catchment’s response to precipita-tion. Good sequencing of peak flows is achieved although there is a tendency for the model to slightly underestimate the magnitude of the largest peaks during the monsoon period. During the last two dry seasons simulated baseflow exceeds the observed, although a good representation of flows dur-ing this time of year is achieved in the first two years of the simulation period. Overall, the frequency distribution of sim-ulated river discharge in the Thoubal sub-catchment closely approximates that of the observed discharge record as indi-cated by the similar flow duration curves, although the slight overestimation of baseflows is evident (Fig. 2a). Figure 3a demonstrates that the model provides a good representation of mean monthly discharge albeit with the slight underesti-mation of peak flows and marginally higher baseflows. Ta-ble 3, which presents the values of the statistical measures of model performance, confirms the ability of the model. Using the classification scheme of Henriksen et al. (2008) the per-formance of the model is classed as “excellent”.
2 0 50 100 150 200 250 300 350 J
un 99 Sep 99
De c 9 9 Ma r 0 0 J
un 00 Sep 00
De c 0 0 Ma r 0 1 J
un 01 Sep 01
De c 0 1 Ma r 0 2 J
un 02 Sep 02
De c 0 2 Ma r 0 3 D is c har g e ( m 3s -1) Observed Simulated (a) 0.1 1 10 100 1000
0 25 50 75 100 % of time
D is c har g e ( m 3s -1) Observed Simulated 0 50 100 150 200 250 300 350 400 J
un 99 Sep 99
De c 9 9 Ma r 0 0 J
un 00 Sep 00
De c 0 0 Ma r 0 1 J
un 01 Sep 01
De c 0 1 Ma r 0 2 J
un 02 Sep 02
De c 0 2 Ma r 0 3 D is c har ge ( m 3s -1) Observed Simulated (b) 0.1 1 10 100 1000
0 25 50 75 100 % of time
D is c har ge ( m 3s -1) Observed Simulated 0 20 40 60 80 100 120 J un 99 S ep 99 De c 9 9 Ma r 0 0 J un 00 S ep 00 De c 0 0 Ma r 0 1 J un 01 S ep 01 De c 0 1 Ma r 0 2 J un 02 S ep 02 De c 0 2 Ma r 0 3 D is c har g e ( m 3s -1) Observed Simulated (c) 0.01 0.1 1 10 100
0 25 50 75 100
% of time
[image:7.595.116.481.68.498.2]D is c har g e ( m 3s -1) Observed Simulated
Fig. 2. Comparison (daily flows and flow duration curves) of observed and simulated discharge for the three modelled sub-catchments (June
1999–May 2003) (a) Thoubal, (b) Iril, (c) Nambul.
distribution at the sub-catchment outlets (Moirang Kampu and Hiyang Thang gauging stations, respectively) closely matched the observed records (Fig. 2b, c). Model perfor-mance was particularly good for high flows, although lower flows were underestimated (overestimated) in the Iril (Nam-bul) sub-catchments. A very close fit to observed mean monthly discharge was obtained for the Iril sub-catchment (Fig. 3b). In the Nambul sub-catchment the model’s mean monthly discharge closely approximated the observed, al-though flows were overestimated between March and May (Fig. 3b). The statistical measures of model performance (Table 3) are classified as either “excellent” or “very good”, suggesting a robust validation.
As previously noted, discharge records for the remaining ungauged sub-catchments that still contribute to Loktak Lake were derived by weighting simulated discharge for the clos-est sub-catchment for which a MIKE SHE model was devel-oped by catchment area (Table 4).
4 Simulation of climate change on the Loktak Lake catchment
3
0 10 20 30 40 50 60 70
J F M A M J J A S O N D
D
is
c
har
ge (
m
3s -1)
Observed Simulated (a)
0 10 20 30 40 50 60 70 80
J F M A M J J A S O N D
D
is
c
har
ge (
m
3s -1)
Observed Simulated (b)
0 2 4 6 8 10 12 14
J F M A M J J A S O N D
D
is
c
har
ge (
m
3s -1)
[image:8.595.122.479.71.199.2]Observed Simulated (c)
[image:8.595.100.494.274.396.2]Fig. 3. Observed and simulated mean monthly discharge for the three modelled sub-catchments (June 1999–May 2003) (a) Thoubal, (b) Iril, (c) Nambul.
Table 3. Statistical measures of model performance.
Model MDFoa(m3s−1) MDFsb(m3s−1) Dvc(%) R2 r
Thoubal River 25.2 25.7 2.0∗ ∗ ∗ ∗ ∗ 0.85∗ ∗ ∗ ∗ ∗ 0.94 Iril River 28.1 27.9 0.7∗ ∗ ∗ ∗ ∗ 0.84∗ ∗ ∗∗ 0.93 Nambul River 5.2 5.5 5.4∗ ∗ ∗∗ 0.82∗ ∗ ∗∗ 0.91 Performance indicatord Excellent∗ ∗ ∗ ∗ ∗ Very good∗ ∗ ∗∗ Fair∗ ∗ ∗ Poor∗∗ Very poor∗
Dv <5% 5–10 % 10–20 % 20–40% >40%
R2 >0.85 0.65–0.85 0.50–0.65 0.20–0.50 <0.20
aObserved mean daily flow;bSimulated mean daily flow;cDeviation in simulated mean daily flow from observed mean daily flow;dBased on Henriksen et al. (2008).
Table 4. Simulated mean daily flows of ungauged sub-catchments.
Sub- Nearest Area Mean catchment gauging factor daily
station discharge (m3s−1) Imphal Iril 0.28 7.8 Khuga Nambul 2.83 15.4 Kongba Iril 0.09 2.5 Westerna Nambul 4.78 26.1
aExcludes the Nambul sub-catchment.
climate change impacts on river and wetland hydrological regimes (e.g. Chiew et al., 1995; Fowler and Kilsby, 2007; Thompson et al., 2009) and is adopted by the other papers in this special issue. It involves the following stages (Arnell and Reynard, 1996): (i) define, calibrate and validate a model of the hydrological system using current climate data; (ii) define climate change scenarios and perturb the original input cli-mate data accordingly; and (iii) run the hydrological model
with these perturbed climate data and compare results with those simulated under current (“baseline”) conditions. Land cover, and hence the model parameters used to represent it such as LAI and RD, are assumed to remain unchanged as a result of climate change. The calibrated models of the Loktak Lake sub-catchments described above provided the first stage in this process and the baseline conditions against which the results of climate change simulations described below were compared.
[image:8.595.83.250.464.580.2]4
0 50 100 150 200 250 300 350 400
J F M A M J J A S O N D
P
rec
ipitation
(
m
m
)
Baseline CCCMA CSIRO HadCM3 HadGEM1 IPSL MPI NCAR (a)
0 50 100 150 200
J F M A M J J A S O N D
PET (m
m
)
0 50 100 150 200 250 300 350 400
J F M A M J J A S O N D
P
rec
ipitation
(
m
m
)
Baseline CCCMA CSIRO HadCM3 HadGEM1 IPSL MPI NCAR (b)
0 50 100 150 200
J F M A M J J A S O N D
PET (m
m
)
0 50 100 150 200 250 300 350 400
J F M A M J J A S O N D
Pr
e
c
ip
itatio
n
(
mm)
Baseline CCCMA CSIRO HadCM3 HadGEM1 IPSL MPI NCAR (c)
0 50 100 150 200
J F M A M J J A S O N D
PET (m
m
[image:9.595.106.492.69.461.2])
Fig. 4. Precipitation and PET in modelled sub-catchments for the Group 1 scenarios (a) Thoubal, (b) Iril, (c) Nambul (note different y-axis
scales for precipitation and PET).
Initially, baseline (1974–2003) monthly mean, maximum and minimum temperature and precipitation totals were ob-tained for the 17 0.5◦×0.5◦ grid cells covering the
Lok-tak catchment from the CRU TS 3.0 data set (Mitchell and Jones, 2005). The temperature data were used to evalu-ate monthly Hargreaves PET for each grid cell. This PET method was employed as results from some GCMs did not provide sufficient data to calculate Penman-Monteith PET. The Hargreaves method is recommended by the FAO in such situations (Allen et al., 1998; Kingston et al., 2009). Sub-sequently, mean monthly precipitation and PET for each modelled sub-catchment were calculated for the baseline pe-riod using those grid cells covering the geographical extent of the sub-catchment. Different combinations of grid cells were therefore used for the three modelled sub-catchments. The ClimGen pattern-scaling technique described by Todd
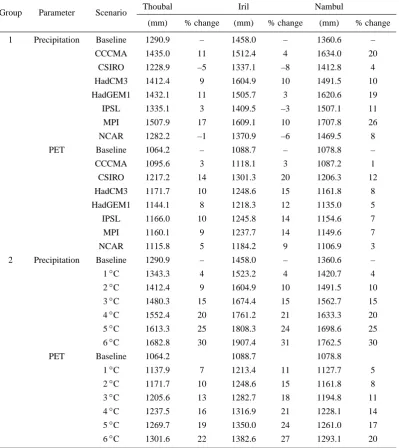
Table 5. Changes in meteorological precipitation and PET due to the climate change scenarios.
Group Parameter Scenario Thoubal Iril Nambul
(mm) % change (mm) % change (mm) % change 1 Precipitation Baseline 1290.9 – 1458.0 – 1360.6 –
CCCMA 1435.0 11 1512.4 4 1634.0 20 CSIRO 1228.9 –5 1337.1 –8 1412.8 4 HadCM3 1412.4 9 1604.9 10 1491.5 10 HadGEM1 1432.1 11 1505.7 3 1620.6 19 IPSL 1335.1 3 1409.5 –3 1507.1 11 MPI 1507.9 17 1609.1 10 1707.8 26 NCAR 1282.2 –1 1370.9 –6 1469.5 8 PET Baseline 1064.2 – 1088.7 – 1078.8 – CCCMA 1095.6 3 1118.1 3 1087.2 1 CSIRO 1217.2 14 1301.3 20 1206.3 12 HadCM3 1171.7 10 1248.6 15 1161.8 8 HadGEM1 1144.1 8 1218.3 12 1135.0 5 IPSL 1166.0 10 1245.8 14 1154.6 7 MPI 1160.1 9 1237.7 14 1149.6 7 NCAR 1115.8 5 1184.2 9 1106.9 3 2 Precipitation Baseline 1290.9 – 1458.0 – 1360.6 – 1◦C 1343.3 4 1523.2 4 1420.7 4 2◦C 1412.4 9 1604.9 10 1491.5 10 3◦C 1480.3 15 1674.4 15 1562.7 15 4◦C 1552.4 20 1761.2 21 1633.3 20 5◦C 1613.3 25 1808.3 24 1698.6 25 6◦C 1682.8 30 1907.4 31 1762.5 30 PET Baseline 1064.2 1088.7 1078.8
1◦C 1137.9 7 1213.4 11 1127.7 5 2◦C 1171.7 10 1248.6 15 1161.8 8 3◦C 1205.6 13 1282.7 18 1194.8 11 4◦C 1237.5 16 1316.9 21 1228.1 14 5◦C 1269.7 19 1350.0 24 1261.0 17 6◦C 1301.6 22 1382.6 27 1293.1 20
that employed by others (e.g. Kingston and Taylor, 2010; Thorne, 2010), where hydrological models were calibrated to monthly mean flows using CRU TS 3.0 meteorological in-puts disaggregated to a daily resolution using a weather gen-erator (see Todd et al., 2010). The alternative approach was required given the short discharge records which necessitated calibration to daily discharge. In addition, the flashy dis-charge response to precipitation exhibited by the steep catch-ments would not be reproduced using weather generator-derived daily meteorological inputs which, although having the same coefficient of variation as the station records, would not display the same day-to-day sequencing.
4.1 Results
Table 5 presents the mean annual precipitation and PET for the baseline period and each of the climate change scenarios for the three sub-catchments for which MIKE SHE models were developed. The percentage changes in both parameters between each scenario and the baseline are also indicated.
Table 6. Changes in the mean daily discharge of the three modelled sub-catchments and total annual river inflow to Loktak Lake due to the
climate change scenarios.
Group Scenario Thoubal Iril Nambul Total river inflow
(m3s−1) % change (m3s−1) % change (m3s−1) % change (106m3) % change
1 Baseline 25.7 27.9 5.5 3498.8
CCCMA 25.8 0 29.2 5 7.6 38 4175.1 19 CSIRO 20.6 –20 23.7 –15 5.9 7 3295.8 –6 HadCM3 25.4 –1 28.3 1 5.9 7 3638.9 4 HadGEM1 25.5 –1 29.5 6 7.3 33 4077.5 17
IPSL 23.0 –11 26.1 –6 6.5 18 3634.6 4 MPI 28.3 10 32.8 18 7.8 42 4458.4 27 NCAR 22.1 –14 25.4 –9 6.4 16 3558.3 2
2 Baseline 25.7 27.9 5.5 3498.8
1◦C 23.9 –7 27.2 –3 5.7 4 3501.0 0 2◦C 25.4 –1 28.3 1 5.9 7 3638.9 4 3◦C 26.7 4 30.1 8 6.1 11 3820.5 9 4◦C 28.4 11 31.7 14 6.4 16 4001.0 14 5◦C 30.2 18 33.9 22 6.6 20 4216.7 21 6◦C 31.8 24 35.4 27 7.0 27 4452.7 27
MPI, HadGEM1 and HadCM3 GCMs whereas it decreases by 1% and 5% for the NCAR and CSIRO GCMs, respec-tively. Similar variations are evident within the Iril sub-catchment although the IPSL GCM, which in the Thoubal sub-catchment was associated with the smallest (3%) in-crease in annual precipitation, produces a dein-crease of 3%. In contrast, for the Nambul sub-catchment annual precipita-tion increases for all the GCMs although this increase does vary between 4% and 26%. It is lowest for the CSIRO and NCAR GCMs. Figure 4 shows that for these two GCMs, precipitation declines in the early part of the monsoon period (in particular June). Although the peak August precipitation is very similar (NCAR) or greater (CSIRO) to the baseline, and towards the end of the rainy period (September and Oc-tober) it is generally wetter, the early monsoon declines in precipitation account for the overall reduction in mean an-nual precipitation. The most noticeable change for the GCMs associated with larger annual precipitation totals is the in-crease in early monsoon (June) precipitation. In some cases (e.g. HadCM3 for the Iril and Nambul sub-catchments) June precipitation exceeds that of August, historically the wetter month, which also increases. Precipitation in the late mon-soon period (September and October) is also higher. In con-trast to the variability in precipitation change, Table 5 shows that for all Group 1 scenarios mean annual PET increases
with the largest absolute increases occurring between April and August (Fig. 4). The range of increases in annual PET is smaller (1–20%) than the changes in precipitation. CSIRO followed by HadCM3 produced the largest increases in PET in all three sub-catchments whilst the smallest increases are associated with the CCCMA and NCAR GCMs.
5 0
50 100 150 200 250 300 350 400
J F M A M J J A S O N D
P
rec
ipitation
(
m
m
)
Baseline 1 °C 2 °C 3 °C 4 °C 5 °C 6 °C (a)
0 50 100 150 200
J F M A M J J A S O N D
PET (m
m
)
0 50 100 150 200 250 300 350 400
J F M A M J J A S O N D
P
rec
ipitation
(
m
m
)
Baseline 1 °C 2 °C 3 °C 4 °C 5 °C 6 °C (b)
0 50 100 150 200
J F M A M J J A S O N D
PET (m
m
)
0 50 100 150 200 250 300 350 400
J F M A M J J A S O N D
P
rec
ipitation
(
m
m
)
Baseline 1 °C 2 °C 3 °C 4 °C 5 °C 6 °C (c)
0 50 100 150 200
J F M A M J J A S O N D
PET (m
m
[image:12.595.103.492.64.461.2])
Fig. 5. Precipitation and PET in modelled sub-catchments for the Group 2 scenarios (a) Thoubal, (b) Iril, (c) Nambul (note different y-axis
scales for precipitation and PET).
Figure 6a–c summarises the impacts of the Group 1 sce-narios on simulated discharge for each of the three modelled sub-catchments. Within the Nambul (Fig. 6c) increases in mean discharge are indicated for all scenarios with mag-nitudes varying from 7% (CSIRO and HadCM3) to 42% (MPI) (Table 6). The relative magnitude of these changes generally follows those shown for precipitation. The ear-lier onset of monsoon precipitation for many of the GCMs results in higher discharge immediately before and during the monsoon period. Where this does not occur, most no-ticeably for the CSIRO GCM which shows a reduction in early monsoon precipitation, discharges increases towards the end of the monsoon period. Similar temporal changes in the distribution of river flows are shown for the Iril catch-ment although pre-monsoon discharges are lower than under baseline conditions (Fig. 6b). The magnitudes of increases in mean discharge are consistently smaller compared to the
6 0 20 40 60 80
J F M A M J J A S O N D
D isch ar g e ( m 3s -1) Baseline CCCMA CSIRO HadCM3 HadGEM1 IPSL MPI NCAR (a) 0 20 40 60 80 100
J F M A M J J A S O N D
D isch ar g e ( m 3s -1) Baseline CCCMA CSIRO HadCM3 HadGEM1 IPSL MPI NCAR (b) 0 5 10 15 20
J F M A M J J A S O N D
D isch ar g e ( m 3s -1) Baseline CCCMA CSIRO HadCM3 HadGEM1 IPSL MPI NCAR (c) 0 200 400 600 800 1000
J F M A M J J A S O N D
[image:13.595.311.542.68.569.2]Tot a l di s c h arge (10 6m 3) Baseline CCCMA CSIRO HadCM3 HadGEM1 IPSL MPI NCAR (d)
Fig. 6. Mean monthly discharge for the Group 1 scenarios (a)
Thoubal, (b) Iril, (c) Nambul, (d) total river inflow to Loktak Lake.
Figure 6d shows the mean monthly total river inflow to Loktak Lake associated with each of the Group 1 scenar-ios. These are based on the combined discharge from the three modelled sub-catchments and flows from those un-gauged sub-catchments discharging into the lake evaluated by weighting MIKE SHE modelled discharges by catchment area. The corresponding mean total annual discharges are
7 0 20 40 60 80 100
J F M A M J J A S O N D
D is c har ge ( m 3s -1) Baseline 1 °C 2 °C 3 °C 4 °C 5 °C 6 °C (a) 0 20 40 60 80 100 120
J F M A M J J A S O N D
D isch ar g e ( m 3s -1) Baseline 1 °C 2 °C 3 °C 4 °C 5 °C 6 °C (b) 0 5 10 15 20
J F M A M J J A S O N D
D isch ar g e ( m 3s -1) Baseline 1 °C 2 °C 3 °C 4 °C 5 °C 6 °C (c) 0 200 400 600 800 1000
J F M A M J J A S O N D
[image:13.595.54.284.73.567.2]Tot a l di s c h arge (10 6m 3) Baseline 1 °C 2 °C 3 °C 4 °C 5 °C 6 °C (d)
Fig. 7. Mean monthly discharge for the Group 2 scenarios (a)
Thoubal, (b) Iril, (c) Nambul, (d) total river inflow to Loktak Lake.
which, as shown in Table 4, is employed in the evaluation of discharge from the Khuga and Western sub-catchment, the two largest ungauged sub-catchments (combined area 1355 km2). In contrast, results from the Iril are used for the relatively small Imphal and Kongba sub-catchments (com-bined area 474 km2)whilst the location of the Thoubal on the eastern side of Loktak Lake catchment means that re-sults from this sub-catchment are not used in evaluating any ungauged flows. For the same reasons the HadCM3, IPSL and NCAR GCMs, which also result in reductions in flow from the Thoubal and, in the case of IPSL and NCAR, the Iril produce relatively small (2–4%) overall increases in river flow to the lake. The remaining GCMs, which increase mean discharge in all three modelled sub-catchments (except HadGEM1 which results in very small declines in discharge in the Thoubal), produce much larger (up to 27% for the MPI) increases in total river contributions to Loktak Lake.
A more consistent pattern of changes in discharge results from the Group 2 scenarios (Fig. 7). The progressively higher precipitation associated with rising global mean tem-perature leads to increases in mean discharge (of up to 24%, 27% and 27% for the 6◦C scenario in the Thoubal, Iril and Nambul sub-catchments respectively, Table 6), although for the Thoubal mean discharge initially declines for the 1◦C and 2◦C scenarios and for the Iril for the 1◦C scenario. The shift in the wettest month from August to June, increases in July precipitation and small declines in August precipitation are responsible for a change in the temporal distribution of river flow. Beyond the 1◦C scenario (2◦C for the Iril) peak flows shift from August to June and increase with the pro-gressively warmer scenarios. After this peak, discharges are relatively constant until October which, as previously noted, experiences enhanced precipitation compared to the baseline. Discharges in August, which were the highest for the base-line period, are lower than basebase-line for all the scenarios in all three sub-catchments with the exception of 1◦C for the Nambul. Dry season flows in the Iril sub-catchment are rel-atively unchanged, in the Nambul they increase slightly (ex-cept for the 1◦C scenario) whilst in the Thoubal they are lower. Changes in total annual discharge to Loktak Lake in-crease almost linearly with increasing global mean tempera-ture. Declines in flow in the Thoubal sub-catchment for the 1◦C and 2◦C scenarios (and for the Iril for the 1◦C sce-nario) are cancelled out by the increases in the Nambul and the subsequent evaluation of ungauged flows using results for these two sub-catchments. The 1◦C scenario produces a small (<0.1%) increase in total river inflow and this rises to 27.3% for the 6◦C scenario.
5 Implications of climate change for Loktak Lake
The implications of changes in river flow due to the two groups of climate change scenarios upon the water level regime of Loktak Lake were investigated using a monthly
water balance model initially developed for the period June 1999–May 2003 under baseline conditions. Equation (1) summarises the water balance of the lake. Given the clays underlying the lake groundwater exchanges were assumed to be small and were excluded.
Vt=Vt−1+(Pt×At-1)+Rt−(Et×(At−1−AP)) (1) −(ETt×AP)−AbsIt−AbsDt−AbsHt−Ot−St
Where:
– V is the volume of water in Loktak Lake with the initial water level in May 1999 calculated from observed water level at Ningthoukhong and a volume-level relationship developed by the LDA.
– tindicates present month.
– t-1 indicates previous month.
– P is the direct precipitation onto the lake based on rain gauge records from the KLNP meteorological station.
– Ais the area of Loktak Lake calculated from a volume-area relationship developed by the LDA.
– R is the discharge from the catchment evaluated using the MIKE SHE models for the gauged sub-catchments with ungauged catchment flows estimated by weight-ing MIKE SHE results by catchment area as discussed above.
– Eis pan open water evaporation from the KLNP mete-orological station.
– AP is the area of phumdis (135 km2, Trisal and Manihar, 2004).
– ET is evapotranspiration at KNLP provided by the LDA
and based on the Penman-Monteith method.
– AbsI is abstraction for an irrigation scheme along the
Manipur River based on records from the Public Works Department (PWD, 1967) and Irrigation and Flood Con-trol Department (IFCD, 1987). Abstractions are only possible when lake level exceeds the minimum draw-down level (MDL) of 766.2 m a.m.s.l. (equivalent to 94.6×10⁶m3).
– AbsD is abstraction for domestic consumption by
com-munities around the lake and in Imphal based on esti-mates from IFCD (1987), Government of India (1999) and Government of Manipur (2000).
– AbsH is flow through the turbines of the
8
766 767 768 769 770
Jun-99 Dec-99 Jun-00 Dec-00 Jun-01 Dec-01 Jun-02 Dec-02
Wa
te
r le
v
e
l (
m
a
m
s
l)
Observed Simulated FRL
FL
[image:15.595.52.280.69.202.2]MDL
Fig. 8. Observed and simulated mean monthly Loktak Lake water
levels (June 1999–May 2003) under baseline conditions (FRL: full reservoir level, FL: flood level, MDL: minimum drawdown level).
– O is outflow from the lake provided by releases from the Ithai Barrage and based on records from the NHPC.
– S are releases from the Ithai Barrage when lake water levels exceed the height of top of the barrage gates, the full reservoir level (FRL, 769.63 m a.m.s.l., equivalent to 841×106m3). These releases are made in order to ensure the structural stability of the barrage. Water levels are evaluated using the LDA’s volume-level relationship and volumes of water in excess of the FRL are assumed to be released in one month.
Simulated lake volumes for each month were converted to lake levels using the LDA’s volume-level relationship. Fig-ure 8 shows the simulated lake level for the period June 1999–May 2003 derived using this approach together with observed levels from the staff gauge at Ningthoukhong. It demonstrates generally good agreement between observed and simulated levels which, on average, differ by only 0.02 m (observed mean: 768.41 m a.m.s.l., simulated mean 768.43 m a.m.s.l.). Statistical comparisons of observed and simulated lake water levels yield values of the correlation co-efficient(r)and Nash–Sutcliffe coefficient(R2)of 0.81 and 0.80, respectively. These results add confidence in the ap-proach used to evaluate discharges from the ungauged sub-catchments. Lake water levels during the first half of the simulation period are particularly well reproduced, although the subsequent dry season drawdown in 2002 is underesti-mated. The average annual inputs (based on the three com-plete years within the simulation period that coincide with the hydrological year) from river flow and precipitation are 3839×106m3with the former accounting for 91% of the to-tal. The largest outflows are barrage releases (on average 68% of the 3826×106m3 total) followed by hydropower abstraction (22%). Evaporation, evapotranspiration, domes-tic and irrigation abstractions account for small proportions
(4%, 4%, 1% and 1%, respectively) of the total outflow. At no point were abstractions compromised by levels falling below the minimum drawdown level. Hydropower abstrac-tions were at, or very close to, the maximum rated capacity of the power station in all months of the simulation period. Observed and simulated water levels did not reach the full reservoir level (769.63 m a.m.s.l.) under baseline conditions so that no barrage safety releases were simulated. Seasonal variations in lake level reflect seasonality in catchment pre-cipitation and in turn river flow with peak levels occurring in September following gains throughout the monsoon pe-riod. Ithai Barrage releases are limited to these periods of high river inflow and at other times barrage gates are closed to maximise water supplies for hydropower generation, ab-stractions for which are largely responsible for the steady drawdown from October to April.
The water balance model was used to simulate the impacts of each of the climate change scenarios. For each scenario the same initial water level as the baseline simulation was employed. Revised river discharges were provided by the results of the MIKE SHE models and subsequent calcula-tion of flows from ungauged sub-catchments. New precip-itation, evaporation and evapotranspiration time series were evaluated using the delta factor approach detailed above, and the area of phumdis was assumed to remain unchanged. The same abstractions for irrigation, domestic consumption and hydropower generation employed in the simulation of base-line conditions were employed although they were subject to the minimum water level thresholds. Similarly, the recorded volumes of barrage releases were retained with additional re-leases being calculated if water levels exceeded the full reser-voir level.
765 766 767 768 769 770
Apr-99 Oct-99 Apr-00 Oct-00 Apr-01 Oct-01 Apr-02 Oct-02 Apr-03
W
a
ter
lev
e
l (
m
a
m
s
l)
Baseline CCCMA CSIRO HadCM3 HadGEM1 IPSL MPI NCAR (a)
FRL
FL
MDL
765 766 767 768 769 770
Apr-99 Oct-99 Apr-00 Oct-00 Apr-01 Oct-01 Apr-02 Oct-02 Apr-03
W
a
ter
lev
e
l (
m
a
m
s
l)
Baseline 1 ºC 2 ºC 3 ºC 4 ºC 5 ºC 6 ºC (b)
FRL
FL
MDL
[image:16.595.140.459.52.405.2]Fig. 9. Simulated mean monthly Loktak Lake water levels under baseline conditions (June 1999–May 2003) (a) Group 1 scenarios, (b)
Group 2 scenarios (FRL: full reservoir level, FL: flood level, MDL: minimum drawdown level).
level (FRL) at some point necessitating additional releases to ensure the barrage is not overtopped. The number of months when these releases are required varies from 16, 15 and 13 for those scenarios resulting in the largest increases in lake water levels (CCCMA, MPI and HadGEM1, respectively) to six for both HadCM3 and IPSL and only one for NCAR which produces the smallest gains in water levels. Results for the CSIRO GCM also indicate that additional barrage re-leases would be necessary in three months. However, given the overall reduction in river flow to the lake the predominant trend is for lower water levels which on average are 0.47 m below those of the baseline scenario. Dry season lake level drawdowns are noticeably enhanced and in three months ab-stractions for irrigation and hydropower generation would be prevented. In contrast, for the other six scenarios sufficient water is available for these abstractions throughout the simu-lation period.
Simulated water levels within Loktak Lake for the Group 2 scenarios are shown in Fig. 9b. Increases in precipitation and especially river flow result in mean lake water levels which are higher than the baseline for all the scenarios. The
difference in mean lake water levels from the baseline rises consistently with increasing global mean temperature from 0.30 m for the 1◦C scenario to 0.78 m for the 6◦C scenario. Months when water levels simulated for the Group 2 scenar-ios are lower than those of the baseline are largely restricted to the first 11 months of the simulation period and in partic-ular the drawdown of 1999–2000 which under baseline con-ditions was the largest of the simulation period. Enhanced lake evaporation and phumdi evapotranspiration at this time of year, when river inflows and precipitation are small, re-sults in lower water levels in at least one month for all of the scenarios and up to 10 months for the 3◦C scenario. In subsequent dry seasons, with the exception of March–May 2003 for the 1◦C scenario, water levels exceed those of the baseline due to enhanced river inflows during the preceding monsoon. Higher water levels during the monsoon period results in the need to release water from the barrage for all the scenarios. The number of months when these releases are necessary increases consistently with rising global mean temperature from two for the 1◦C scenario to 15 for the 6◦C
6 Discussion
Since the construction of the Ithai Barrage, water level man-agement has focussed on maximising hydropower. As pre-viously noted this has been responsible for changing the hy-drological regime of Loktak Lake. Mean lake water levels have increased by approximately 1.1 m (767.3 m a.m.s.l. be-fore the barrage, 768.4 m a.m.s.l. after barrage construction) whilst the magnitude of seasonal fluctuations has declined from approximately 3.1 m (May low water: 765.6 m a.m.s.l.; September high water: 768.7 m a.m.s.l.) to 1.1 m (March: 767.9 m a.m.s.l.; September: 769.0 m a.m.s.l.) (pre-barrage data from WAPCOS, 1993). In common with other wetlands where water levels have been maintained at higher and less variable levels (e.g. Beilfuss and Barzen, 1994; Ni et al., 2006; Baker et al., 2009), major ecological changes have re-sulted. These include the deterioration of the phumdis which are a special characteristic of the lake. During the dry sea-son under pre-barrage conditions these floating islands would make contact with the lake bed from which they would de-rive nutrients for plant growth which maintains the accumu-lation of organic matter (Santosh and Bidan, 2002; Trisal and Manihar, 2004). Comparison of phumdis thickness and wa-ter level depth derived from a bathymetric map shows that this grounding no longer occurs throughout much of Loktak Lake including within the KLNP (Singh, 2010). As a result the thickness of phumdis is declining, with surfaces becom-ing unstable reducbecom-ing the availability of suitable habitat for wildlife including the endangered brow-antlered deer (Trisal and Manihar, 2004; Angom, 2005). In addition, as shown in Fig. 8, water levels regularly exceed the flood level (FL) of 768.5 m a.m.s.l. specified in the original designs for the Loktak Multipurpose Project (PWD, 1967). This results in the inundation of lakeside villages and agricultural land im-pacting local rural livelihoods.
Results of the climate change scenarios suggest that unless water level management policies change, ecological modifi-cations within the lake are likely to be exacerbated whilst flooding of lakeside communities will be more of a prob-lem. There is some uncertainty in the magnitude and direc-tion of change in river flows within the three modelled sub-catchments associated with the Group 1 scenarios (the same change in global mean temperature for different GCMs). As advocated by Kingston and Taylor (2010), uncertainty be-tween GCMs could be addressed by the development of reli-ability ratings for GCMs through comparisons with observed climate (e.g. Perkins et al., 2007; Maxino et al., 2008; Ghosh and Mujumdar, 2009) or probabilistic climate change scenar-ios (Manning et al., 2009). Despite this uncertainty all but the CSIRO GCM result in increased total river inflow to Loktak Lake. As a result, lake water levels are predominantly higher than the baseline especially during the monsoon period. The Group 1 CSIRO scenario does, in contrast, result in a de-cline in mean water levels. However, levels in some mon-soon months are still higher or similar to baseline conditions
and in common with the remainder of the Group 1 scenarios additional releases will be necessary to maintain the safety of the Ithai Barrage. These releases will be required for all the Group 2 scenarios as total river inflow and mean lake water levels increase with rising global mean temperature, although there is some uncertainty in the response of individual sub-catchments for the smallest temperature changes.
The volumes of the releases from the Ithai Barrage calcu-lated by the water balance model can be safely accommo-dated by the discharge capacity from the barrage when its five sluice gates are fully open (PWD, 1967). However, the ability of the barrage to make larger releases to restore pbarrage water level regimes (e.g. WAPCOS, 1993) and re-duce the incidence of lakeside inundation is not known. Cur-rent abstractions from the lake are possible under the climate change scenarios with the exception of three months for the Group 1 CSIRO scenario. However, the higher lake water levels for most of the Group 1 and all of the Group 2 scenar-ios will only result in very modest increases in hydropower generation since even under baseline conditions the existing infrastructure is operating close to maximum capacity.
It is important to recognise that there are other sources of uncertainty over the future water level regime and ecologi-cal conditions of Loktak Lake. For example, water resource development schemes which have been proposed within the Khuga and Iril might reduce inflows to the lake from these sub-catchments. These might, at least partially, counter-act the enhanced inflows suggested by most of the climate change scenarios. As plans for such developments are re-fined their inclusion within the hydrological models devel-oped in this paper would permit the quantification of their impacts. Changes in precipitation may have implications for sediment delivery to the lake, which could also be influenced by land use change such as deforestation within the catch-ment. Enhanced sedimentation within the lake, reported for other lakes in the Himalayan region (Jain et al., 2002; Rai et al., 2007), would modify the volume-level-area relationship employed within the lake water balance model. Assessment of these impacts would require the quantification of sedimen-tation rate and its spatial distribution within the lake, both of which are at present unknown.
7 Conclusions
scenarios increase total annual river flow into Loktak Lake (range between −6% and +27%). In contrast, all of the Group 2 scenarios (1◦C to 6◦C increase in global mean
tem-perature for the same GCM, HadCM3) lead to almost lin-ear increases in total river flow to the lake with rising tem-perature (>0.1% for 1◦C, 27% for 6◦C) although two sub-catchments experience reductions in mean discharge for the smallest temperature increases.
With the exception of the CSIRO Group 1 scenario, re-sults suggest predominantly higher water levels within Lok-tak Lake, especially during the monsoon period. This will further enhance the trend towards elevated water levels re-sulting from the Ithai Barrage and the focus on hydropower generation. Under these conditions existing abstractions of water for irrigation and domestic consumption could be maintained whilst they are only prevented in three months for the CSIRO scenario. Additional abstractions for these uses may be possible for the scenarios indicating higher water lev-els although the potential for further hydropower generation is limited by existing infrastructure. Higher lake water lev-els are, however, likely to lead to further habitat degradation within the internationally important Loktak Lake ecosystem as well as inundation of rural communities. The additional barrage releases that will be necessary under all the scenarios (including CSIRO which increases some monsoon lake water levels) to maintain the stability of the barrage can be released using existing infrastructure. Larger releases will, however, be required if a more ecological sensitive water level regime is to be restored in order to reverse habitat degradation and prevent undesirable flooding. Further research in this area is needed to inform management responses required to mitigate the impacts of climate change upon Loktak Lake.
Acknowledgements. Research presented in this paper was supported by the UCL Department of Geography Ted Hollis Scholarship in Wetland Hydrology and Conservation and by a grant from the UK Natural and Environmental Research Council (NERC) under the Quantifying and Understanding the Earth System (QUEST) programme (Ref. NE/E001890/1). The Loktak Development Authority and Wetlands International–South Asia both provided data to support this research. We are grateful for the comments of Ritesh Kumar and one anonymous reviewer. The paper is dedicated to the late Chaman Lal Trisal, former Director of Wetlands International–South Asia.
Edited by: R. Taylor
References
Abbott, M. B., Bathurst, J. C., Cunge, J. A., O’Connell, P. E., and Rasmussen, J.: An introduction to the European Hydrological System – Systeme Hydrologique Europeen, SHE. 1 History and Philosophy of a Physically-Based Distributed Modelling System, J. Hydrol., 87, 45–59, 1986a.
Abbott, M. B., Bathurst, J. C., Cunge, J. A., O’Connell, P. E., and Rasmussen, J.: An Introduction to the European Hydrological System–Systeme Hydrologique Europeen, SHE. 2 Structure of a Physically-Based Distributed Modelling System, J. Hydrol., 87, 61–77, 1986b.
Al-Khudhairy, D. H. A., Thompson, J. R., Gavin, H., and Hamm, N. A. S.: Hydrological Modelling of a Drained Grazing Marsh under Agricultural Land Use and the Simulation of Restoration Management Scenarios, Hydrolog. Sci. J., 44, 943–971, 1999. Allen, R. G., Pereira, L. S., Raes, D., and Smith, M.: Crop
evapotranspiration–Guidelines for computing crop water re-quirements, FAO Irrigation and Drainage Paper 56, Food and Agrgiculure Organisation of the United Nations, Rome, Italy, 1998.
Andersen, J. A., Refsgaard, J. C., and Jensen, K. H.: Distributed hydrological modelling of the Senegal River Basin—model con-struction and validation, J. Hydrol., 247, 200–214, 2001. Angom, D.: Ecological Studies of Vegetation in Keibul Lamjao
Na-tional Park, Manipur. PhD Thesis, School of Sciences, Manipur University, Imphal, India, 2005.
Arnell, N. W. and Reynard, N. S.: The effects of climate change due to global warming on river flows in Great Britain, J. Hydrol., 183, 397–424, 1996.
Baker, C., Thompson, J. R., and Simpson, M.: Hydrological dy-namics I: surface waters, flood and sediment dydy-namics, in: The Wetlands Handbook, edited by: Maltby, E. B and Barker, T., Wiley-Blackwell, Chichester, UK, 120–168, 2009.
Bates, B. C., Kundzewicz, Z. W., Wu, S., and Palutikof, J. P.: Cli-mate Change and Water. Technical Paper of the Intergovernmen-tal Panel on Climate Change, IPCC Secretariat, Geneva, Switzer-land, 2008.
Beilfuss, E. D. and Barzen, J. A.: Hydrological wetland restoration in the Mekong Delta, Vietnam, in: Global Wetlands: Old World and New, edited by: Mitsch, W. J., Elsevier, Amsterdam, The Netherlands, 453–468, 1994.
Brouwer, C., Prins, K., Kay, M., and Heibloem, K.: Irrigation Water Management: Irrigation methods. Training manuals – 5. Food and Agriculture Organization of the United Nations, Rome, Italy, 1988.
Burkett, V. and Kusler, J.: Climate change: potential impacts and interactions in wetland of the United States, J. Am. Water Resour. As., 36, 313–320, 2000.
CEC: Wise use and conservation of wetlands, Communication from the Commission to the Council of the European Parliament COM (95), Brussels, Belgium, 1995.
Chakraborti, D., Singh, E. J., Das, B., Shah, B. A., Hossain, M. A., Nayak, B., Ahamed, S., and Singh, R. N.: Groundwater ar-senic contamination in Manipur, one of the seven north-eastern hill states of India: A Future Danger, Environ. Geol., 56, 381– 390, 2008.
Chiew, F. H. S., Whetton, P. H., McMahon, T. A., and Pittock, A. B.: Simulation of the impacts of climate change on runoff and soil moisture in Australian catchments, J. Hydrol., 167, 121–147, 1995.
Clair, T. A.: Canadian freshwater wetlands and climate change: guest editorial, Climate Change 40, 163–165, 1998.
2001.
Cox, K. W. and Campbell, L.: Global Climate Change and Wet-lands: Issues and Awareness. Environmental Protection Service, Environment Canada, Ontario, Canada, 1997.
Davis, J. A. and Froend, R. Loss and degradation of wetlands in southwestern Australia: underlying causes, consequences and solutions, Wetl. Ecol. Manag., 7, 13–23, 1999.
Dey, S. C.: Conservation of Biodiversity in the Keibul Lamjao Na-tional Park. Consultancy Report: Sustainable Development and Water Resource Management of Loktak Lake. Wetlands Interna-tional – South Asia, New Delhi, India, 2002.
DHI: MIKE SHE – An Integrated Hydrological Modelling System: User Guide, DHI Water & Environment, Horsholm, Denmark, 454 pp., 2005.
ERM: A Report on Environmental Impact Assessment of Loktak Lake. Consultancy Report: Sustainable Development and Water Resource Management of Loktak Lake. Report to Wetlands In-ternational – South Asia, Environ. Resour. Manage., New Delhi, India, 2003.
Erwin, K. L.: Wetlands and global climate change: the role of wet-land restoration in a changing world, Wetl. Ecol. Manag., 17, 71–84, 2009.
Farr, T. G., Rosen P. A., Caro, E., Crippen, R., Duren, R., Hens-ley, S., Kobrick, M., Paller, M., Rodriguez, E., Roth, L., Seal. D., Shaffer, S., Shimada, J., Umland, J., Werner, M., Oskin, M., Bur-bank, D., and Alsdorf, D.: The Shuttle Radar Topography Mis-sion, Rev. Geophys., 45, RG2004, doi:10.1029/2005RG000183, 2007.
FSI: The State of Forest Report, Forest Survey of India, Ministry of Environment and Forests, Dehradun, India, 185 pp., 2003. Fowler, H. J. and Kilsby, C. G.: Using regional climate model data
to simulate historical and future river flows in northwest England, Climatic Change, 80, 337–367, 2007.
Garrick, M., Cunnane, C., and Nash, J. E.: A criterion for efficiency of rainfall-runoff models, J. Hydrol., 36, 375–381, 1978. Ghosh, S. and Mujumdar, P. P.: Climate change impact assessment:
uncertainty modelling with imprecise probability, J. Geophys. Res., 114, D18113, doi:10.1029/2008JD011648, 2009.
Gorokhovich, Y. and Voustianiouk, A.: Accuracy assessment of the processed SRTM-based elevation data by CGIAR using field fata from USA and Thailand and its relation to the terrain character-istics, Remote Sens. Environ., 104, 409–415, 2006.
Government of India: Movement Towards Ensuring People’s Drinking Water Security in Rural India - Framework for Imple-mentation 2009–2012, Ministry of Rural Development, Govern-ment of India, New Delhi, India, 114 pp., 1999.
Government of Manipur: Economic Survey – Manipur (1999– 2000). Directorate of Economics and Statistics, Government of Manipur, Imphal, India, 142 pp., 2000.
Graham, D. N. and Butts, M. B.: Flexible, integrated watershed, modelling with MIKE SHE, in: Watershed Models, Singh V. P. and Frevert, D. K., CRC Press, Boca Raton, 245–272, 2005. Hartig, E. K., Grozev, O., and Rosenzweig, C.: Climate change,
agriculture and wetlands in Eastern Europe: vulnerability, adap-tation and policy, Climatic Change, 36, 107–121, 1997. Hay, D.: Framework for Water Management and Hydrology.
Con-sultancy Report: Sustainable Development and Water Resource Management of Loktak Lake, Wetlands International – South Asia, New Delhi, India, 56 pp., 1998.
Henriksen, H. J., Troldborg, L., Højberg, A. J., and Refsgaard, J. C.: Assessment of exploitable groundwater resources of Den-mark by use of ensemble resource indicators and a numerical groundwater–surface water model, J. Hydrol., 348, 224–240, 2008.
Herron, N., Davis, R., and Jones, R.: The effects of large-scale afforestation and climate change on water allocation in the Mac-quarie River catchment, NSW, Australia, J. Environ. Manage., 65, 369–381, 2002.
Hollis, G. E.: Future Wetlands in a World Short of Water, in: Wet-lands for the Future, edited by: McComb, A. J. and Davis, J. A., Gleneagles Publishing, Adelaide, Australia, 5–18, 1998. IPCC: Climate Change 2007: Synthesis Report, Contribution of
Working Groups I, II and III to the Fourth Assessment, in: Re-port of the Intergovernmental Panel on Climate Change, edited by: Core Writing Team, Pachauri, R. K. and Reisinger, A., IPCC, Geneva, Switzerland, 104 pp., 2007.
IFCD: Recast Annual Plan 1987–1988: Major and Medium, Irriga-tion and Flood Control, IrrigaIrriga-tion and Flood Control Department, Imphal, India, 15 pp., 1987.
Jain, S. K., Singh, P., and Seth, S. M.: Assessment of sedimenta-tion in Bhakra reservoir in the Western Himalayan region using remotely sensed data, Hydrol. Sci. J., 47, 203–212, 2002. Jain, S. K., Storm, B., Bathurst, J. C., Refsgaard, J. C., and Singh,
R. D.: Application of the SHE to Catchments in India 2. Field ex-periments and simulation studies with the SHE on the Kolar sub-catchment of the Narmada River, J. Hydrol., 140, 25–47, 1992. James, E. J.: Work Plan for Water Resource Management of
Lok-tak Wetland. Consultancy Report: Sustainable Development and Water Resource Management of Loktak Lake, Wetlands Interna-tional – South Asia, New Delhi, India, 37 pp., 2000.
Jarvis, A., Rubiano, J., Nelson, A., Farrow, A., and Mulligan, M.: Practical use of SRTM data in the tropics – comparisons with dig-ital elevation models generated from cartographic data, Working Document, Vol. 198, Centro Internacional de Agricultura Tropi-cal (CIAT), Cali, Columbia, 2004.
Keddy, P. A.: Wetland Ecology: Principles and Conservation. Cam-bridge University Press, CamCam-bridge, UK, 614 pp., 2000. Khan, I. A., Prasad, S. N., and Mathur, P. K.: Management of an
en-dangered cervid: A case study of Manipur Brow Antlered Deer (Cervus eldi eldi) in Keibul Lamjao National Park (KLNP), Ma-nipur. Population and Habitat Viability Assessment Workshop, Briefing Book: Brow Antlered Deer of Manipur, 11–14 October 1992, Mysore, India, 39–44, 1992.
Kingston, D. G. and Taylor, R. G.: Sources of uncertainty in cli-mate change impacts on river discharge and groundwater in a headwater catchment of the Upper Nile Basin, Uganda, Hy-drol. Earth Syst. Sci., 14, 1297–1308, doi:10.5194/hess-14-1297-2010, 2010.
Kingston, D. G., Todd, M. C., Taylor, R. G., Thompson, J. R., and Arnell, N. W.: Uncertainty in the estimation of potential evap-otranspiration under climate change, Geophys. Res. Lett., 36, L20403, doi:10.1029/2009GL040267, 2009.
Klemes, V.: Operational testing of hydrological simulation. Hy-drolog. Sci. J., 31, 31–24, 1986.
LDA, Management of Loktak Lake. Loktak Development Author-ity, Manipur, India, 85 pp., 1996.