© Author(s) 2009. This work is distributed under the Creative Commons Attribution 3.0 License.
Earth System
Sciences
Sedimentation in the Three Gorges Dam and the future trend of
Changjiang (Yangtze River) sediment flux to the sea
Bangqi Hu1,2, Zuosheng Yang1,2, Houjie Wang1,2, Xiaoxia Sun1,2, Naishuang Bi2, and Guogang Li3 1College of Marine Geosciences, Ocean University of China, 238 Songling Rd., Qingdao 266100, China
2Key Lab of Submarine Sciences & Prospecting Techniques (KLSSET), Ministry of Education, 238 Songling Rd., Qingdao 266100, China
3North China Sea Branch of the State Oceanic Administration, 22 Fushun Rd., Qingdao 266033, China Received: 17 July 2009 – Published in Hydrol. Earth Syst. Sci. Discuss.: 29 July 2009
Revised: 5 November 2009 – Accepted: 8 November 2009 – Published: 26 November 2009
Abstract. The Three Gorges Dam (TGD) on the upper Changjiang (Yangtze River), China, disrupts the continuity of Changjiang sediment delivery to downstream and coastal areas. In this study, which was based on 54 years of annual water and sediment data from the mainstream and major trib-utaries of Changjiang, sediment deposition induced by the TGD in 2003–2008 was quantified. Furthermore, we deter-mined the theoretical trapping efficiency of the cascade reser-voir upstream of the TGD. Its impact on Changjiang sedi-ment flux in the coming decades is discussed. Results show that about 172 million tons (Mt) of sediment was trapped annually by the TGD in 2003–2008, with an averaged trap-ping efficiency of 75%. Most of the total sediment depo-sition, as induced by the TGD (88%), accumulated within the region between the TGD site and Cuntan. However, sig-nificant siltation (12% of the total sediment deposition) also occurred upstream of Cuntan as a consequence of the up-stream extended backwater region of the TGD. Additionally, the Changjiang sediment flux entered a third downward step in 2001, prior to operation of the TGD. This mainly resulted from sediment reduction in the Jinshajiang tributary since the late 1990s. As the cascade reservoir is put into full opera-tion, it could potentially trap 91% of the Jinshajiang sediment discharge and, therefore, the Jinshajiang sediment discharge would most likely further decrease to 14 Mt/yr in the coming decades. Consequently, the Changjiang sediment flux to the sea is expected to continuously decrease to below 90 Mt/yr in the near future, or only 18% of the amount observed in the 1950s. In the presence of low sediment discharge, profound impacts on the morphology of estuary, delta and coastal wa-ters are expected.
Correspondence to: Zuosheng Yang (zshyang@mail.ouc.edu.cn)
1 Introduction
Rivers are conveyor belts for terrestrial material delivery to the oceans (Walling and Fang, 2003; Walling, 2006), and they annually transport a 15–20 Gt sediment load to the global oceans (Milliman and Meade, 1983; Milliman and Syvitski, 1992). These large amounts of sediment play an important role in the global geological cycle, the global geo-chemical cycle, the coastal ecosystems and the evolution of deltas. However, dam construction interrupts the continuity of a river system in transporting sediments to downstream and coastal regions (Kondolf, 1997). During the latter half of the 20th century, about 45 000 large dams over 15 m high and an estimated 800 000 small dams had been built worldwide, representing nearly an order of magnitude increase compared to the year 1950 (WCD, 2000). It is estimated that more than 30% of the global sediment flux is trapped in reservoirs (V¨or¨osmarty et al., 2003), and approximately 0.5% to 1% of the world’s total reservoir volume is lost each year as a re-sult of sedimentation (WCD, 2000). Subsequently, the global sediment flux from the rivers to the sea has decreased signif-icantly (Milliman, 1997; Syvitski et al., 2005).
DJK
TGDGD
XJB XLD BHT WDD
Hanjiang
Poyang Lake Dongting Lake
Jialingjiang
Jinshajiang Yalongjiang Minjiang
Wujiang
Gaochang
PingshanZhutuo Cuntan
Beibei Wulong
Yichang Datong
Qingxichang
80E 20N
90E 30N 40N 50N
100E 110E 120E 130E Huanghe Changjiang
The Changjiang Basin
25°N 30°N 35°N
95°E 100°E 105°E 110°E 115°E 120°E
Legend Guaging station Mainstream Tributary Lake Reservoir
Fig. 1
LongitudeLatitude
ECS
ECS-East China Sea
CHINA 0 100 200km
[image:2.595.116.481.64.277.2]Hankou Huangzhuang
Fig. 1. The Changjiang drainage basin (DJK, Danjiangkou Reservoir; TGD, Three Gorges Dam; GD, Gezhouba Dam; XJB, Xiangjiaba Reservoir; XLD, Xiluodu Reservoir; BHT, Baihetan Reservoir; WDD, Wudongde Reservoir).
began operations in 2003, the Changjiang sediment flux en-tered a third downward step. This anti-phase relationship between the Changjiang water and sediment discharge illus-trates the predominant impact of human activities on the sed-iment yield, transport and storage in this large river system (Yang et al., 2002, 2006b; Chen et al., 2005; Zhang et al., 2009). Of human activities, dam construction is the domi-nant factor (88%) contributing to the reduction in Changjiang sediment flux to the sea (Dai et al., 2008). Here, we mainly focused on the TGD (Fig. 1), which is the largest dam in the world. It is located at the end of the upper Changjiang. The water storage capacity of the TGD will be 39 km3by 2009, which is approximately 4.3% of the long-term annual water discharge at Datong (903 km3in 1950–2005).
After the TGD began to impound water and trap sediment in June 2003, the mainstream of the Changjiang has been disrupted in two parts, both upstream and downstream of the TGD (Dai et al., 2006; Yang et al., 2007a). Upstream of the TGD, the primary consequence is sedimentation. Sedimen-tation in reservoirs results in a progressive reduction in stor-age capacity and triggers a series of physical, chemical and ecological impacts on the environment. One key to assess its environment impacts is the quantitative study of reservoir sedimentation. Previous studies have estimated the annual sedimentation in the TGD by the sediment budget method; however, the reported values have been quite different from each other (Bulletin of Changjiang Sediment, 2003–2008; Dai et al., 2006; Yang et al., 2006b, 2007b; Chu and Zhai, 2008; Xu and Milliman, 2009). These differences are mainly caused by: (1) the different stations that were used as the up-stream limit of the TGD (e.g., Qingxichang vs. Cuntan, see Fig. 1); (2) whether or not the influence of sediment from
ungauged areas was considered; and (3) whether or not sed-iment erosion within the channel between the TGD site and Yichang was considered. Thus, to better understand the sci-entific and management issues of this giant reservoir, it is necessary to recalculate the sedimentation rate in the TGD by undertaking a thorough quantification study.
Although the Changjiang sediment flux had decreased by approximately 30% before the impoundment of the TGD in 2003, the impact of the TGD on downstream sediment trans-port was more immediate and sharp (Yang et al., 2006b, 2007a; Hu et al., 2009; Xu and Milliman, 2009). The con-sequences of TGD trapping were downstream erosion, delta degradation and wetlands loss (e.g., Yang et al., 2003, 2005, 2006a, 2007a, 2007b; Chen et al., 2008; Xu and Milliman, 2009). It also posed a great threat to the downstream and coastal ecosystems (Xie et al., 2003; Shen and Xie, 2004). Therefore, changes in the Changjiang sediment flux caused by the impoundment of TGD after 2003 have garnered in-creasing attention and concern.
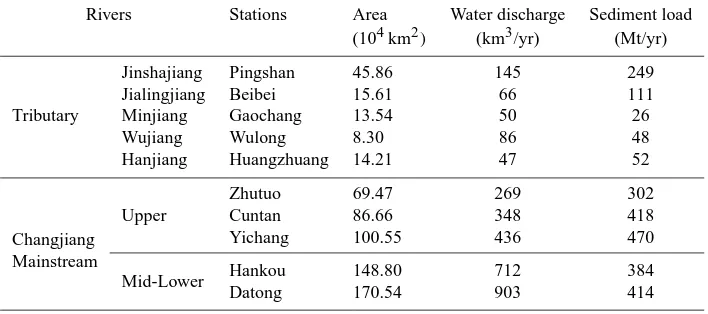
Table 1. Detailed hydrological records of stations at the mainstream and major tributaries of the Changjiang. Data series are 1950s–2005.
Rivers Stations Area Water discharge Sediment load
(104km2) (km3/yr) (Mt/yr)
Jinshajiang Pingshan 45.86 145 249
Jialingjiang Beibei 15.61 66 111
Tributary Minjiang Gaochang 13.54 50 26
Wujiang Wulong 8.30 86 48
Hanjiang Huangzhuang 14.21 47 52
Changjiang
Zhutuo 69.47 269 302
Mainstream
Upper Cuntan 86.66 348 418
Yichang 100.55 436 470
Mid-Lower Hankou 148.80 712 384
Datong 170.54 903 414
suggest that the Changjiang sediment flux will decrease to about 100–150 Mt/yr in the next six decades. Similarly, Chen et al. (2008) indicate that the Changjiang sediment flux over the post-TGD period will possibly vary from 112 Mt/yr to 132 Mt/yr or less in ordinary years. Nevertheless, these re-sults (Yang et al., 2006a, 2007a, b; Chen et al., 2008) are still under debate, due to the impact of the cascade reservoir, which was only partly or qualitatively discussed.
In this paper, we will discuss the effect of the TGD on the Changjiang hydrographic regime, through its two parts that are separated by the TGD site. The upper part is the main-stream from Pingshan to Yichang and the lower part is from Yichang to Datong (Fig. 1). Hydrological data were tempo-rally separated into two periods according to the TGD oper-ation in 2003, including: the pre-TGD period and the post-TGD period. The main objectives of this paper are: (1) to estimate the sedimentation rate in the TGD through analysis of the sediment data, both upstream and downstream of the TGD; (2) to give a quantified evaluation of the cascade reser-voir’s effect by estimating its theoretical trapping efficiency; and (3) to discuss the future trend of the Changjiang sediment flux into the sea in the coming decades.
2 Physical setting
The Changjiang originates from the Qinghai–Tibetan Plateau at an elevation of 5400 m and extends eastward 6300 km be-fore debouching into the East China Sea (ECS) (Fig. 1). The Changjiang basin covers a drainage area of 1.81×10⁶km2, accounting for about 19% of China’s national area (Chen et al., 2001). This large watershed is home to a population of more than 400 million, or 6.6% of the world’s population (UNDES, 2001). The climate of the Changjiang basin is typ-ically subtropical, wet and warm in summer, and moist and cool in winter. The annual mean temperature increases from below 4◦C in the source area to approximately 5–15◦C in the
mountainous areas and approximately 16–18◦C in the mid-dle and lower reaches (Chen et al., 2002). The average pre-cipitation and evaporation in the Changjiang basin are 1000– 1400 mm/yr and 700–800 mm/yr, respectively (Shen, 1986). The upper Changjiang, with a drainage area of about 1.00×10⁶km2, extends 4500 km from the source to Yichang station. It is characterized by mountains and hills, with an average gradient of 1.1% (Yang et al., 2007a). Four major tributaries (Jinshajiang, Jialingjiang, Minjiang, and Wujiang) join the mainstream of the upper Changjiang (Fig. 1 and Table 1). The mid-lower Changjiang flows 1880 km from Yichang to Datong, with a drainage area of 0.8×10⁶km2. It flows through extensive fluvial plains, with several lakes (e.g., Dongting and Poyang Lakes, see Fig. 1) linked with the mainstream. Both of the two large lakes trap most of the sed-iment from their own drainage basins and greatly regulate the Changjiang sediment flux to the sea (Dai et al., 2005; Yang et al., 2007a; Chen et al., 2008). The Hanjiang is the largest tributary in the mid-lower Changjiang. Downstream of Da-tong, the river is tidally influenced. Therefore, the Datong water and sediment records are generally used to represent the mass flux of the Changjiang that is discharged into the sea, though it is over 600 km upstream from the river mouth. Within the Changjiang basin, the water and sediment distri-bution pattern is quite uneven. Most of the Changjiang sed-iment discharge to the sea mainly originates from the upper reaches, whereas water discharge from the upper reaches ac-counts for only 50%, compared to that of Datong (Chen et al., 2001; Wang et al., 2008).
Table 2. The cascade reservoir on the lower Jinshajiang of the upper Changjiang (see Fig. 1 for locations, adapted from Liu, 2007).
Dam site Elevation (m)
Watershed area (104km2)
Average inflow (km3/yr)
Total storage (km3)
Active storage (km3)
Install capacity (MW)
Annual energy (GWh)
Wudongde 723 39.6 120 5.86 2.62 8 700 39.5
Baihetan 550 41.7 130 19.01 10.44 1 305 57.7
Xiluodu 370 44.0 139 11.57 6.46 1 260 57.4
Xiangjiaba 220 44.5 141 4.98 0.9 600 30.8
Xiangjiaba) have been planned, taking advantage of a 730 m drop over 770 km of the river in the lower Jinshajiang (Fig. 1 and Table 2). The Xiluodu and Xiangjiaba Dams are now un-der construction and will be put into operation in 2013 and 2012, respectively. The other two dams, Wudongde and Bai-hetan, will start construction in 2010 and be put into opera-tion in the 2020s (Liu, 2007; Yang et al., 2007b). The total storage capacity of the cascade reservoir on the lower Jin-shajiang would be around 41.4 km3, which is about one third of the current annual water discharge of 145 km3from the Jinshajiang tributary.
3 Data collection and methods
3.1 Data collection
Water and sediment data used in this study were mainly provided by the Changjiang Water Resources Commission (CWRC) and partly from the Bulletin of Changjiang Sed-iment (2000–2008), published by the CWRC (available in http://www.cjh.com.cn/). Bed load is not included in the present study, as its contribution to total load is less than 2% in the Changjiang (Yang et al., 2002, 2003). The locations and detailed hydrological records of stations are presented in Fig. 1 and Table 1.
3.2 Estimates of sediment deposition caused by the TGD
Yichang station is located 44 km downstream from the TGD site and, thus, it can act as the TGD output station. The water and sediment discharges of Yichang are mainly fed by Jin-shajiang, Jialingjiang, Minjiang and Wujiang (Fig. 1). These four major tributaries collectively contribute 80% of the wa-ter discharge and 93% of the sediment load at Yichang station (Table 1). Fu et al. (2006) established a correlation between sediment load at Yichang and that from the four major tribu-taries in the pre-TGD period (1950s–2002). This correlation was also used by Chen et al. (2008) to calculate the total sed-iment entering the TGD during the post-TGD period. How-ever, the sediment load at Yichang has displayed a distinct decreasing trend since the mid-1980s, as a result of
intensi-fying human activity (e.g., dams and soil conservation) in the upper Changjiang basin (Fig. 2a) (Xu et al., 2006; Yang et al., 2006b; Xiong et al., 2009). Therefore, the sediment data for the period of 1986–2002 may be more representative of the condition just before the TGD than the whole period (1950s– 2002).
In this study, the time series of the sediment data were di-vided into two periods: the pre-TGD period (1986–2002) and the post-TGD period (2003–2008). Accordingly, two meth-ods were used to estimate the sedimentation rate in the TGD. (1) First, we established the correlation between sediment load at Yichang and that from the four major tributaries dur-ing the pre-TGD period (1986–2002) (Fig. 2b). This corre-lation was used to restore the scenario of sediment load at Yichang in the post-TGD period. Differences between the restored and measured sediment load at Yichang in 2003– 2008 were assumed to be equal to the reservoir sedimenta-tion. (2) The other method was based on a sediment bud-get, which has been used in previous studies (e.g., Dai et al., 2006; Yang et al., 2007b, Chu and Zhai, 2008).
3.3 Computing the theoretical trapping efficiency (TE) of reservoirs
The theoretical trapping efficiency (TE) of the large reser-voirs (>0.5 km3)can be approximated using the empirical relationship originally developed by Brune (1953):
TE=1−√0.05
1τR
(1) where1τRis the local residence time change calculated with
Eq. (2):
1τR= n P
i
Vi
Q (2)
whereVi is the storage capacity of thei-th reservoir (km3)
Table 3. Sediment budgets of the mainstream from Pingshan to Yichang (Unit: Mt/yr).
Sediment from the ungauged area Sediment deposition(+)/erosion(−)
Periods Jinshajiang Minjiang Jialingjiang Wujiang Cuntan Yichang Cuntan- Yichang- Yichang- Cuntan- Yichang-
Yichang-(Pingshan) (Gaochang) (Beibei) (Wulong) Pingshan Cuntan Pingshan Pingshan Cuntan Pingshan
2003 156 48 31 14 206 98 32 11 43 61 133 194
2004 148 34 18 11 173 64 22 7 29 49 127 176
2005 188 59 42 4 270 110 37 11 48 56 175 231
2006 90 21 3 3 109 9 10 2 12 15 105 120
2007 150 31 27 10 210 53 25 9 34 23 176 199
2008 204 15 14 4 212 32 32 5 37 53 189 242
2003–2008 156 35 23 8 197 61 26 8 34 43 151 194
1956–2002 254 48 115 28 430 492 41 33 74 28 −1 27
Sediment deposition caused by TGD 15 152 167
Cuntan and Yichang are two mainstream stations for the upper Changjiang, and Jinshajiang, Minjiang, Jialingjiang and Wujiang are four major tributaries delivering sediment discharges into the mainstream (Fig. 1). The data of sediment from the ungauged areas are after Dai et al. (2006) and Yang et al. (2007a, b) or calculated by the same method.
Sediment deposition(+)/erosion(−) from Yichang to Pingshan was calculated by subtracting Yichang from the sum of Jinshajiang, Minjiang, Jialingjiang, Wujiang and the ungauged
area in Yichang-Pingshan. The budgets for Yichang-Cuntan and Cuntan-Pingshan were calculated in a similar way. The differences of sediment deposition between 1956–2002 and 2003–2008 were assumed to the TGD-induced.
reservoir, the volumes of each dam were summarized, and the annual water discharge used was the long-term mean wa-ter discharge at the afwa-termost station (Pingshan station).
Brune’s method for calculating the theoretical TE, origi-nally developed for reservoirs in the United States, is widely used for reservoirs in other parts of the world as well. This method can provide reasonable estimation of long-term and mean TE of large reservoirs (e.g., V¨or¨osmarty et al., 1997, 2003; Morris and Fan, 1998; Kummu and Varis, 2007).
4 Results
4.1 Sediment deposition caused by the TGD
On the basis of the annual sediment data at Yichang (QSY )
and that from the four major tributaries (QST ) of the
up-per Changjiang, linear regression equations in the pre-TGD (1986–2002) and post-TGD (2003–2008) periods were ob-tained as follows (Fig. 2):
Pre-TGD:QSY=1.125QST−20 (3)
Post-TGD:QSY=0.554QST−61 (4)
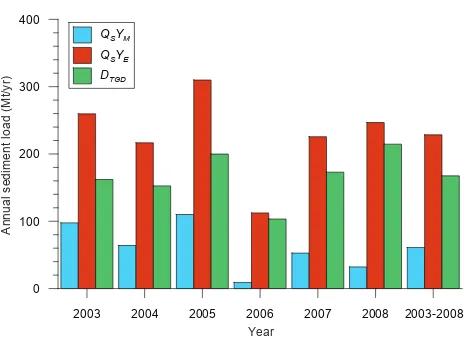
The coefficients of determination,R2, for the above cor-relations were 0.85 and 0.71, respectively, at a significance level of P <0.01. Mean annual sediment load at Yichang was estimated at 228 Mt for 2003–2008 by Eq. (3) (in the case of non-TGD). These estimated values can be viewed as the total sediment load entering the TGD (Chen et al., 2008) (Fig. 3). Thus, the differences between the estimated (non-TGD) and measured (with TGD operation) sediment load at Yichang were assumed equivalent to sediment deposition caused by the TGD. The mean annual sediment trapped by the TGD was 168 Mt/yr in 2003–2008, with the maximum sediment deposition (215 Mt) occurring in 2008 and the min-imum (103 Mt) occurring in 2006 (Fig. 3).
1955 1965 1975 1985 1995 2005 0
200 400 600 800
0 200 400 600 800 0
200 400 600 800
1955-1985 1986-2002 2003-2008
TGD Dams and soil conservation
QSY
QST
Annual sediment load (Mt/yr)
Annual sediment load at Yichang (Mt/yr)
Annual sediment load from four major tributaries (Mt/yr) 1986-2002 QSY=1.125*QST-20
n=17, R2=0.85
2003-2008 QSY=0.554*QST-61
n=6, R2=0.71
1955-1985 1986-2002
2003-2008
(a)
(b) Year
Fig. 2
Fig. 2. Time series of annual sediment load at Yichang (QSY )and
[image:5.595.315.538.289.632.2]2003 2004 2005 2006 2007 2008 2003-2008 0
100 200 300 400
QSYM
QSYE
DTGD
Annual sediment load (Mt/yr)
Fig. 3
Year
Fig. 3. Annual sediment load at Yichang and the sediment de-position caused by TGD in 2003–2008. The sediment dede-position caused by TGD (DTGD)was assumed to be the differences between
the measured (QSYM, with the TGD operation) and the estimated (QSYE, non-TGD) sediment load at Yichang.
To validate the above estimated results, we also estab-lished the sediment budgets of the mainstream reaches from Yichang to Pingshan, which was subdivided into two sec-tions: (1) the lower section from Yichang to Cuntan and (2) the upper section from Cuntan to Pingshan. Results of the sediment budgets show that sediment deposition from Yichang to Pingshan has increased from 27 Mt/yr in 1956– 2002 to 194 Mt/yr in 2003–2008, indicating that the TGD-induced sediment deposition averaged 167 Mt/yr in 2003– 2008 (Table 3). This is very close to the above estimated result of 168 Mt/yr, by our formula (Fig. 3). The sediment budgets also provided insight into the distribution pattern of the sediment deposition caused by the TGD. The data suggest that 152 Mt/yr of the sediment deposition caused by TGD was deposited in the lower section from Yichang to Cuntan, and the remaining 15 Mt/yr was deposited in the upper sec-tion from Cuntan to Pingshan (Table 3).
[image:6.595.51.284.58.227.2]As the mainstream channel between the TGD site and Yichang suffered from serious erosion after the TGD oper-ation (Bulletin of Changjiang sediment, 2003; Yang et al., 2007a, b), the sediment trapping effect of the TGD would be underestimated by both methods, as discussed above. In 2003–2008, sediment load increased from 58 Mt/yr at Huan-glingmiao (just 13 km downstream of the TGD) to 61 Mt/yr at Yichang (44 km downstream of the TGD) (Bulletin of Changjiang sediment, 2003–2008). Because there are no small tributaries joining the mainstream between the TGD site and Yichang, this increase of 3 Mt/yr in sediment can be attributed to the riverbed erosion between the two stations, with a sediment erosion rate of 0.1 Mt/km/yr. Given this sed-iment erosion rate for the whole channel, from the TGD site to Yichang (44 km channel length), the total sediment ero-sion between the TGD site and Yichang was calculated as
Table 4. The theoretical trapping efficiency for the cascade reser-voir on the lower Jinshajiang and the TGD with different water lev-els.
Dam Qa(km3/yr) Vb(km3) 1τRc TEd
Wudongde 120 5.9 0.05 77%
Baihetan 130 19.0 0.15 87%
Xiluodu 139 11.6 0.08 83%
Xiangjiaba 141 5.0 0.04 73%
Cascade 145 41.4 0.29 91%
436 13.6 (139 m) 0.03 72%
TGD 436 23.1 (156 m) 0.05 78%
436 39.3 (175 m) 0.09 83%
aAnnual water Discharge at the dam locations (Liu, 2007). bStorage volume (Liu, 2007; Yang et al., 2005).
cLocal residence time, Eq. (2).
dTE calculated using the Brune’s method, Eq. (1).
4.4 Mt/yr in 2003–2008. This amount of sediment should be added to the sediment deposition in the lower section, from the TGD site to Cuntan. In conclusion, the total sediment trapped by the TGD averaged 172 Mt/yr in 2003–2008, of which 88% was trapped in the lower section, from the TGD site to Cuntan, and the remaining 12% was deposited up-stream of Cuntan. In 2003–2008, the estimated sediment TE of the TGD averaged 75%.
4.2 Theoretical trapping efficiency of the reservoirs
Four large dams, Wudongde, Baihetan, Xiluodu and Xiangji-aba, with a total storage capacity (41.4 km3)greater than the TGD, are now under construction or will be constructed up-stream of the TGD (Fig. 1 and Table 2). To evaluate the im-pact of the whole cascade reservoir on the Changjiang sed-iment flux in the coming decades, the theoretical TE was calculated using Brune’s method. The theoretical TE for the individual dams of the cascade reservoir varies from 73% to 87%. On completion of the cascade reservoir, it would be theoretically capable of trapping 91% of the sedi-ment discharge coming from the Jinshajiang basin (Table 4). The theoretical TE of the TGD was 73% and 78%, with a water elevation of 139 m and 156 m, respectively (Table 4). This approximates the real TE of 75% in 2003–2008, when the water elevation varied from 139 m to 156 m. As the wa-ter elevation of TGD rises to 175 m afwa-ter 2009, the theoretical TE of the TGD will be up to 83%, which is much more than the value of 69% estimated by Yang et al. (2005).
[image:6.595.313.542.106.220.2]Table 5. Summary of the estimated sedimentation rate in the TGD (Unit: Mt/yr).
Sedimentation rate (Mt/yr) Time scale Reference
110 2003–2004 Yang et al., 2006b
118 2003–2006 Xu and Milliman, 2009
122 2003–2004 Dai et al., 2006
125 2003 Chu and Zhai, 2008
138 2003–2008 CWRC, 2003–2008
151 2003–2005 Yang et al., 2007b
172 2003–2008 This study
sediment trapping in the reservoir was constrained by not only the local residence time related to its storage capac-ity, but also the sediment supply from the upstream basin. For example, although the Baihetan Reservoir has the highest theoretical TE of 87% in the Jinshajiang cascade reservoirs, it probably would not trap much sediment as a result of the upstream Wudongde Reservoir’s sediment buffering effect.
By contributing around 60% of the total sediment dis-charge from the upper reaches into the TGD, the Jinshajiang became the major sediment source of the Changjiang, both pre- and post-TGD. After the cascade reservoir on the lower Jinshajiang is put into full operation in the 2020s, the sedi-ment passing Pingshan will most likely decrease sharply to ca. 14 Mt/yr (9% of 156 Mt/yr in 2003–2008). If the sedi-ment discharge from other sub-basins maintains present lev-els (99 Mt/yr in 2003–2008) (Table 3), the total sediment dis-charge entering the TGD will decrease to 113 Mt/yr in the next decade, which is less than half of that in 2003–2008. Given that the TE of the TGD, with its water elevation at 175 m after 2009, is 83% (Table 4), the sediment discharge passing Yichang would be only around 19 Mt/yr in the com-ing decades.
5 Discussion
5.1 The upstream extending backwater region of the TGD in 2003–2008
By considering the influences of the sediment source from the ungauged area and the riverbed erosion within the chan-nel between the TGD site and Yichang, Yang et al. (2007b) reported the highest sedimentation rate of 151 Mt/yr in the TGD (Table 5). However, the significant siltation in the up-stream area of Cuntan (15 Mt/yr in 2003–2008) was underes-timated or neglected in previous studies. This siltation may be related to the upstream extended backwater region of the TGD. When sediment deposited in the backwater region, as a result of the decreased current velocity and sediment car-rying capacity, it brings a feedback mechanism. This allows the depositional environment to propagate much farther up-stream than the initial hydraulic backwater curve might
sug-1000 800 600 400 200 0
0 50 100 150 200 250 300
250 300 350 400 450 500 550
2003 2004 2005 2006 2007 2008 Pre-TGD
Pingshan
Zhutuo
Cuntan
Qingxichang Yichang
The backwater region extending upward
TGD
TGD
Zhutuo
Yichang
Qingxichang
Cuntan
Huanglingmiao
Pingshan
(a) 0 50 100km
Annual sediment load after TGD (Mt/yr) Annual sediment load before TGD (Mt/yr)
Distance to the TGD (km)
(b)
Fig. 4
Jialingjiang
Wujiang
Minjiang
The arrow indicates the direction of sediment transports
Fig. 4. (a) The sketch map of the Three Gorges Dam (TGD); (b) The annual sediment load after the impoundment of the TGD in comparison with the long-term average values (Pre-TGD, 1950s– 2000) at the stations along the upper Changjiang. It is suggested that the backwater region of TGD has upstream extended beyond Zhutuo station in 2006 (760 km upstream of the TGD site). Note that the sediment load at Qingxichang in 2008 is not available.
gest (Goodwin et al., 2000). This extended backwater re-gion was observed in numerous dam systems, including the Aswan High Dam on the Nile River in Egypt (El-Manadely et al., 2002), the Sardar Sarovar Dam on the Narmada River in Indus (Bettess, 1993), and the Sanmenxia reservoir on the Yellow River in China (Wang et al., 2007b). This phe-nomenon of the upstream extended backwater region appears to occur in the TGD as well.
[image:7.595.51.283.99.190.2]Changjiang in 2003–2008. As shown in Fig. 4b, sediment load along the upper Changjiang increased from 254 Mt/yr at Pingshan to 492 Mt/yr at Yichang during the pre-TGD period, indicating an additional sediment input of the trib-utaries and/or riverbed erosion. After the TGD was put into operation, however, the sediment load began decreasing from Qingxichang in 2003, from Cuntan in 2004 and 2005, and from Zhutuo after 2006. This indicates that the back-water region of the TGD has extended gradually upstream from Qingxichang (470 km upstream of the TGD) to Zhutuo (760 km upstream of the TGD), accompanied by sediment deposition in these regions. As the water elevation of the TGD increases to 175 m after 2009, the backwater region of the TGD may be extended further upstream. Consequently, the trapping of more sediment within the extended backwater region is expected. The impact of this on local environments should attract more attention.
Due to the short-term data of the post-TGD period, as well as the rough sediment budgets, a rigorous upstream limit of the TGD backwater region cannot be obtained at present. Otherwise, the sedimentation rate of the TGD calcu-lated herein reflects only the suspended sediment load. Un-doubtedly all of the bed loads coming from the upper reaches of the TGD are trapped as well, though the amounts of bed loads are unclear. These bed loads are most likely deposited in the backwater region of the TGD, owing to the reduced current velocity and sediment carrying capacity in this re-gion. In addition, landslides and debris flows, taking place around the margins of the new TGD-induced high lake, will also contribute large amounts of sediment into the TGD, es-pecially when the TGD water level fluctuates during floods and drawdowns. Both of these would increase the sedimenta-tion rate of the TGD. Therefore, more in-situ investigasedimenta-tions are required for future studies. These investigations should include repeat bathymetric surveys and/or coring at key loca-tions, as suggested by Snyder et al. (2004), which may pro-vide more detail about depositional processes and the history of the TGD.
5.2 Prior reduction of the Changjiang sediment flux before the TGD
As the Changjiang sediment flux is mainly supplied by the upper reaches (Chen et al., 2001), the correlation of sed-iment load between Yichang and Datong was well estab-lished during the pre-TGD period (Fig. 5). As indicated by Yang et al. (2006b), the correlation between Yichang and Da-tong gradually became significant (Fig. 5b). For the period of 1953–1968, before the impoundment of the Danjiangkou Reservoir, the Hanjiang was the largest sediment contributor to the mainstream of Changjiang below Yichang. Addition-ally, the Dongting Lake plays an important role in regulat-ing the Changjiang sediment flux (Dai et al., 2005; Yang et al., 2007a). In 1953–1968, a large amount (35%) of sedi-ment coming from Yichang was deposited in the Dongting
1950 1960 1970 1980 1990 2000 2010 0
200 400 600 800
0 200 400 600 800
0 200 400 600 800
1953-1968 1969-1985 1986-2002
2003-2008 R2=0.47
R2=0.69
1986-2002 QSD=0.489*QSY+144
R2=0.89
2003-2008 QSD=1.272*QSY+76
R2=0.97
TGD
1954 1998
1954 1998 Yichang
Datong
Annual sediment load (Mt/yr)
Annual sediment load at Datong (Mt/yr)
Annual sediment load at Yichang (Mt/yr) Year
(a)
(b)
Fig. 5
Fig. 5. (a) Comparison with the sediment load at Yichang and Da-tong from 1950–2008. In the extreme floods years of 1954 and 1998, about 100 Mt of sediments were lost in the middle reaches through the river breaches and overbank flows (Yang et al., 2006b); (b) Correlations between sediment load at Yichang and Datong dur-ing the different periods (modified from Yang et al., 2006b, the ex-treme flood years of 1954, 1998 were excluded).
Lake (Dai et al., 2005; Xu et al., 2007). Therefore, for 1953– 1968, the correlation between Yichang and Datong was low (R2=0.47). In contrast, after the mid-1980s, the Hanjiang had almost stopped supplying sediment to the mainstream (10 Mt/yr in 1986–2002 vs. 122 Mt/yr in 1953–1968). In the same period of 1986–2002, the sediment depleted in Dongt-ing Lake also decreased sharply to 47 Mt/yr, or 11% of that at Yichang (Xu et al., 2007). The correlation between Yichang and Datong in 1986–2002, therefore, became more signif-icant (R2=0.89). Thus, the correlation in 1986–2002 may well indicate the sediment transport process in the mid-lower Changjiang just before the TGD.
[image:8.595.309.546.72.429.2]1950 1955 1960 1965 1970 1975 1980 1985 1990 1995 2000 2005 0
100 200 300 400 500 600 700
1950 1960 1970 1980 1990 2000 0
100 200 300 400 500
1950 1960 1970 1980 1990 2000 2010 0
100 200 300 400
1950 1960 1970 1980 1990 2000 2010 0
100 200 300
After Cascade <15Mt/yr
(1) Hanjiang, 1968 (2) Jialingjiang, 1985
(3) Jinshajiang, 2000
(1)
(2)
(3)
Sediment reduction caused by TGD
90 Mt/yr After Cascade
?
Fig. 6
YearAnnaul sediment load (Mt/yr)
Fig. 6. Time series of the Changjiang sediment flux to the sea from 1953 to 2008. The black circle is the measured sediment load at Datong, and the open circle represents the estimated sediment load at Datong in 2003–2008 in the case of no-TGD. Three phases of sediment reductions are displayed with the red line. The averaged value for 2001-2008 was calculated in the case of no-TGD. The first and second phases are consistent with Yang et al. (2006b). However, the Changjiang sediment flux had entered the third downward step in 2001 ahead of the TGD operations, corresponding to the sediment reduction in the Jinshajiang since the late 1990s. After the cascade reservoir on the lower Jinshajiang put into full operation, the changjiang sediment flux possibly further decrease to below 90 Mt/yr. The grey region is the sediment reduction caused by TGD (102 Mt/yr in 2003–2008). See text for more detail.
(228 Mt/yr), mean annual sediment load at Datong had decreased by 91 Mt/yr, from 352 Mt/yr in 1986–2000 to 261 Mt/yr in 2001–2008 (non-TGD). This strongly implies that the third downward step in the Changjiang sediment flux happened even earlier, before the TGD. This can be mainly ascribed to increased reforestation and the construction of large hydraulic projects within the lower Jinshajiang basin since the late 1990s (Xu et al., 2006; Xiong et al., 2009). These human activities caused the Jinshajiang sediment dis-charge to sharply decline from 280 Mt/yr in 1986–2000 to 171 Mt/yr in 2001–2008 (Fig. 6). Sediment reduction in-duced by the TGD at Datong was estimated at 102 Mt/yr in 2003–2008 (gray region in Fig. 6), which is larger than the values given by Yang et al. (2007b).
5.3 Future trend of the Changjiang sediment flux to the sea
The correlation between sediment load at Yichang and Da-tong before the TGD was implemented has been applied to forecast the Changjiang sediment flux after the TGD in the previous studies (e.g., Yang et al., 2002, 2003, 2005, 2006b). However, it should be noted that the correlation be-tween Yichang and Datong after the TGD has been funda-mentally changed (Fig. 5b). This is mainly as a result of the changed sediment dynamics downstream of the TGD, such as
the changed sediment transport regimes, the transition from deposition to erosion and the shrinking Doting Lake (Xu et al., 2007, Yang et al., 2007a; Hu et al., 2009; Xu and Mil-liman, 2009). Thus, the correlation before the TGD may not represent the sediment transport process in the mid-lower Changjiang over the post-TGD period.
In spite of some uncertainties in the correlation between Yichang and Datong after TGD, owing to their relatively short period (2003–2008), it was applied to provide an in-sight into the future trend of the Changjiang sediment flux over the post-TGD period. According to the regression equa-tion for the post-TGD period (Fig. 5b), the sediment load at Datong will decrease to 100 Mt/yr when sediment load at Yichang is further decrease to 19 Mt/yr in the next decade. Moreover, several other factors will cause further reduction in the Changjiang sediment flux to the sea in the near future, as detailed below.
[image:9.595.100.495.64.297.2]estimated at over 90×103km2, with an increasing rate of 5000 km2/yr. The WSCP has partly accounted for the sed-iment reduction of the Jialingjiang in the 1990s and the Jin-shajiang in the 2000s (Xu et al., 2006; Yang et al., 2006b). Around 15% of the total sediment reduction at Datong, from 504 Mt/yr in 1956–1965 to 320 Mt/yr in 1993–2002, was attributed to the effects of the WSCP (Dai et al., 2008). The Chinese government has approved a plan to protect and recover an additional area of 75×103km2 within the Changjiang basin in the next decade. Therefore, the WSCP would, to a great extent, further decrease the Changjiang sed-iment flux to the sea in the next decade.
Last, in response to the TGD trapping, the downstream reaches of the TGD have suffered from severe erosion (Dai et al., 2006; Yang et al., 2006b, 2007a, b; Xu et al., 2006; Chen et al., 2008; Xu and Milliman, 2009). About 70 Mt/yr of sediment was eroded from the channel between Yichang and Datong in 2003–2008 (data in 2003–2006 were after Xu and Milliman (2009)). These channel erosion sediments accounted for 45% of the Changjiang sediment flux to the sea in 2003–2008. The erosion magnitude decreased along the downstream direction in 2003–2008, when the sediment erosion rate was 0.1 Mt/km/yr for the TGD site-Yichang, 0.07 Mt/km/yr for Yichang-Hankou, and 0.05 Mt/km/yr for Hankou-Datong. The erosion capacity will decrease with an increase in water depth, and the maximum erosion depth will extend downstream from the TGD site to Datong within 60 years (Lu, 2002; Yang et al., 2007a, b). Thus, sediment availability will be a limiting factor influencing sediment re-covery downstream of the TGD on a long-term time scale (Yang et al., 2007b; Chen et al., 2008).
Taking the above-mentioned factors into account, the Changjiang sediment flux to the sea is conservatively ex-pected to be less than 90 Mt/yr in the coming decades, when the cascade reservoir upstream of the TGD is put into full operation (Fig. 6). This value is not only much lower than most of the values predicted by previous studies (e.g., Yang et al., 2002, 2003, 2006b), but also lower than the minimum values given by Yang et al. (2007a) and Chen et al. (2008). Furthermore, for a longer time scale, when sediment entrain-ment downstream of the TGD is exhausted, the Changjiang sediment flux to the sea will possibly decrease further.
6 Conclusions
Our study shows that the TGD annually trapped about 172 Mt of sediment coming from the upper Changjiang in 2003– 2008, which is higher than the values published by the CWRC and those estimated by previous studies. These dif-ferences are mainly a result of the underestimation or neglect of siltation in the backwater region of the TGD. The sedi-ment budgets show that 88% of the total sedisedi-ment trapped by the TGD is deposited in the lower section, from the TGD site to Cuntan. The remaining 12% is deposited in the upstream
of Cuntan as a result of the effect of the extended backwater area of the TGD.
Owing to the sediment reduction of the Jinshajiang since 2000, the sediment discharge from the Changjiang to the sea entered a third downward step in 2001, ahead of the TGD operation. The proposed cascade reservoir on the lower Jinshajiang may potentially trap 91% of the sediment com-ing from the Jinshajiang basin when it is put into full op-eration in the next decade. Consequently, the sediment dis-charge from the Changjiang to the sea will probably decrease to less than 90 Mt/yr in the coming decades, or only 18% of that in the 1950s. In response to the lower sediment supply, the Changjiang subaqueous delta will be eroded extensively, and a series of profound geological, morphological, ecologi-cal, and biogeochemical responses will appear in the estuary, delta, and coastal sea.
Acknowledgements. We are grateful to the Changjiang Water
Resources Commission (CWRC) for the access to the valuable data sets. He Minxue (Kevin) and two anonymous reviewers are highly appreciated for their constructive comments, suggestions, and critical reviews. Thanks also give to Editor Matjaz Mikos for his kindly comments on an earlier draft. This work was financially supported by National Natural Science Foundation of China (NSFC) (Grant No. 40676035).
Edited by: M. Mikos
References
Bettess, R.: Sediment and backwater aspects of Sardar Sarovar Project, HR Wallingford, Report EX2761, 1993.
Brune, G. M.: Trap efficiency of reservoirs, Transactions of the American Geophysical Union, 34, 407–418, 1953.
Bulletin of Changjiang Sediment: Press of Ministry of Water Re-sources of the People’s Republic of China, available at: http: //www.cjh.com.cn/, Beijing, 2000 (in Chinese).
Bulletin of Changjiang Sediment: Press of Ministry of Water Re-sources of the People’s Republic of China, available at: http: //www.cjh.com.cn/, Beijing, 2001 (in Chinese).
Bulletin of Changjiang Sediment: Press of Ministry of Water Re-sources of the People’s Republic of China, available at: http: //www.cjh.com.cn/, Beijing, 2002 (in Chinese).
Bulletin of Changjiang Sediment: Press of Ministry of Water Re-sources of the People’s Republic of China, available at: http: //www.cjh.com.cn/, Beijing, 2003 (in Chinese).
Bulletin of Changjiang Sediment: Press of Ministry of Water Re-sources of the People’s Republic of China, available at: http: //www.cjh.com.cn/, Beijing, 2004 (in Chinese).
Bulletin of Changjiang Sediment: Press of Ministry of Water Re-sources of the People’s Republic of China, available at: http: //www.cjh.com.cn/, Beijing, 2005 (in Chinese).
Bulletin of Changjiang Sediment: Press of Ministry of Water Re-sources of the People’s Republic of China, available at: http: //www.cjh.com.cn/, Beijing, 2007 (in Chinese).
Bulletin of Changjiang Sediment: Press of Ministry of Water Re-sources of the People’s Republic of China, available at: http: //www.cjh.com.cn/, Beijing, 2008 (in Chinese).
Chen, J. S., Wang, F. Y., Xia, X. H., and Zhang, L. T.: Major ele-ment chemistry of the Changjiang (Yangtze River), Chem. Geol., 187(3–4), 231–255, 2002.
Chen, X. Q., Zhang, E. F., Mu, H. Q., and Zong, Y.: A prelimi-nary analysis of human impacts on sediment discharges from the Yangtze, China, into the sea, J. Coastal Res., 21(3), 515–521, 2005.
Chen, X. Q., Yan, Y., Fu, R. S., Dou, X., and Zhang, E. F.: Sediment transport from the Yangtze River, China, into the sea over the Post-Three Gorge Dam Period: A discussion, Quatern. Int., 186, 55–64, 2008.
Chen, Z. Y., Li, J. F., Shen, H. T., and Wang, Z. H.: Yangtze River of China: historical analysis of discharge variability and sediment flux, Geomorphology, 41, 77–91, 2001.
Chu, Z. X. and Zhai, S. K.: Yangtze River Sediment: In Response to Three Gorges Reservoir (TGR) Water Impoundment in June 2003, J. Coastal Res., 24, 30–39, 2008.
Dai, Shi-bao, Yang, Shi-lun, Zhu, Jun, Gao, Ang, and Li, Peng: The role of Lake Dongting in regulating the sediment budget of the Yangtze River, Hydrol. Earth Syst. Sci., 9, 692–698, 2005, http://www.hydrol-earth-syst-sci.net/9/692/2005/.
Dai, S. B., Yang, S. L., and Li, P.: Regulation of the main river channel to the sediment discharge of Yangtze catchment, Acta Geographica Sinica, 61, 461–470, 2006 (in Chinese with English abstract).
Dai, S. B., Lu, X. X., Yang, S. L., and Cai, A. M.: A prelimi-nary estimate of human and natural contributions to the decline in sediment flux from the Yangtze River to the East China Sea, Quatern. Int., 186(1), 43–54, 2008.
El-Manadely, M. S., Abdel-Bary, R. M., El-Sammany, M. S., and Ahmed, T. A.: Characteristics of the delta formation resulting from sediment deposition in Lake Nasser, Egypt: Approach to tracing lake delta formation, Lakes & Reservoirs: Research and Management, 7, 81–86, 2002.
Fu, R. S., Qi, M. L., Fang, H. W., and Chen, X. Q.: Influence of hydro-engineering projects in the upper Yangtze River on the changes of water and sediment output from Yichang Station, Journal of Hydroelectric Engineering, 24, 103–110, 2006 (in Chinese with English abstract).
Goodwin, P., Falte, M., and Betts, A. D. K.: Managing for unfore-seen consequences of large dam operations, Working Paper of the World Commission on Dams, Vlaeberg, Cape Town, South Africa, 4–5, 2001.
Huang, Y. and Huang, Y. L.: Assessment on impact of Xiluodu on sediment deposition in Three Gorges Reservoir, China Three Gorges Construction, 9, 16–19, 2002 (in Chinese with English abstract).
Hu, Y. F., Wu, W. M., and Chen, Z. H.: Reservoir sediment compu-tation of Xiangjiaba hydropower plant, Yangtze River, 34, 36–38, 2003 (in Chinese with English abstract).
Hu, B. Q., Wang, H. J., Yang, Z. S., and Sun, X. X.: Temporal and spatial variations of sediment rating curves in the Changjiang (Yangtze River) basin and their implications, Quatern. Int.,
doi:10.1016/j.quaint.2009.08.018, in press, 2009.
Goodwin, P., Falte, M., and Betts, A. D. K.: Managing for unfore-seen consequences of large dam operations, Working Paper of the World Commission on Dams, Vlaeberg, Cape Town, South Africa, 4–5, 2001.
Kondolf, G. M.: Hungry Water: Effects of Dams and Gravel Mining on River Channels, Environ. Manage., 21, 533–551, 1997. Kummu, M. and Varis, O.: Sediment-related impacts due to
up-stream reservoir trapping, the Lower Mekong River, Geomor-phology, 85, 275–293, 2007.
Liu, F.: Introduction of the planed hydroelectric engineering on the lower Jinshajiang, Construction of Water Resources & Hydro-electric Engineering, 3, 153–155, 2007 (in Chinese).
Lu, J. Y.: Impact of downstream erosion of the Three Gorges Dam on protective bank structures, Yangtze River, 33, 23–25, 2002 (in Chinese with English abstract).
Milliman, J. D. and Meade, R. H.: World-Wide Delivery of River Sediment to the Oceans, J. Geol., 91, 1–21, 1983.
Milliman, J. D. and Syvitski, J. P. M.: Geomorphic/tectonic con-trol of sediment transport to the ocean: the importance of small mountainous rivers, J. Geol., 100, 525–544, 1992.
Milliman, J. D.: Blessed dams or damned dams?, Nature, 386, 325– 327, 1997.
Morris, G. L. and Fan, J.: Reservoir Sedimentation Handbook: De-sign and Management of Dams, Reservoirs, and Watersheds for Sustainable Use, McGraw-Hill Professional, 1998.
Nilsson, C., Reidy, C. A., Dynesius, M., and Revenga, C.: Fragmen-tation and Flow Regulation of the World’s Large River Systems, Science, 308, 405–408, 2005.
Shen, G. Z. and Xie, Z. Q.: Three Gorges Project: Chance and Chal-lenge, Science, 304, 681, doi:10.1126/science.304.5671.681b, 2004.
Snyder, N. P., Rubin, D. M., Alpers, C. N., Childs, J. R., Curtis, J. A., Flint, L. E., and Wright, S. A.: Estimating accumulation rates and physical properties of sediment behind a dam: Englebright Lake, Yuba River, northern California, Water Resour. Res., 40, W11301, doi:10.1029/2004WR003279, 2004.
Syvitski, J. P. M., Vorosmarty, C. J., Kettner, A. J., and Green, P.: Impact of Humans on the Flux of Terrestrial Sediment to the Global Coastal Ocean, Science, 308, 376–380, 2005.
Tang, J. and He, X. P.: Impoundment of the Xiluodu Reservoir and its impact on the lower reaches, Design of Hydroelectric Power Station, 19, 60–63, 2003 (in Chinese with English abstract). UNDES: United Nations Department of Economic and Social
Af-fairs, New York, 2001.
V¨or¨osmarty, C. J., Meybeck, M., Fekete, B., and Sharma, K.: The potential impact of neocastorization on sediment transport by the global network of rivers, in: Human impact on erosion and sed-imentation, edited by: Walling, D. E. and Probst, J. L., IAHS Press, Wallingford, UK, 261–272, 1997.
V¨or¨osmarty, C. J., Meybeck, M., Fekete, B., Sharma, K., Green, P., and Syvitski, J. P. M.: Anthropogenic sediment retention: ma-jor global impact from registered river impoundments, Global Planet. Change, 39, 169–190, 2003.
Walling, D. E.: Human impact on land-ocean sediment transfer by the world’s rivers, Geomorphology, 79, 192–216, 2006. Wang, H. J., Yang, Z. S., Wang, Y., Saito, Y., and Liu, J. P.:
Recon-struction of sediment flux from the Changjiang (Yangtze River) to the sea since the 1860s, J. Hydrol., 349, 31–332, 2008. Wang, J., Zhang, O. Y., and Xiong, M.: The impact of initial
wa-ter impoundment on sediment transport of Three Gorges Reser-voir, Journal of Hydroelectric Engineering, 26, 98–108, 2007a (in Chinese with English abstract).
Wang, Z. Y., Wu, B. S., and Wang, G. Q.: Fluvial processes and morphological response in the Yellow and Weihe Rivers to clo-sure and operation of Sanmenxia Dam, Geomorphology, 91, 65– 79, 2007b.
WCD: Dams and Development: A New Framework for Decision-making, Earthscan, London and Sterling, VA, 2000.
Xie, P., Wu, J. G., Huang, J. H., and Han, X. G.: Three-Gorges Dam: Risk to Ancient Fish, Science, 302, 1149–1151, 2003. Xiong, M., Xu, Q. X., and Yuan, J.: Analysis of multi-factors
af-fecting sediment load in the Three Gorges Reservoir, Quatern. Int., 208 (1–2), 76–84, 2009.
Xu, K. H., Milliman, J. D., Yang, Z. S., and Wang, H. J.: Yangtze Sediment Decline Partly From Three Gorges Dam, Eos Trans. AGU, 87, 185–190, 2006.
Xu, K. H., Milliman, J. D., Yang, Z. S., and Xu, H.: Climatic and Anthropogenic Impacts on Water and Sediment Discharges from the Yangtze River (Changjiang), 1950–2005, in: Large Rivers, edited by: Avijit, G., 609–626, 2007.
Xu, K. H. and Milliman, J. D.: Seasonal variations of sediment discharge from the Yangtze River before and after impoundment of the Three Gorges Dam, Geomorphology, 104, 276–283, 2009. Yang, S. L., Zhao, Q. Y., and Belkin, I. M.: Temporal variation in the sediment load of the Yangtze river and the influences of human activities, J. Hydrol., 263, 56–71, 2002.
Yang, S. L., Belkin, I. M., Belkina, A. I., Zhao, Q. Y., Zhu, J., and Ding, P. X.: Delta response to decline in sediment supply from the Yangtze River: evidence of the recent four decades and expectations for the next half-century, Estuar. Coast Shelf Sci., 57, 689–699, 2003.
Yang, S. L., Zhang, J., Zhu, J., Smith, J. P., Dai, S. B., Gao, A., and Li, P.: Impact of dams on Yangtze River sediment supply to the sea and delta intertidal wetland response, J. Geophys. Res., 110, F03006, doi:10.1029/2004jf000271, 2005.
Yang, S. L., Li, M., Dai, S. B., Liu, Z., Zhang, J., and Ding, P. X.: Drastic decrease in sediment supply from the Yangtze River and its challenge to coastal wetland management, Geophys. Res. Lett., 33, L06408, doi:10.1029/2005gl025507, 2006a.
Yang, S. L., Zhang, J., Dai, S. B., Li, M., and Xu, X. J.: Effect of deposition and erosion within the main river channel and large lakes on sediment delivery to the estuary of the Yangtze River, J. Geophys. Res., 112, F02005, doi:10.1029/2006jf000484, 2007a. Yang, S. L., Zhang, J., and Xu, X. J.: Influence of the Three Gorges Dam on downstream delivery of sediment and its environmental implications, Yangtze River, Geophys. Res. Lett., 34, L10401, doi:10.1029/2007gl029472, 2007b.
Yang, Z. S., Wang, H. J., Saito, Y., Milliman, J. D., Xu, K. H., Qiao, S. Q., and Shi, G. Y.: Dam impacts on the Changjiang (Yangtze) River sediment discharge to the sea: The past 55 years and af-ter the Three Gorges Dam, Waaf-ter Resour. Res., 42, W04407, doi:10.1029/2005wr003970, 2006b.
Zhao, C. H., Zhu, Z. H., and Zhou, D. Z.: Worldwide Rivers and Dams, China Water Conservancy and Hydroelectr. Press, Bei-jing, 1059 pp., 2000 (in Chinese).