Completion of a Programmable DNA-Binding Small Molecule Library
Thesis by Carey Frank Hsu
In Partial Fulfillment of the Requirements for the Degree of
Doctor of Philosophy
California Institute of Technology Pasadena, California
2009
ii
iii
iv
Acknowledgements
I would like to thank my research advisor, Professor Peter Dervan, from whom I have learned so much about research and life. Thank you for giving me the opportunity to work with you. In particular, I treasured the time that I spent as your teaching assistant, learning how to be a teacher. I would also like to thank the members of my thesis committee, Professor Linda Hsieh-Wilson, Professor Stephen Mayo, and Professor Brian Stoltz, for their support.
The Dervan group is a wonderful environment for research. Above all, the people make it a very special place. I would like to acknowledge my collaborators, John Phillips, James Puckett, Daniel Harki, Nicholas Nickols, and Michael Marques, who made this work possible. I would like to thank James Puckett, Ryan Stafford, and Justin Cohen, for their friendship.
I would like to acknowledge the members of the Dervan group: graduate students Timothy Best, Michael Brochu, David Chenoweth, Raymond Doss, Benjamin Edelson, Michelle Farkas, Eric Fechter, Claire Jacobs, Benjamin Li, David Montgomery, Katy Muzikar, Julie Poposki, Adam Poulin-Kerstien, James Sanchez, Sherry Tsai, and Fei Yang; and postdoctoral scholars Hans-Dieter Arndt, Christian Dose, Mareike Goeritz, Bogdan Olenyuk, and Anne Viger.
v
Abstract
Hairpin pyrrole-imidazole (Py-Im) polyamides are programmable oligomers that bind the DNA minor groove in a sequence-specific manner with affinities comparable to those of natural DNA-binding proteins. These cell-permeable small molecules have been shown to enter the nuclei of live cells and downregulate endogenous gene expression. We complete here a library of 27 hairpin Py-Im polyamides that bind 7-base-pair sequences of the general form 5’-WWGNNNW-3’ (where W = A or T, N = W, G, or C). A table of binding affinities and sequence contexts for this completed 27-member library has been assembled for the benefit of the chemical biology community interested in molecular control of transcription. Quantitative fluorescence-based methods have been developed to determine the nuclear concentration of polyamide-fluorescein conjugates in cell culture. Confocal laser scanning microscopy and flow cytometry techniques are utilized to plot calibration curves, from which the nuclear concentration can be interpolated. Although confocal microscopy and flow cytometry generate disparate values, taken together these experiments suggest that the polyamide concentration inside the cell nucleus is lower than it is outside the cell. To further our understanding of C-terminal tail linkage effects on sequence specificity, the equilibrium association constants of hairpin polyamide conjugates were measured by quantitative DNase I footprint titration experiments. These results indicate that linkers and functional R groups on the tails of hairpin polyamide conjugates have recognition properties that should be considered in the design of these molecules to target DNA binding sites. Furthermore, these β-alanine-C3-linked polyamide conjugates are shown to
vi
Table of Contents
Page
Acknowledgements………...…. iv
Abstract……… v
Table of Contents……… vi
List of Figures and Tables………. vii
Chapter 1 Introduction………... 1
Chapter 2 Completion of a Programmable DNA-Binding Small Molecule Library………. 15
Chapter 3 Quantitating the Concentration of Py-Im Polyamide-Fluorescein Conjugates in Live Cells……… 38
Chapter 4A Effects of Tail Linkages on the Sequence-Specific Recognition of DNA by Hairpin Polyamide Conjugates………... 59
Chapter 4B Inhibition of VEGF with β-Alanine-C3-Linked Hairpin Polyamide Conjugates………... 81
Chapter 5 Disrupting the Oct4 Octamer DNA Element with Pyrrole-Imidazole Polyamide Conjugates………... 98
vii
List of Figures and Tables
Page Chapter 1
Figure 1.1 The structure of DNA……….. 2
Figure 1.2 Structures of distamycin A bound to DNA as 1:1 and 2:1 complexes…… 4
Figure 1.3 Molecular recognition of the minor groove of DNA………... 5
Figure 1.4 Structure of ImHpPyPy-β-Dp bound to DNA as a 2:1 complex…………. 6
Figure 1.5 Binding model for hairpin polyamides……… 8
Figure 1.6 Synthesis of polyamides on solid support……….. 9
Figure 1.7 Nuclear localization of polyamide-fluorophore conjugates……….. 10
Chapter 2 Figure 2.1 Model for the complex formed between hairpin polyamide 24 and its match DNA sequence……… 19
Figure 2.2 Plasmid design (pCFH2, pCFH3, pCFH4, pCFH5, pPh2, and pMFST)... 21
Figure 2.3 DNase I footprint titrations (13, 14, 16, 17, 19, 21, 24, and 27)………... 22
Table 2.1 Equilibrium association constants………. 24
Table 2.2 Equilibrium association constants………. 25
Table 2.3 Equilibrium association constants………. 27
viii
Chapter 3
Figure 3.1 Structures of polyamide-fluorescein conjugates 1 and 2………... 42
Figure 3.2 DNase I footprint titration experiments for polyamides 1 and 2………... 43
Figure 3.3 Overlaid fluorescence emission spectra for polyamides 1 and 2………... 44
Figure 3.4 Sample calibration curve for confocal microscopy……….. 46 Figure 3.5 Confocal laser scanning microscopy images of calibration standards... 46 Table 3.1 Calculated nuclear concentration from confocal microscopy…………... 47 Figure 3.6 Sample calibration curve for flow cytometry……… 49 Table 3.2 Calculated cellular concentration from flow cytometry……… 50
Chapter 4A
Figure 4.1 Structures of polyamide conjugates 1-10……….. 63
Figure 4.2 Designed binding sites on plasmids pCFH6 and pJWP6……….. 69 Figure 4.3 Quantitative DNase I footprint titration experiments for polyamide
conjugates 1, 2, and 5 on plasmid pCFH6………... 70
Table 4.1 Equilibrium association constants on plasmid pCFH6………... 71 Figure 4.4 Quantitative DNase I footprint titration experiments for polyamide
conjugates 1, 2, and 5 on plasmid pJWP6………... 73
ix
Chapter 4B
Figure 4.5 Structures of polyamide conjugates 1-13………... 84
Figure 4.6 DNase I footprint titration experiments for polyamides 2 and 5……... 90
Table 4.4 Equilibrium association constants for polyamides 2-8………... 91
Figure 4.7 Nuclear localization of polyamides 2, 3, and 7 in HeLa cells………….. 92
Figure 4.8 Relative levels of VEGF mRNA in HeLa cells at 1 μM polyamide…... 93
Figure 4.9 Relative levels of VEGF mRNA in HeLa cells at 0.2 and 1 μM……….. 94
Chapter 5
Figure 5.1 Crystal structure of a POU/HMG/DNA ternary complex………... 101 Figure 5.2 Binding model for the hairpin polyamide bound to its target
DNA sequence within the enhancer regions of Oct4 target genes…….. 103 Figure 5.3 Structures of polyamide conjugates 1-7……….. 105
Figure 5.4 Quantitative DNase I footprint titrations for polyamide 1…...………... 107
Figure 5.5 DNA melting temperature analysis for polyamides 1-5………...……... 108
Figure 5.6 Nuclear localization of polyamide-fluorescein conjugate 1………….... 109
Figure 5.7 Time course for 48-hour incubation experiments with P19 cells…….... 110 Figure 5.8 Quantitative RT-PCR experiments with polyamides 2 and 6…………. 111
Figure 5.9 Quantitative RT-PCR experiments with polyamides 2-5……….... 112
Figure 5.10 Quantitative RT-PCR experiments with polyamides 4 and 7………….. 113
Figure 5.11 Structures of polyamide conjugates 8-14……….... 115
Figure 5.12 Time course for 48-hour and 72-hour incubation experiments
x
Figure 5.13 Quantitative RT-PCR experiments with polyamides 4 and 7………….. 117
Figure 5.14 Quantitative RT-PCR experiments with polyamide 4………. 118
Figure 5.15 Images of R1 mouse embryonic stem cells after 24-hour treatment……120 Figure 5.16 Images of R1 mouse embryonic stem cells after 48-hour treatment……121 Figure 5.17 Images of R1 mouse embryonic stem cells after 72-hour treatment……122 Figure 5.18 The partial sequence of plasmid phOCT4-EGFP1……….. 124
Appendix
Figure A.1 Structure of the pyrrole-fluorobenzimidazole dimer 2……….... 141
Figure A.2 Structure of the key synthetic target fluorodiamine 4... 141
Chapter 1
1.1. Deoxyribonucleic acid (DNA)
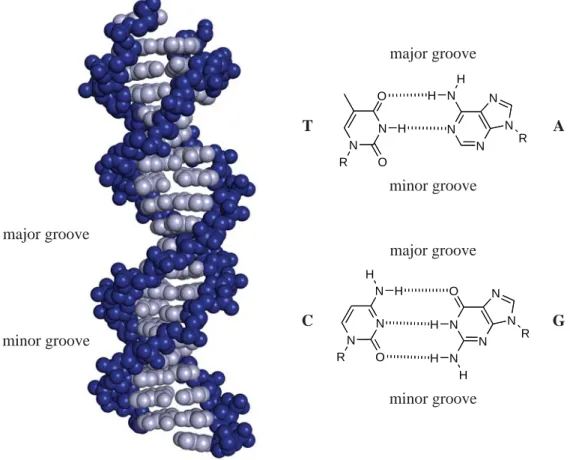
DNA is the biological macromolecule that encodes the genetic information necessary for life. The molecule consists of four different bases on a phosphodiester-linked deoxyribose sugar backbone. The intertwined strands of two DNA molecules form a double helix with hydrogen bonds between the Watson-Crick base pairs such that thymine (T) pairs with adenine (A), and cytosine (C) pairs with guanine (G). The structure of B-form DNA is a right-handed helix containing ten base pairs per turn, and the plane of each hydrogen-bonded base pair lies perpendicular to the helix axis.1,2 A wide major groove and a narrow minor groove line the helix and are available for binding (Figure 1.1).2 The human genome contains roughly three billion base pairs that encode 20,000
Figure 1.1. The structure of DNA. (left) The phosphodiester-linked deoxyribose backbone
is shown in blue, and the Watson-Crick base pairs are shown in gray (PDB accession code: 1YSA5). (right) The chemical structures of the DNA bases thymine (T), adenine (A), cytosine (C), and guanine (G) are shown as hydrogen-bonded base pairs.40
N N
N N N
N N
O
O
R H
H
H
R
N N
N N O
N N
N N
O
R R
H H
H
H H
T A
C G
major groove
minor groove
major groove
minor groove major groove
to 25,000 protein-coding genes.3 In addition to DNA sequences that code for proteins, genes are associated with regulatory regions that control transcription. In the context of the living cell, DNA-binding proteins and the interactions between proteins modulate gene expression.4,5
1.2. DNA-binding small molecules
Nature has evolved a number of small molecules, including actinomycin, echinomycin, and calicheamicin, that bind to specifi c sequences of DNA. Distamycin A and netropsin are A,T-binding oligopeptidic antibiotic drugs of bacterial origin whose structures contain three and two N-methylpyrrole (Py) carboxamide units, respectively.6-9 The X-ray crystal structure of the 1:1 complex between netropsin and 5’-CGCGAATT
CGCG-3’ shows that the crescent-shaped natural product binds in the minor groove of B-form DNA by displacing water molecules on the spine of hydration.10,11 The NMR structure of the 2:1 complex between distamycin and 5’-CGCAAATTGGC-3’ indicates that the two
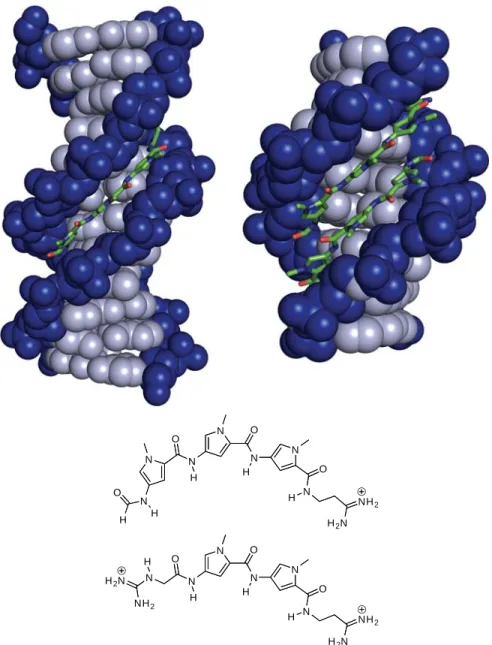
distamycin molecules bind the central 5’-AAATT-3’ region in an antiparallel orientation with expansion of the minor groove relative to the 1:1 ligand-DNA complex.12 The structures of the 1:1 and 2:1 distamycin-DNA complexes are depicted in Figure 1.2.13,14
1.3. Recognition of the DNA minor groove by pyrrole-imidazole polyamides
N O
N H
N
O
N
H NH
2
H2N
N
H O
N
N H O
H
N O
N H
N
N O
H
H2N
NH2
N
H O
N H
NH2
H2N
Figure 1.2. Structures of distamycin A bound to DNA as 1:1 and 2:1 complexes (PDB
accession codes: 2DND13 and 378D14). The DNA backbone is shown in blue, the base pairs are gray, and distamycin is shown in stick representation. The chemical structures of distamycin A (top) and netropsin (bottom) are shown below the crystal structures.40
Figure 1.3. Molecular recognition of the minor groove of DNA. (top) Minor groove
hydrogen bonding patterns of Watson-Crick base pairs. Circles with dots represent lone pairs of N(3) of purines and O(2) of pyrimidines, and circles containing an H represent the 2-amino group of guanine. The R group represents the sugar-phosphate backbone of DNA. Electron pairs projecting into the minor groove are represented as shaded orbitals. (bottom) Binding model for the complex formed between ImHpPyPy-γ-ImHpPyPy-β-Dp and a 5’-AGTACT-3’ sequence. Putative hydrogen bonds are shown as dashed lines.16
N N N N O N N N N O R R H H H H H N N N N O N N N N O R R H H H H H
G C C G
N N N N N N N O O R H H H R N N N N N N N O O R H H H R H H
A T T A
T C A T G A 5’ 3’ H H A G T A C T N N O N H N
O N H
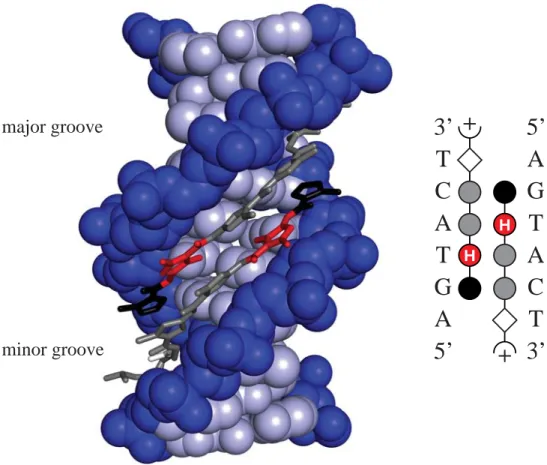
across from Py to recognize T•A over A•T.20-22 The X-ray crystal structure of the 2:1 complex between ImHpPyPy and 5’-CCAGTACTGG-3’ provides structural verifi cation
of the pairing rules (Figure 1.4).
3’
T
C
A
T
G
A
5’
5’
A
G
T
A
C
T
3’
+
+
major groove
minor groove
H H
Figure 1.4. Crystal structure of the 2:1 complex formed between ImHpPyPy-β-Dp and the
1.4. Hairpin polyamide motif
The pre-organization of two polyamide subunits by a covalent linkage improves the binding affi nity and sequence specifi city of these ligands.23-26 While several different binding motifs have been explored, the hairpin motif provides excellent affi nity and specifi city for DNA and can be accessed through a facile synthetic route.23 In the hairpin motif, a γ-aminobutyric acid (γ) covalently links the carboxylic terminus of one polyamide with the amino terminus of the other. Eight-ring hairpin polyamides bind their six base-pair DNA match sequences with subnanomolar affi nities.27,28
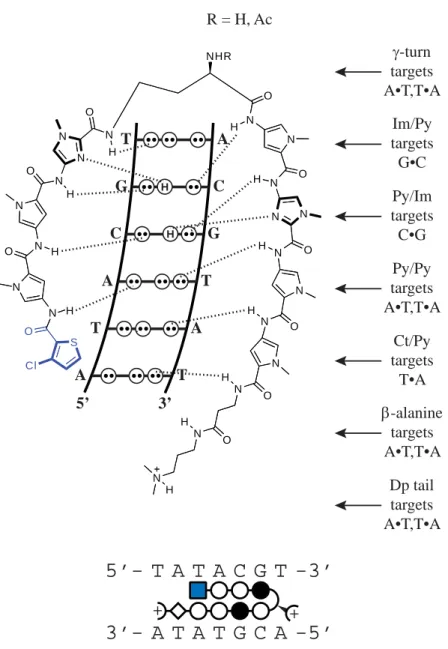
Structural features of the hairpin motif contribute to sequence-specifi c DNA recognition (Figure 1.5). The γ residue that forms the turn of the hairpin recognizes A•T and T•A base pairs. A chiral 2,4-diaminobutyric acid improves affi nity while retaining specifi city for A•T and T•A.29 The increased binding affi nity can be attributed to electrostatic interactions between the negatively charged DNA backbone and the positively charged free amine on the turn. Furthermore, the chiral turn allows stereochemical control, enforcing the N→C polyamide alignment with respect to the 5’→3’ orientation of the adjacent DNA strand.29,30
T G C A T A 5’ 3’ H A C G T A T Im/Py targets G•C Py/Im targets C•G β-alanine targets A•T,T•A Dp tail targets A•T,T•A γ-turn targets A•T,T•A Py/Py targets A•T,T•A Ct/Py targets T•A S O N H N
O N H
N N O H N N N O H Cl N N O H N N N O H N N O H N N H O N O H O N N H H NHR H
R = H, Ac
+ +
5’- T A T A C G T -3’
3’- A T A T G C A -5’
Figure 1.5. Binding model for the complex formed between CtPyPyIm-(R)RHNγ
-PyImPyPy-β-Dp and a 5’-TATACGT-3’ sequence. A ball-and-stick model is shown at bottom, where a blue square represents Ct, a black circle represents Im, a white circle represents Py, a white diamond represents β-alanine, a half circle with a plus represents Dp, and the chiral 2,4-diaminobutyric acid turn residue is shown as a semicircle connecting the two subunits with a solid wedge linking a half-circle with a plus.
S Cl
N H
O N N
H O N O N H N N NH O H N O NHZ N H N O N N O H N N O H N N R O N O N H O O O N H
H2NR1 H2NR1
N H O
R1HN R1HN
Polyamide core
Solid support
C-terminus
β-Ala-PAM resin Kaiser oxime resin
R = R =
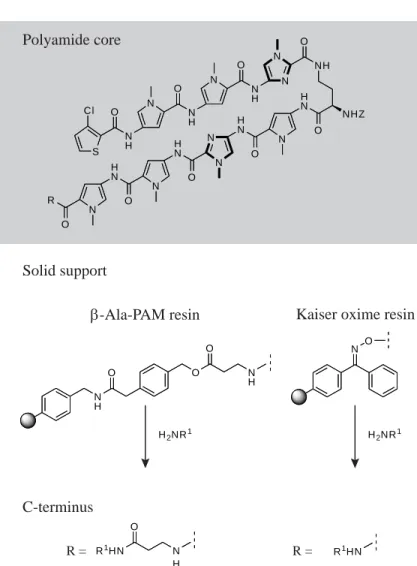
Figure 1.6. Synthesis of polyamides on solid support. β-Ala-PAM resin and Kaiser oxime
resin yield different C-terminal groups following cleavage with a primary amine. Z = H, Ac, or Boc, if further derivatization is required.16
amine (Figure 1.6). The use of β-Ala-PAM resin leaves a residual A,T-specifi c β-alanine moiety at the C-terminus, while oxime resin produces a shorter polyamide. Access to a diverse range of polyamide binding motifs and linkers has proven valuable for experiments in cell culture.
1.5. Nuclear localization of hairpin polyamide conjugates in cell culture studies
Confocal microscopy has been used to determine the uptake profi les of
polyamide-fl uorophore conjugates in a range of cell lines.37-40 A brief excerpt is presented in Figure 1.7. Polyamide 1 localizes to the nucleus, while polyamide 2 is excluded from the nucleus,
polyamide 3 rescues uptake, suggesting that the incorporation of β-alanine may be lethal for
uptake. The poor nuclear localization of polyamide 4 indicates that fl uorophore selection
is crucial.41 Based on these results, fl uorescein has been the fl uorescent dye of choice in recent experiments.
The gained insights into cellular uptake properties of polyamides have proven instrumental in the successful design of gene regulation studies. A polyamide-fl uorescein conjugate has been shown to decrease hypoxia-inducible transcription of vascular endothelial growth factor (VEGF) in cultured HeLa cells.42,43 The binding of this polyamide to the hypoxia response element (HRE) disrupts the binding of hypoxia-inducible factor to the HRE. Inhibition of VEGF expression has been used to assay the nuclear localization of HRE-targeted polyamides. These studies have shown that the fl uorescein dye can be minimized to a isophthalic acid moiety, yielding higher-affi nity conjugates that exhibit comparable biological activity.44 A hairpin polyamide-isophthalic acid conjugate has been shown to downregulate prostate-specifi c antigen (PSA) expression in prostate cancer cells by binding the androgen response element in the PSA promoter.45 This prevents the binding of androgen receptor (AR) and inhibits androgen-induced PSA expression.
Figure 1.7. Uptake profi le of polyamide-fl uorophore conjugates 1-4 in 13 cell lines.38 ++
indicates that nuclear staining exceeds that of the medium; +, nuclear staining less than or equal to that of the medium, but still prominent; –, very little nuclear staining, with the most fl uorescence seen in the cytoplasm and/or medium; – –, no nuclear staining.38,39 In the ball-and-stick model, a black circle represents Im, a white circle represents Py, a white diamond represents β-alanine, “(+)” represents the 3,3’-diamino-N-methyldipropylamine linker, and a half-circle represents the γ-aminobutyric acid turn residue.
(+)
FITC FITC(+)
(+)
Bodipy FL FITC(+)
DLD-1 HeLa MCF-7 SK-BR-3
293 NB4
786-O LN- PC3 Jurkat
CaP
MEL
CCRF-CEM
MEG-01
+ + + + + + + + + + + + + + + + + + + + + + + + + – – – – – – – – – – – – – – – – – – – – – – – – –
– – – – – – – – – – – – – – – – –
+ + + + + + + + + + + + + + + + + + + + + +
1
2
3
1.6. Scope of this work
In Chapter 2, we complete a library of 27 hairpin Py-Im polyamides that bind 7-base-pair sequences of the general form 5’-WWGNNNW-3’ (where W = A or T, N = W, G, or C). A table of binding affi nities and sequence contexts for this completed 27-member library has been assembled for the benefi t of the chemical biology community interested in molecular control of transcription. In Chapter 3, quantitative fl uorescence-based methods have been developed to determine the nuclear concentration of
References
1. Wing, R.; Drew, H.; Takano, T.; Broka, C.; Tanaka, S.; Itakura, K.; Dickerson, R. E., Nature 1980, 287, 755-758.
2. Dickerson, R. E.; Drew, H. R.; Conner, B. N.; Wing, R. M.; Fratini, A. V.; Kopka, M. L., Science 1982, 216, 475-485.
3. Collins, F. S.; Lander, E. S.; Rogers, J.; Waterston, R. H., Nature 2004, 431, 931-945.
4. Pabo, C. O.; Sauer, R. T., Annu. Rev. Biochem. 1984, 53, 293-321.
5. Ellenberger, T. E.; Brandl, C. J.; Struhl, K.; Harrison, S. C., Cell 1992, 71, 1223-1237.
6. Arcamone, F.; Nicolell.V; Penco, S.; Orezzi, P.; Pirelli, A., Nature 1964, 203, 1064-&.
7. Finlay, A. C.; Hochstein, F. A.; Sobin, B. A.; Murphy, F. X., J. Am. Chem. Soc.
1951, 73, 341-343.
8. Vantamelen, E. E.; White, D. M.; Kogon, I. C.; Powell, A. D. G., J. Am. Chem. Soc. 1956, 78, 2157-2159.
9. Waller, C. W.; Wolf, C. F.; Stein, W. J.; Hutchings, B. L., J. Am. Chem. Soc. 1957, 79, 1265-1266.
10. Kopka, M. L.; Yoon, C.; Goodsell, D.; Pjura, P.; Dickerson, R. E., Proc. Natl. Acad. Sci. U. S. A. 1985, 82, 1376-1380.
11. Kopka, M. L.; Yoon, C.; Goodsell, D.; Pjura, P.; Dickerson, R. E., J. Mol. Biol.
1985, 183, 553-563.
12. Pelton, J. G.; Wemmer, D. E., Proc. Natl. Acad. Sci. U. S. A. 1989, 86, 5723-5727.
13. Coll, M.; Frederick, C. A.; Wang, A. H. J.; Rich, A., Proc. Natl. Acad. Sci. U. S. A.
1987, 84, 8385-8389.
14. Mitra, S. N.; Wahl, M. C.; Sundaralingam, M., Acta Crystallogr. Sect. D-Biol. Crystallogr. 1999, 55, 602-609.
16. Dervan, P. B.; Edelson, B. S., Curr. Opin. Struct. Biol. 2003, 13, 284-299.
17. Wade, W. S.; Mrksich, M.; Dervan, P. B., J. Am. Chem. Soc. 1992, 114, 8783-8794.
18. Mrksich, M.; Wade, W. S.; Dwyer, T. J.; Geierstanger, B. H.; Wemmer, D. E.; Dervan, P. B., Proc. Natl. Acad. Sci. U. S. A. 1992, 89, 7586-7590.
19. Kielkopf, C. L.; Baird, E. E.; Dervan, P. D.; Rees, D. C., Nat. Struct. Biol. 1998, 5, 104-109.
20. White, S.; Szewczyk, J. W.; Turner, J. M.; Baird, E. E.; Dervan, P. B., Nature
1998, 391, 468-471.
21. Kielkopf, C. L.; White, S.; Szewczyk, J. W.; Turner, J. M.; Baird, E. E.; Dervan, P. B.; Rees, D. C., Science 1998, 282, 111-115.
22. Kielkopf, C. L.; Bremer, R. E.; White, S.; Szewczyk, J. W.; Turner, J. M.; Baird, E. E.; Dervan, P. B.; Rees, D. C., J. Mol. Biol. 2000, 295, 557-567.
23. Mrksich, M.; Parks, M. E.; Dervan, P. B., J. Am. Chem. Soc. 1994, 116, 7983-7988.
24. Greenberg, W. A.; Baird, E. E.; Dervan, P. B., Chem.-Eur. J. 1998, 4, 796-805.
25. Melander, C.; Herman, D. M.; Dervan, P. B., Chem.-Eur. J. 2000, 6, 4487-4497.
26. Heckel, A.; Dervan, P. B., Chem.-Eur. J. 2003, 9, 3353-3366.
27. Trauger, J. W.; Baird, E. E.; Dervan, P. B., Nature 1996, 382, 559-561.
28. Trauger, J. W.; Dervan, P. B., Methods in Enzymology 2001, 340, 450-466.
29. Herman, D. M.; Baird, E. E.; Dervan, P. B., J. Am. Chem. Soc. 1998, 120, 1382-1391.
30. White, S.; Baird, E. E.; Dervan, P. B., J. Am. Chem. Soc. 1997, 119, 8756-8765.
31. Turner, J. M.; Swalley, S. E.; Baird, E. E.; Dervan, P. B., J. Am. Chem. Soc. 1998, 120, 6219-6226.
33. Swalley, S. E.; Baird, E. E.; Dervan, P. B., J. Am. Chem. Soc. 1999, 121, 1113-1120.
34. Foister, S.; Marques, M. A.; Doss, R. M.; Dervan, P. B., Bioorg. Med. Chem.
2003, 11, 4333-4340.
35. Baird, E. E.; Dervan, P. B., J. Am. Chem. Soc. 1996, 118, 6141-6146.
36. Belitsky, J. M.; Nguyen, D. H.; Wurtz, N. R.; Dervan, P. B., Bioorg. Med. Chem.
2002, 10, 2767-2774.
37. Belitsky, J. M.; Leslie, S. J.; Arora, P. S.; Beerman, T. A.; Dervan, P. B., Bioorg. Med. Chem. 2002, 10, 3313-3318.
38. Best, T. P.; Edelson, B. S.; Nickols, N. G.; Dervan, P. B., Proc. Natl. Acad. Sci. U. S. A. 2003, 100, 12063-12068.
39. Edelson, B. S.; Best, T. P.; Olenyuk, B.; Nickols, N. G.; Doss, R. M.; Foister, S.; Heckel, A.; Dervan, P. B., Nucleic Acids Res. 2004, 32, 2802-2818.
40. Stafford, R. L. Ph.D. Thesis, California Institute of Technology, Pasadena, CA, 2008.
41. Crowley, K. S.; Phillion, D. P.; Woodard, S. S.; Schweitzer, B. A.; Singh, M.; Shabany, H.; Burnette, B.; Hippenmeyer, P.; Heitmeier, M.; Bashkin, J. K., Bioorg. Med. Chem. Lett. 2003, 13, 1565-1570.
42. Olenyuk, B. Z.; Zhang, G. J.; Klco, J. M.; Nickols, N. G.; Kaelin, W. G.; Dervan, P. B., Proc. Natl. Acad. Sci. U. S. A. 2004, 101, 16768-16773.
43. Nickols, N. G.; Jacobs, C. S.; Farkas, M. E.; Dervan, P. B., ACS Chem. Biol.
2007, 2, 561-571.
44. Nickols, N. G.; Jacobs, C. S.; Farkas, M. E.; Dervan, P. B., Nucleic Acids Res.
2007, 35, 363-370.
Chapter 2
Completion of a Programmable
DNA-Binding Small Molecule Library
The text of this chapter was taken in part from a manuscript co-authored with John W. Phillips, John W. Trauger, Michelle E. Farkas, Jason M. Belitsky, Alexander Heckel, Bogdan Z. Olenyuk, James W. Puckett, Clay C. C. Wang, and Peter B. Dervan (Caltech).
(Hsu, C. F., Phillips, J. W., Trauger, J. W., Farkas, M. E., Belitsky, J. M., Heckel, A., Olenyuk, B. Z., Puckett, J. W., Wang, C. C. C., Dervan, P. B. (2007) Tetrahedron63,
Abstract
2.1. Introduction
The biological applications of sequence-specifi c DNA-binding small molecules are a subject of intense research but are still far from being routine.1-11 Py-Im polyamides have been shown to infl uence a number of protein-DNA interactions, demonstrating both repression and activation of gene expression. Confocal microscopy experiments have confi rmed that polyamide-fl uorophore conjugates traffi c unaided to the nuclei of living cells.12-14 Since many diseases are attributed to aberrant gene expression, the regulation of transcriptional pathways with small molecules could have an important effect on human medicine.15-17 For researchers interested in selectively targeting protein-DNA interfaces in promoters of specifi c genes with small molecules, access to well-characterized libraries of polyamides which bind a repertoire of different sequences with high affi nity and specifi city could enable development in this area.
Within the framework of the pairing rules, covalent linkages between two antiparallel polyamide strands result in several possible structures, including the hairpin, cycle, H-pin, and U-pin binding motifs.27-30 These linked structures show improved affi nity and specifi city when compared with the unlinked dimers. The eight-ring hairpin polyamide provides a good compromise between synthetic ease (linear vs. branched oligomers) and molecular recognition properties. In this binding motif, a γ-aminobutyric acid residue connects the carboxylic terminus of one strand to the amino terminus of the other.27 The turn residue also serves as a DNA recognition element, as it has been shown to bind A•T and T•A base pairs with greater than 25-fold specifi city over C•G and G•C, presumably for steric reasons.31 Use of a chiral diaminobutyric acid turn residue increases the overall binding affi nity of the molecule by 10-fold without a loss of sequence specifi city.32
When hairpin polyamides are synthesized using solid phase methods on Boc-β-Ala-PAM resin and cleaved with 3-dimethylamino-1-propylamine, the product contains a β-alanine residue and a dimethylaminopropylamide tail at the C-terminus. Both of these
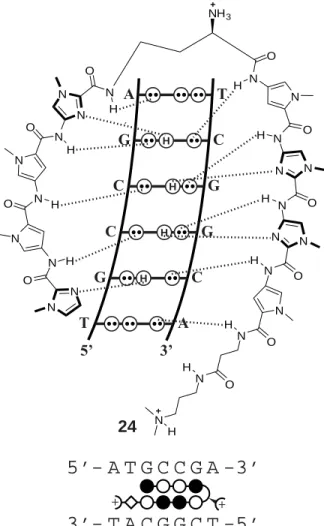
elements are specifi c for W (where W = A or T) over G•C and C•G, again for steric reasons. In the hairpin motif, the β-alanine residue exhibits greater than 210-fold specifi city for A•T and T•A base pairs over G•C and C•G.31 The dimethylaminopropylamide tail shows a 20-fold preference for A•T and T•A over G•C and C•G.31 Therefore, an eight-ring hairpin polyamide can bind seven base pairs with specifi city for W over the turn, β-alanine residue, and tail (Figure 2.1).
5’-WWGNNNW-A G C C G T 5’ 3’ H H H H + +
5’- A T G C C G A -3’
3’- T A C G G C T -5’
T C G G C A N N O N H N
O N H
N N O H N N N O H N N O H N N N O H N N N O H N N H O N O H O N N H H NH3 24
3’ (where N = W, G, or C). There are 27 possible permutations that fall within these guidelines. Our group has published the energetics of 11 hairpin polyamides binding 11 distinct cognate sequences. Over half of the 27 sequences remain unreported. Searching our theses and notebooks confi rmed 7 additional previously unpublished characterizations. Our studies during the past decade left only 9 out of 27 sequences unexamined; these are: WWGCGWW-3’, WWGCCWW-3’, WWGCWCW-3’, WWGCCCW-3’,
5’-Figure 2.1. (Top) Model for the complex formed between hairpin polyamide 24 and its
WWGWCGW-3’, WWGWGCW-3’, WWGCGGW-3’, WWGCCGW-3’, and 5’-WWGWGGW-3’. To complete the library, we have synthesized nine hairpin polyamides designed to target these remaining sequences and assayed their binding affi nity and sequence specifi city by DNase I footprint titration experiments. In this study, we complete the table of polyamide-DNA binding affi nities, indicating each of the 27 general DNA sequences and an eight-ring hairpin polyamide that sequence specifi cally binds that 7-bp site. We hope that this centralized source of previously unpublished data proves helpful for other research groups currently modulating protein-DNA interfaces with DNA-binding small molecules.
2.2. Results
2.2.1. Polyamide synthesis. Nine polyamides 12, 13, 14, 16, 17, 19, 21, 24, and 27 were synthesized on Boc-β-Ala-PAM resin according to published manual solid-phase
synthesis protocols.34 After cleavage with 3-dimethylamino-1-propylamine and reverse-phase HPLC purifi cation, polyamides were characterized by analytical HPLC, UV-visible spectroscopy, and matrix-assisted laser desorption ionization/time-of-fl ight mass spectrometry.
2.2.2. DNA binding energetics. Quantitative DNase I footprint titration
pCFH2
5’-TGGATGCTGGTTATGCATATGGATGCTGGTTATGCCTATGGATGCTGGTTATGCGTATGGATGCTGGTTATGCTTATGGATGCTAA-3’ 3’-ACCTACGACCAATACGTATACCTACGACCAATACGGATACCTACGACCAATACGCATACCTACGACCAATACGAATACCTACGATT-5’
+ +17
+ +14 + +19
pCFH3
5’-TGGATGCTGGTTATGCACATGGATGCTGGTTATGCCCATGGATGCTGGTTATGCGCATGGATGCTGGTTATGCTCATGGATGCTAA-3’ 3’-ACCTACGACCAATACGTGTACCTACGACCAATACGGGTACCTACGACCAATACGCGTACCTACGACCAATACGAGTACCTACGATT-5’
+ +16 + +16
pPh2
5’-TGGATGCTGGTTATGCAGTTGGATGCTGGTTATGCCGTTGGATGCTGGTTATGCGGTTGGATGCTGGTTATGCTGTTGGATGCTAA-3’ 3’-ACCTACGACCAATACGTCAACCTACGACCAATACGGCAACCTACGACCAATACGCCAACCTACGACCAATACGACAACCTACGATT-5’
+ +24 + +21
pCFH4
5’-TGGATGCTGGTTATGAAGTTGGATGCTGGTTATGACGTTGGATGCTGGTTATGAGGTTGGATGCTGGTTATGATGTTGGATGCTAA-3’ 3’-ACCTACGACCAATACTTCAACCTACGACCAATACTGCAACCTACGACCAATACTCCAACCTACGACCAATACTACAACCTACGATT-5’
32P EcoRI PvuII
A•T C•G G•C T•A
+ +13
pCFH5
5’-TGGATGCTGGTTATGAACTTGGATGCTGGTTATGACCTTGGATGCTGGTTATGAGCTTGGATGCTGGTTATGATCTTGGATGCTAA-3’ 3’-ACCTACGACCAATACTTGAACCTACGACCAATACTGGAACCTACGACCAATACTCGAACCTACGACCAATACTAGAACCTACGATT-5’
+ +27
pMFST
5’-TACAATCATTAGTGGTTACAATCATATGGTCATACAATCATTAGTCGTTACAATCATTAGCACACACAATCAT-3’ 3’-ATGTTAGTAATCACCAATGTTAGTATACCAGTATGTTAGTAATCAGCAATGTTAGTAATCGTGTGTGTTAGTA-5’
+ +12
at a given DNA binding site. Comparing these constants across the four potential binding sites allows a relative measure of specifi city for each base pair at the targeted position.
The nine polyamides 12, 13, 14, 16, 17, 19, 21, 24 and 27 bind their respective 7-bp
match sites with equilibrium association constants that range from Ka = 7×10⁸ M-1 to 4×10¹⁰ M-1 (Table 2.1 and Figure 2.3). The sequence specifi cities (K
match/Ksingle bp mismatch) for these
compounds vary from 4-fold to greater than 100-fold, further validating the pairing rules.
Figure 2.2. Plasmid design for pCFH2, pCFH3, pCFH4, pCFH5, pPh2, and pMFST,
indicating the designed match and mismatch sites for hairpin polyamides 12, 13, 14, 16, 17, 19, 21, 24, and 27. Imidazole and pyrrole are shown as fi lled and non-fi lled circles,
5’-ATGCXTA-3’
3’-TACG14 + YAT-5’+ 19 + + 5’-ATGCXTA-3’
3’-TACGYAT-5’ X•Y = A•T, C•G, G•C, T•A X•Y = A•T, C•G, G•C, T•A
T•A
G•C
C•G
A•T
1 2 3 4 5 6 7 8 9 10 11 12 13 14 15Intact G A DNase I
10 pM 1 μ M G•C C•G T•A -0.2 0 0.2 0.4 0.6 0.8 1 1.2 10-12 10-11 10-10 10-9 10-8 10-7 10-6 10-5 θap p [polyamide] T•A G•C C•G A•T
1 2 3 4 5 6 7 8 9 10 11 12 13 14 15Intact G A DNase I
10 pM 1 μ M -0.2 0 0.2 0.4 0.6 0.8 1 1.2 10-12 10-11 10-10 10-9 10-8 10-7 10-6 Θ [polyamide] G•C C•G T•A A•T X•Y X•Y pCFH2 pCFH2
17 + +
5’-ATGAXGA-3’
3’-TACTYCT-5’
5’-ATGCXCA-3’
3’-TACG16 + YGT-5’+ X•Y = A•T, C•G, G•C, T•A
X•Y = A•T, C•G, G•C, T•A
T•A
G•C
C•G
A•T
1 2 3 4 5 6 7 8 9 10 11 12 13 14 15Intact G A DNase I
10 pM 1 μ M T•A G•C C•G A•T
1 2 3 4 5 6 7 8 9 10 11 12 13 14 15Intact G A DNase I
10 pM 1 μ M X•Y X•Y G•C C•G T•A A•T VI V -0.2 0 0.2 0.4 0.6 0.8 1 1.2
10-1210-1110-1010-910-8 10-710-610-5
θap p [polyamide] VI V G•C C•G A•T T•A -0.2 0 0.2 0.4 0.6 0.8 1 1.2
10-1210-1110-1010-9 10-810-710-610-5
θap
p
[polyamide] pCFH3
pCFH4
24 + +
5’-ATGCXGA-3’
3’-TACGYCT-5’ 5’-ATGCXGA-3’
3’-TACG21 + YCT-5’+
X•Y = A•T, C•G, G•C, T•A X•Y = A•T, C•G, G•C, T•A
T•A
G•C
C•G
A•T
1 2 3 4 5 6 7 8 9 10 11 12 13 14 15Intact G A DNase I
10 pM 1 μ M G•C C•G T•A -0.2 0 0.2 0.4 0.6 0.8 1 1.2 10-12 10-11 10-10 10-9 10-8 10-7 10-6 10-5 θap p [polyamide] T•A G•C C•G A•T
1 2 3 4 5 6 7 8 9 10 11 12 13 14 15Intact G A DNase I
10 pM 1 μ M X•Y X•Y pPh2 pPh2 -0.2 0 0.2 0.4 0.6 0.8 1 1.2 10-12 10-11 10-10 10-9 10-8 10-7 10-6 Θ [polyamide] G•C T•A G•C C•G A•T
1 2 3 4 5 6 7 8 9 10 11 12 13 14 15Intact G A DNase I
10 pM
1
μ
M
V
5’-ATGCXCA-3’
3’-TACG27 + YGT-5’+ X•Y = A•T, C•G, G•C, T•A
pCFH3 X•Y G•C C•G T•A A•T V -0.2 0 0.2 0.4 0.6 0.8 1 1.2 10-12 10-11 10-10 10-9 10-8 10-7 10-6 10-5 θap p [polyamide] 13 + +
5’-ATGAXGA-3’
3’-TACTYCT-5’ X•Y = A•T, C•G, G•C, T•A
pCFH5
T•A
G•C
C•G
A•T
1 2 3 4 5 6 7 8 9 10 11 12 13 14 15Intact G A DNase I
10 pM 1
Figure 2.3. Quantitative DNase I footprint titration experiments for
polyamides 13, 14, 16, 17, 19, 21, 24, and 27 on the 295 bp, 5’-32
Table 2.1. Equilibrium association constants Ka (M-1) a
pCFH2 (5’→3’) ATGCATA ATGCCTA ATGCGTA ATGCTTA
pCFH3 (5’→3’) ATGCACA ATGCCCA ATGCGCA ATGCTCA
pPh2 (5’→3’) ATGCAGA ATGCCGA ATGCGGA ATGCTGA
pCFH4 (5’→3’) ATGAAGA ATGACGA ATGAGGA ATGATGA
14 + +
19 + +
16 + +
21 + +
24 + +
17 + +
7.5 (±5.0)×107 3.0 (±1.0)×107 2.1 (±0.2)×109 4.6 (±2.6)×107
< 1×10⁷ 7.0 (±2.2)×108 1.4 (±0.5)×107 3.6 (±1.3)×107
7.0 (±1.3)×109 2.5 (±1.3)×108 2.5 (±1.0)×109 9.3 (±2.5)×109
< 3.3×10⁷ < 3.3×10⁷ 9.3 (±0.5)×108
< 1×10⁷
< 3.3×10⁷
2.4 (±0.5)×109 1.1 (±0.3)×107 2.2 (±1.4)×107
5.1 (±3.3)×1071.3 (±0.1)×1010 1.8 (±0.7)×108 2.9 (±1.0)×108
27 + + < 1×10⁷ 1.8 (±0.3)×109 9.8 (±1.3)×107 7.1 (±0.6)×107
pCFH5 (5’→3’) ATGAACT ATGACCT ATGAGCT ATGATCT
13 + + 5.3 (±1.4)×108 9.5 (±4.4)×107 2.2 (±0.4)×109 8.2 (±4.1)×107
pMFST (5’→3’) TAGTGGT ATATGGT TAGTCGT
12 + + 4.3 (±0.3)×10109.9 (±0.6)×108 6.2 (±0.2)×109
a K
a (M-1) values reported are the mean values from at least three DNase I footprint titration experiments, with the standard deviation given in parentheses. Assays were performed at 22°C in a buffer of 10 mM Tris-HCl, 10 mM KCl, 10 mM MgCl2, and 5 mM CaCl2 at pH 7.0. Imidazole and pyrrole are shown as fi lled and non-fi lled circles, respectively; β-alanine is shown as a diamond; the dimethylaminopropylamide tail is shown as a half-circle with a plus; and the chiral diaminobutyric acid turn residue is shown as a semihalf-circle linked to a half-circle with a plus connecting the two subunits.
2.2.3. Table of DNA Binding Affi nities for a Hairpin Polyamide Library. Having
1 2 3 4 5 6 7 8 9 10 11 12 13 14 15 16 17 18 19 20 21 22 23 24 25 26 27 + + + + + + + + + + + + + + + + + + + + + + + + + + + + + + + + + + + + + + + + + + + + + 3×10⁹ 5×10⁸ 4×10⁹ 9×10⁹ 3×10¹⁰ 2×10⁹ 5×10⁹ 3×10⁸ 1×10¹⁰ 1×10¹⁰ 4×10⁸ 4×10¹⁰ 2×10⁹ 2×10⁹ 2×10⁹ 9×10⁹ 1×10¹⁰ 2×10⁹ 7×10⁸ 2×10⁸ 9×10⁸ 2×10⁸ 1×10⁸ 2×10⁹ 9×10⁹ 3×10⁹ 1×10⁹
WWGWWWW WWGGWWW WWGWGWW WWGWWGW WWGWWCW WWGWCWW WWGCWWW WWGGGWW WWGGWGW WWGGWCW WWGGCWW WWGWGGW WWGWGCW WWGCGWW WWGCWGW WWGCWCW WWGWCGW WWGWCCW WWGCCWW WWGGGGW WWGCGGW WWGGCGW WWGGGCW WWGCCGW WWGGCCW WWGCGCW WWGCCCW
Polyamide Ka (M-1)
General (5’→3’) Ref
23 42 43 44 23 c 45 46 51 24 47 b b b 48 b b 49 b c b c c b 50 37 b Sequence context
5’-TAGTATT-3’ 5’-CTGGTTA-3’ 5’-TAGTGAA-3’ 5’-TAGTAGT-3’ 5’-TAGTACT-3’ 5’-GAGTCTA-3’ 5’-ATGCAAA-3’ 5’-AAGGGAA-3’ 5’-TAGGTGT-3’ 5’-ATGGTCA-3’ 5’-AAGGCAT-3’ 5’-TAGTGGT-3’ 5’-ATGAGCT-3’ 5’-ATGCGTA-3’ 5’-TAGCAGT-3’ 5’-ATGCTCA-3’ 5’-ATGACGT-3’ 5’-TAGACCA-3’ 5’-ATGCCTA-3’ 5’-GAGGGGT-3’ 5’-ATGCGGT-3’ 5’-CAGGCGT-3’ 5’-CTGGGCA-3’ 5’-ATGCCGT-3’ 5’-ATGGCCA-3’ 5’-ATGCGCA-3’ 5’-ATGCCCA-3’ Table 2.2. Equilibrium association constants Ka (M-1) a
a K
a (M-1) values reported are the mean values from at least three DNase I footprint titration experiments. Assays were performed at 22°C in a buffer of 10 mM Tris-HCl, 10 mM KCl, 10 mM MgCl2, and 5 mM CaCl2 at pH 7.0. Imidazole and pyrrole are shown as fi lled and
2.3. Discussion
The microstructure of DNA is sequence dependent, and each hairpin polyamide acts as a microcaliper for the shape (width, depth) of the minor groove of DNA. Hence, it is not surprising that the energetics of hairpin binding for match sequences varies over two orders of magnitude (108-1010 M-1) and is DNA sequence dependent. We would assume for transcriptional factor inhibition experiments one would prefer the highest affi nity binding molecules. In the hairpin binding motif, β-alanine has been found to be a good structural replacement for Py, as the β/Im pair is specifi c for C•G and β/Py and β/β both code for
A,T.36,37 Furthermore, when β replaces Py adjacent to Im, binding is generally improved,
as this fl exible residue is believed to allow the amino acid pairings to reset their register with the DNA base pairs.37,38 A key example of the use of β to replace Py can be seen in polyamide 26. ImPyImPy-γ-ImPyImPy-β-Dp binds its target sequence
5’-ATGCGCA-3’ with a binding affi nity of 3×10⁷ M-1. Replacement of the internal Py residues with β residues yields the polyamide Im-β-ImPy-γ-Im-β-ImPy-β-Dp, which has a binding affi nity of 3×10⁹ M-1, a 100-fold improvement.37
The chiral substitution of the γ-aminobutyric acid turn residue has been shown to improve binding affi nity and sequence specifi city.32 For polyamides 14, 16, 19, and 24, the chiral diaminobutyric acid turn residue increases equilibrium association constants for these polyamides by 7- to 50-fold over their achiral variants (Table 2.3). In the example of polyamide 21, the achiral pyrrole-imidazole compound
1 2 3 4 5 6 7 8 9 10 11 12 13 14 15 16 17 18 19 20 21 22 23 24 25 26 27 + + + + + + + + + + + + + + + + + + + + + + + + + + + + + + + + + + + + + -4×10⁹ 9×10⁹ -2×10⁹ 5×10⁹ -1×10¹⁰ -4×10¹⁰ 2×10⁹ 2×10⁹ 2×10⁹ 9×10⁹ 1×10¹⁰ -7×10⁸ 2×10⁸ 9×10⁸ 2×10⁸ 1×10⁸ 2×10⁹ -3×10⁹ 1×10⁹
WWGWWWW
WWGGWWW
WWGWGWW
WWGWWGW
WWGWWCW
WWGWCWW
WWGCWWW
WWGGGWW
WWGGWGW
WWGGWCW
WWGGCWW
WWGWGGW
WWGWGCW
WWGCGWW
WWGCWGW
WWGCWCW
WWGWCGW
WWGWCCW
WWGCCWW
WWGGGGW
WWGCGGW
WWGGCGW
WWGGGCW
WWGCCGW
WWGGCCW
WWGCGCW
WWGCCCW
Chiral/β Ka (M-1)
General (5’→3’) Ref
-43 44 -c 45 -51 -b b b 48 b b -b c b c c b -37 b Sequence context
-5’-TAGTGAA-3’
5’-TAGTAGT-3’
-5’-GAGTCTA-3’
5’-ATGCAAA-3’
-5’-TAGGTGT-3’
-5’-TAGTGGT-3’
5’-ATGAGCT-3’
5’-ATGCGTA-3’
5’-TAGCAGT-3’
5’-ATGCTCA-3’
5’-ATGACGT-3’
-5’-ATGCCTA-3’
5’-GAGGGGT-3’
5’-ATGCGGT-3’
5’-CAGGCGT-3’
5’-CTGGGCA-3’
5’-ATGCCGT-3’
-5’-ATGCGCA-3’
5’-ATGCCCA-3’
+ + + + + + + + + + + + + + + + + Achiral 3×10⁹ 5×10⁸ 7×10⁸ -3×10¹⁰ -3×10⁸ -1×10¹⁰ 4×10⁸ -9×10⁷ -6×10⁸ -2×10⁹ 1×10⁸ 2×10⁷
< 1×10⁷
-4×10⁷
9×10⁹
3×10⁷
< 2×10⁸
Ka (M-1) Ref
23 42 43 -23 -46 -24 47 -d -d -49 d 50 d -d 50 50 45 Sequence context
5’-TAGTATT-3’
5’-CTGGTTA-3’
5’-TAGTGAA-3’
-5’-TAGTACT-3’
-5’-AAGGGAA-3’
-5’-ATGGTCA-3’
5’-AAGGCAT-3’
-5’-ATGCGTA-3’
-5’-ATGCACA-3’
-5’-TAGACCA-3’
5’-ATGCCTA-3’
5’-ATGGGGA-3’
5’-ATGCGGT-3’
-5’-ATGCCGT-3’
5’-ATGGCCA-3’
5’-ATGCGCA-3’
5’-TAGCCCA-3’
Table 2.3. Equilibrium association constants Ka (M-1) a
a K
a (M-1) values reported are the mean values from at least three DNase I footprint titration experiments. Assays were performed at 22°C in a buffer of 10 mM Tris-HCl, 10 mM KCl, 10 mM MgCl2, and 5 mM CaCl2 at pH 7.0. Imidazole and pyrrole are shown as fi lled and
2.4. Conclusion
We report here nine new eight-ring hairpin polyamides and assay their DNA-binding properties. These characterizations mark the completion of a 27-member polyamide library that covers all 7-bp DNA sequences 5’-WWGNNNW-3’ (N = W, G, or C), where each compound binds its respective sequence with Ka≥ 1×10⁸ M-1. Typical fold change for match versus single base-pair mismatch sites is in the range of 4 to 100. Looking forward, one could imagine using a DNA microarray-based approach to interrogate the entire sequence-recognition profi le of each member of the 27 hairpin polyamide library on every permutation of DNA sites seven base pairs in size.52 We hope that this compilation of polyamide-DNA binding affi nities will serve as a resource for ongoing small molecule gene regulation projects.
2.5. Experimental
5’-TAGTGGT-3’
3’-ATCACCA-5’12 + + pMFST
1 2 3 4 5 6 7 8 9 10 11 12 13 14 15G Intact
A DNase I 1 pM
100 nM match A B 10-13 10-12 10-11 10-10 10-9 10-8 10-7 10-6
[13]
-0.4 -0.2 0 0.2 0.4 0.6 0.8 1 1.2
1 2 3 4 5 6 7 8 9 10 11 12
Intact C+T DNase I 100 pM
1
μ
M
DNase I
23 + +
5’-CTGGGCA-3’
3’-GACCCGT-5’
1 2 3 4 5 6 7 8 9 10 11 12 13
Intact
A DNase I 10 pM
10 nM
6 + +
5’-GAGTCTA-3’
3’-CTCAGAT-5’
1 2 3 4 5 6 7 8 9 10 11 12 13
Intact
A DNase I 100 pM
100 nM
20 + +
5’-GAGGGGT-3’
3’-CTCCCCA-5’
1 2 3 4 5 6 7 8 9 10 11 12 13
Intact A DNase I 100 pM
100 nM
22 + +
5’-CAGGCGT-3’ 3’-GTCCGCA-5’ Match Match Match Match Match A B
Figure 2.4. Quantitative DNase I footprint titration experiments for polyamides 6, 12, 20, 22, and 23. A binding model for the hairpin motif is shown above each gel with the polyamide
Columns were purchased from Amersham Biosciences. Adenosine 5’-triphosphate [γ-32P], DL-dithiothreitol, and Tris were purchased from MP Biomedicals. 0.5 M EDTA, pH 8.0, phenol:chloroform:isoamyl alcohol (25:24:1 v/v), and formamide were purchased from Invitrogen. Potassium chloride, magnesium chloride, calcium chloride, and sodium chloride were purchased from Mallinckrodt. RNase-free water was purchased from USB. 8% Gene-PAGE PLUS, 7 M urea, denaturing acrylamide blend was purchased from Amresco. Tris borate EDTA was purchased from National Diagnostics. All reagents were used without further purifi cation.
HPLC analysis was performed on a Beckman Gold system using a Phenomenex Gemini 4.6 × 250 mm, 5 μm 100 Å C18 reverse-phase column in 0.1% (w/v) TFA with acetonitrile as the eluent. Preparatory HPLC was carried out on a Beckman Gold system using either a Waters Delta-Pak 25 × 100 mm, 15 μm 300 Å C18 PrepPak Cartridge reverse-phase column or a Varian Dynamax 21.4 × 250 mm Microsorb 8 μm 300 Å C8 reverse-phase column in 0.1% (w/v) TFA with acetonitrile as the eluent. UV spectra were measured on an Agilent Technologies 8453 UV-Vis ChemStation spectrophotometer. Matrix-assisted laser desorption ionization/time-of-fl ight mass spectrometry (MALDI-TOF-MS) was carried out on an Applied Biosystems Voyager DE-PRO. Storage phosphor autoradiography was performed on a Molecular Dynamics Typhoon 8600 phosphorimager. 18MΩ water was obtained from an AquaMAX Ultra water purifi cation system, and all buffers were 0.2 μm
fi ltered.
2.5.2. Polyamide synthesis. Polyamides were synthesized using pre-loaded
Boc-β-Ala-PAM resin (50 mg, 0.81 meq/g) according to published manual solid-phase synthesis
2.5.2.1. Im-β-ImIm-(R)H2Nγ-PyPyPyPy-β-Dp (12). Polyamide 12 was isolated
upon lyophilization of the appropriate fractions as a white powder (0.1 mg, 0.1% recovery). UV (H2O) λmax = 309 nm; MALDI-TOF-MS (monoisotopic) m/z 1187.86 (1187.57 calcd for [M + H]+ C
54H71N22O10+).
2.5.2.2. ImPyImPy-(R)H2Nγ-ImPyPyPy-β-Dp (13). Polyamide 13 was isolated
upon lyophilization of the appropriate fractions as a white powder (0.1 mg, 0.1% recovery). UV (H2O) λmax = 314 nm; MALDI-TOF-MS (monoisotopic) m/z 1238.59 (1238.58 calcd for [M + H]+ C
57H72N23O10+).
2.5.2.3. ImPyImPy-(R)H2Nγ-PyPyImPy-β-Dp (14). Polyamide 14 was isolated
upon lyophilization of the appropriate fractions as a white powder (0.1 mg, 0.1% recovery). UV (H2O) λmax = 315 nm; MALDI-TOF-MS (monoisotopic) m/z 1238.58 (1238.58 calcd for [M + H]+ C
57H72N23O10+).
2.5.2.4. ImPyPyPy-(R)H2Nγ-ImPyImPy-β-Dp (16). Polyamide 16 was isolated
upon lyophilization of the appropriate fractions as a white powder (0.4 mg, 1.5% recovery). UV (H2O) λmax = 315 nm; MALDI-TOF-MS (monoisotopic) m/z 1238.49 (1238.58 calcd for [M + H]+ C
57H72N23O10+).
2.5.2.5. ImPyPyIm-(R)H2Nγ-PyImPyPy-β-Dp (17). Polyamide 17 was isolated
upon lyophilization of the appropriate fractions as a white powder (1.8 mg, 7.1% recovery). UV (H2O) λmax = 316 nm; MALDI-TOF-MS (monoisotopic) m/z 1238.63 (1238.58 calcd for [M + H]+ C
57H72N23O10+).
2.5.2.6. ImPyPyPy-(R)H2Nγ-PyImImPy-β-Dp (19). Polyamide 19 was isolated
upon lyophilization of the appropriate fractions as a white powder (0.9 mg, 3.8% recovery). UV (H2O) λmax = 312 nm; MALDI-TOF-MS (monoisotopic) m/z 1238.63 (1238.58 calcd for [M + H]+ C
2.5.2.7. Im-β-ImIm-(R)H2Nγ-PyPyImPy-β-Dp (21). Polyamide 21 was isolated
upon lyophilization of the appropriate fractions as a white powder (0.3 mg, 0.2% recovery). UV (H2O) λmax = 309 nm; MALDI-TOF-MS (monoisotopic) m/z 1188.67 (1188.57 calcd for [M + H]+ C
53H70N23O10+).
2.5.2.8. ImPyPyIm-(R)H2Nγ-PyImImPy-β-Dp (24). Polyamide 24 was isolated
upon lyophilization of the appropriate fractions as a white powder (1.9 mg, 7.5% recovery). UV (H2O) λmax = 310 nm; MALDI-TOF-MS (monoisotopic) m/z 1239.67 (1239.58 calcd for [M + H]+ C
56H71N24O10+).
2.5.2.9. ImPyPyPy-(R)H2Nγ-ImImImPy-β-Dp (27). Polyamide 27 was isolated
upon lyophilization of the appropriate fractions as a white powder (0.1 mg, 0.1% recovery). UV (H2O) λmax = 310 nm; MALDI-TOF-MS (monoisotopic) m/z 1239.60 (1239.58 calcd for [M + H]+ C
56H71N24O10+).
2.5.3. DNase I footprinting experiments. Plasmids pCFH2, pCFH3, pCFH4,
pCFH5, pPh2, and pMFST were constructed according to standard protocols for DNA manipulation.39 PCR products (295 bp, 5’-32P-end-labeled) were isolated and DNase I footprint titrations were performed according to standard protocols.35 Chemical sequencing reactions were performed according to published methods.40,41
Acknowledgements. We are grateful to the National Institutes of Health for research
References
(1) Gottesfeld, J. M.; Neely, L.; Trauger, J. W.; Baird, E. E.; Dervan, P. B., Nature
1997,387, 202-205.
(2) Dickinson, L. A.; Gulizia, R. J.; Trauger, J. W.; Baird, E. E.; Mosier, D. E.; Gottesfeld, J. M.; Dervan, P. B., Proc. Natl. Acad. Sci. USA 1998,95, 12890-12895.
(3) Mapp, A. K.; Ansari, A. Z.; Ptashne, M.; Dervan, P. B., Proc. Natl. Acad. Sci. USA
2000,97, 3930-3935.
(4) Janssen, S.; Cuvier, O.; Muller, M.; Laemmli, U. K., Mol. Cell 2000, 6, 1013-1024.
(5) Maeshima, K.; Janssen, S.; Laemmli, U. K., EMBO J. 2001,20, 3218-3228.
(6) Gygi, M. P.; Ferguson, M. D.; Mefford, H. C.; Lund, K. P.; O’Day, C.; Zhou, P.; Friedman, C.; van den Engh, G.; Stolowitz, M. L.; Trask, B. J., Nucleic Acids Res. 2002, 30, 2790-2799.
(7) Crowley, K. S.; Phillion, D. P.; Woodard, S. S.; Schweitzer, B. A.; Singh, M.; Shabany, H.; Burnette, B.; Hippenmeyer, P.; Heitmeier, M.; Bashkin, J. K., Bioorg. Med. Chem. Lett. 2003,13, 1565-1570.
(8) Kodadek, T.; Reddy, M. M.; Olivos, H. J.; Bachhawat-Sikder, K.; Alluri, P. G., Acc. Chem. Res. 2004,37, 711-718.
(9) Olenyuk, B. Z.; Zhang, G. J.; Klco, J. M.; Nickols, N. G.; Kaelin, W. G.; Dervan, P. B., Proc. Natl. Acad. Sci. USA 2004,101, 16768-16773.
(11) Burnett, R.; Melander, C.; Puckett, J. W.; Son, L. S.; Wells, R. D.; Dervan, P. B.; Gottesfeld, J. M., Proc. Natl. Acad. Sci. USA 2006,103, 11497-11502.
(12) Belitsky, J. M.; Leslie, S. J.; Arora, P. S.; Beerman, T. A.; Dervan, P. B., Bioorg. Med. Chem. 2002,10, 3313-3318.
(13) Best, T. P.; Edelson, B. S.; Nickols, N. G.; Dervan, P. B., Proc. Natl. Acad. Sci. USA
2003,100, 12063-12068.
(14) Edelson, B. S.; Best, T. P.; Olenyuk, B.; Nickols, N. G.; Doss, R. M.; Foister, S.; Heckel, A.; Dervan, P. B., Nucleic Acids Res. 2004,32, 2802-2818.
(15) Pandolfi , P. P., Oncogene 2001,20, 3116-3127.
(16) Darnell, J. E., Nat. Rev. Cancer 2002,2, 740-749.
(17) Arkin, M. R.; Wells, J. A., Nat. Rev. Drug Discov. 2004,3, 301-317.
(18) Dervan, P. B., Bioorg. Med. Chem. 2001,9, 2215-2235.
(19) Dervan, P. B.; Edelson, B. S., Curr. Opin. Struct. Biol. 2003,13, 284-299.
(20) Pelton, J. G.; Wemmer, D. E., Proc. Natl. Acad. Sci. USA 1989,86, 5723-5727.
(21) Wade, W. S.; Mrksich, M.; Dervan, P. B., J. Am. Chem. Soc. 1992, 114, 8783-8794.
(22) Mrksich, M.; Wade, W. S.; Dwyer, T. J.; Geierstanger, B. H.; Wemmer, D. E.; Dervan, P. B., Proc. Natl. Acad. Sci. USA 1992,89, 7586-7590.
(23) Trauger, J. W.; Baird, E. E.; Dervan, P. B., Nature 1996,382, 559-561.
(25) Kielkopf, C. L.; Baird, E. E.; Dervan, P. B.; Rees, D. C., Nat. Struct. Biol. 1998,5, 104-109.
(26) Kielkopf, C. L.; White, S.; Szewczyk, J. W.; Turner, J. M.; Baird, E. E.; Dervan, P. B.; Rees, D. C., Science 1998,282, 111-115.
(27) Mrksich, M.; Parks, M. E.; Dervan, P. B., J. Am. Chem. Soc. 1994, 116, 7983-7988.
(28) Herman, D. M.; Turner, J. M.; Baird, E. E.; Dervan, P. B., J. Am. Chem. Soc. 1999, 121, 1121-1129.
(29) Greenberg, W. A.; Baird, E. E.; Dervan, P. B., Chem. Eur. J. 1998,4, 796-805.
(30) Heckel, A.; Dervan, P. B., Chem. Eur. J. 2003,9, 3353-3366.
(31) Swalley, S. E.; Baird, E. E.; Dervan, P. B., J. Am. Chem. Soc. 1999, 121, 1113-1120.
(32) Herman, D. M.; Baird, E. E.; Dervan, P. B., J. Am. Chem. Soc. 1998, 120, 1382-1391.
(33) Renneberg, D.; Dervan, P. B., J. Am. Chem. Soc. 2003,125, 5707-5716.
(34) Baird, E. E.; Dervan, P. B., J. Am. Chem. Soc. 1996,118, 6141-6146.
(35) Trauger, J. W.; Dervan, P. B., Methods Enzymol. 2001,340, 450-466.
(36) Swalley, S. E.; Baird, E. E.; Dervan, P. B., Chem. Eur. J. 1997,3, 1600-1607.
(37) Turner, J. M.; Swalley, S. E.; Baird, E. E.; Dervan, P. B., J. Am. Chem. Soc. 1998, 120, 6219-6226.
(39) Sambrook, J.; Fritsch, E. F.; Maniatis, T., Molecular Cloning: A Laboratory Manual. 2nd ed.; Cold Spring Harbor Laboratory: Plainview, NY, 1989.
(40) Maxam, A. M.; Gilbert, W., Methods Enzymol. 1980,65, 499-560.
(41) Iverson, B. L.; Dervan, P. B., Nucleic Acids Res. 1987,15, 7823-7830.
(42) Neely, L.; Trauger, J. W.; Baird, E. E.; Dervan, P. B.; Gottesfeld, J. M., J. Mol. Biol.
1997,274, 439-445.
(43) Dickinson, L. A.; Trauger, J. W.; Baird, E. E.; Ghazal, P.; Dervan, P. B.; Gottesfeld, J. M., Biochemistry 1999,38, 10801-10807.
(44) Wang, C. C. C. Ph.D. thesis, California Institute of Technology, Pasadena, CA, 2002.
(45) Trauger, J. W. Ph.D. thesis, California Institute of Technology, Pasadena, CA, 1998.
(46) Swalley, S. E.; Baird, E. E.; Dervan, P. B., J. Am. Chem. Soc. 1996, 118, 8198-8206.
(47) Gottesfeld, J. M.; Melander, C.; Suto, R. K.; Raviol, H.; Luger, K.; Dervan, P. B., J. Mol. Biol. 2001,309, 615-629.
(48) Belitsky, J. M. Ph.D. thesis, California Institute of Technology, Pasadena, CA, 2002.
(49) Coull, J. J.; He, G. C.; Melander, C.; Rucker, V. C.; Dervan, P. B.; Margolis, D. M., J. Virol. 2002,76, 12349-12354.
(51) Tsai, S. M.; Farkas, M. E.; Chou, C. J.; Gottesfeld, J. M.; Dervan, P. B., Nucleic Acids Res. 2007,35, 307-316.
Chapter 3
Quantitating the Concentration of Py-Im Polyamide-Fluorescein
Conjugates in Live Cells
The text of this chapter was taken in part from a manuscript co-authored with Peter B. Dervan (Caltech).
Abstract
Quantitative fl uorescence-based methods have been developed to determine the
nuclear concentration of polyamide-fl uorescein conjugates in cell culture. Confocal laser
scanning microscopy and fl ow cytometry techniques are utilized to plot calibration curves,
from which the nuclear concentration can be interpolated. Upon treatment with polyamide,
the concentration in the nucleus of live HeLa cells is calculated to be between 0.1-0.5 μM,
which is signifi cantly lower than the 2 μM dosage concentration. In contrast, the observed
nuclear concentration in U251 cells is closer to the dosage concentration, indicating a cell
line-specifi c increase in uptake for this class of compounds. Although confocal microscopy
and fl ow cytometry generate disparate values, taken together these experiments suggest
3.1. Introduction
Hairpin pyrrole-imidazole polyamides are synthetic ligands that target predetermined
DNA sequences with affi nities comparable to those of naturally occurring DNA-binding
proteins.1,2 These cell-permeable small molecules have been shown to localize to the nucleus of living cells3-7 and regulate endogenous gene expression.8-12 Polyamides selectively bind in the minor groove of DNA according to a set of “pairing rules,” where
each heterocyclic ring pair targets a specifi c Watson-Crick base pair.1,2 The antiparallel pairing of N-methylpyrrole (Py) and N-methylimidazole (Im) aromatic rings targets the
C•G base pair, while Im/Py discriminates G•C.13-16 The Py/Py pair recognizes A•T and T•A, while chlorothiophene can be paired with Py to distinguish T•A at the N-terminus.17
Polyamide-small molecule conjugates have been utilized in a number of
applications.18-21 In particular, with laser microscopy it is possible to visualize the uptake of polyamide-fl uorophore conjugates as they traffi c unaided to the nucleus of live cells. 3-6 This advance has helped to usher in an era of gene regulation.8-11 Traditionally, we have used a qualitative scoring system to rate the extent of nuclear localization in cell
culture.5,6 Upon incubation with polyamide and direct imaging of cells, the fl uorescence intensity in the nucleus is compared to that in the medium. Positive scores are assigned
when the nuclear staining exceeds that of the medium. The degree of nuclear localization
varies across polyamide design, fl uorophore selection, and cell type.3-6 Quantitating the polyamide concentration within the cell nucleus would be an improvement over the current
“yes/no” rating, thus creating a digital readout of cellular uptake.
Our quantitative approach utilizes two different fl uorescent imaging technologies.
First, with confocal laser scanning microscopy, we can compare images of cells to images
of calibration standards containing known polyamide concentrations, then interpolate to
determine the nuclear concentration in the cell. Next, we can corroborate this value with
additional evidence from fl ow cytometry. Here, the fl uorescence of live cells is compared
yielding the interpolated number of fl uorophores per cell. Taken together, these values
provide a numerical range that is not apparent from previous qualitative experiments. In this
study, we investigate the nuclear concentration of two polyamide-fl uorescein conjugates in
two cell lines using confocal laser scanning microscopy and fl ow cytometry.
3.2. Polyamide synthesis
For these experiments, we wanted to examine polyamide-fl uorescein conjugates that
traffi c strongly to the nucleus of live cells (Figure 3.1). Polyamide 1 specifi cally targets the
DNA sequence 5’-WTWCGW-3’ with an equilibrium association constant of 3.8×10⁹ M-1, while polyamide 2 binds 5’-WGGWCW-3’ with an affi nity of 6.3×10⁹ M-1 (Figure 3.2). For these molecules synthesized with Boc-β-Ala-PAM resin, the 1,3-diaminopropane (C3) linker is used to connect the polyamide and fl uorescein moiety.
Polyamides 1 and 2 show positive nuclear localization in HeLa and U251 cell culture
by confocal laser scanning microscopy (Figure 3.1). In each of these images, the nuclear
staining exceeds that of the medium, and all are qualitatively rated as ++.5,6 Furthermore, conjugate 1 binds to the hypoxia response element (HRE) and inhibits vascular endothelial
growth factor (VEGF) expression in HeLa cells by quantitative RT-PCR, while the mismatch
control compound 2 does not downregulate gene expression (Figure 3.2).8-10
3.3. Steady-state fl uorimetry
Fluorescence enhancement is observed when polyamide-fl uorophore conjugates
bind DNA.22-25 When in solution, the fl uorescence of the conjugate is largely quenched, but, upon DNA binding, sequestration of the polyamide in the minor groove restores
fl uorescence. The fl uorescence enhancements of polyamides 1 and 2 were 14- and
36-fold, respectively, as determined by steady-state fl uorimetry (Figure 3.3). The fl uorescent
nuclei observed in confocal microscopy images appear much brighter than the background
medium. Does this mean that the nuclear polyamide concentration is very high, or does the
S N H O N N
H O N N
H O N N NH O NH3 H N N H N O N N H N O N H N O N H N O O O H N H N HN S O O O CO2 Cl N N N H O N N N H O N N
H O N NH
O NH3 H N N N H N O N H N O N H N O N H N O O O H N H N HN S O O O CO2 + C3 FITC + C3 FITC 1 2 A B 1 2 HeLa U251
IV
III
II
I
1 2 3 4 5 6 7 8 9 10 11 12 13 14 15
Intact G A DNase I 1 pM
100 nM III II I IV -0.2 0 0.2 0.4 0.6 0.8 1 1.2 10-13 10-12 10-11 10-10 10-9 10-8 10-7 10-6 θno rm [polyamide] I
1 2 3 4 5 6 7 8 9 10 11 12 13 14 15
Intact G A DNase I 3 pM
300 nM -0.2 0 0.2 0.4 0.6 0.8 1 1.2 10-12 10-11 10-10 10-9 10-8 10-7 10-6 θap p [polyamide] I 1 2 A B 1.2 1.0 0.8 0.6 0.4 0.2 0 DFO Polyamide – + + + +
– – 1 2
Figure 3.2. (A) Quantitative DNase I footprint titration experiments for polyamides 1 and
2; lane 1, intact DNA; lane 2, G reaction; lane 3, A reaction; lane 4, DNase standard; lanes 5-15, polyamide concentrations. Binding isotherms are shown below each footprinting gel;
16,000,000
14,000,000
10,000,000 12,000,000
8,000,000
6,000,000
4,000,000
2,000,000
0
16,000,000
14,000,000
10,000,000 12,000,000
8,000,000
6,000,000
4,000,000
2,000,000
0
500 550 600 650
500 550 600 650
emission wavelength (nm)
emission wavelength (nm)
relative fluorescence units
relative fluorescence units
HeLa
– +
+ +
1 CT DNA
A
B
Figure 3.3. (A) Overlaid fl uorescence emission spectra for polyamides 1 (top) and 2