these salt-affected soils are considerably higher for drip irrigation compared to sprinkler and furrow irrigation (Hanson and May 2003).
Managing tomato irrigation water efficiently requires estimating crop evapotranspiration (ETc) — its water use — between irrigations. ETc is com-monly estimated by multiplying a crop coefficient by a reference crop evapo -transpiration (ETo). ETo is the evapo-transpiration of well-watered grass and is obtained from the California Irrigation Management Information System (CIMIS), operated by the California Department of Water Resources. The crop coefficient is the ratio of ETc to ETo, and depends on crop type and growth stage. During the 1970s, the seasonal ETc for processing tomatoes in the Central Valley ranged from 25.1 to 28.1 inches, depending on planting time, with an average seasonal value of 25.4 inches (Fereres and Puech 1981).
Crop coefficients vary with crop type and stage of growth. There are four growth stages: (1) initial, from planting to about 10% canopy coverage, includ-ing plantinclud-ing, germination and stand es-tablishment; (2) crop development, from about 10% to about 75% canopy cover-age; (3) midseason, 75% coverage to the start of maturity, encompassing bloom, fruit-set and the majority of fruit sizing;
and (4) late season, from full maturity to harvest or complete senescence. Midseason crop coefficients (during the period of the highest ETc) were devel-oped from previous experimental data and range from 1.05 under subsurface drip irrigation (Phene et al. 1985) to 1.25 under sprinkler irrigation (Pruitt et al. 1972). More recently, the recommended midseason coefficients were 1.10 to 1.15 (Allen et al. 1998), although the source of these coefficients was not identified. Several studies have shown a linear relationship between tomato yield and ETc. The long-term processing-tomato yield increase since 1975, coupled with the variability in crop coefficients determined from experimental data conducted 20 to 35 years ago, raise questions about current ETc require-ments. This study evaluated the water usage of processing tomatoes on the west side of the San Joaquin Valley in furrow- and drip-irrigated commercial fields under a wide range of cultural practices used by growers, in order to develop more up-to-date evapotranspi-ration data and new crop coefficients.
Assessing evapotranspiration From 2001 to 2004, we determined the ETc for processing tomatoes using
three furrow-irrigated and five drip-irrigated commercial fields near Five
New crop coefficients developed for high-yield processing tomatoes
RESEARCH ARTICLE t
by Blaine R. Hanson and Donald M. May
Processing tomato yields have in-creased by 53% over the past 35 years, but the current seasonal crop-evapotranspiration requirements that growers use to schedule irriga-tion are based on 1970s-era data. We updated this data and developed new crop coefficients for process-ing tomatoes usprocess-ing the Bowen ratio energy balance method in eight commercial fields from 2001 to 2004. Today’s evapotranspiration rates are similar to those of the early 1970s, indicating a substantial increase in water-use efficiency by processing tomatoes during the past 35 years. In addition, we collected data in both furrow- and drip-irrigated fields, but no statistical differences were found between them.
C
alifornia produces nearly 95% of the processing tomatoes grown in the United States (CTGA 2005; USDA 2005). Nearly one-third of the state’s tomato acreage is in the Central Valley’s West-lands Water District (2005). Statewide, the average yields of processing toma-toes have increased by more than half (53%) from the early 1970s to the early 2000s (from 23.7 tons per acre for 1970 to 1974, to 36.3 tons per acre for 2000 to 2004), with most of the yield increase occurring after 1975 (CTGA 2005).This long-term yield increase is the result of breeding programs that de-veloped new tomato varieties better adapted to the climate and soil condi-tions of the Central Valley. In addition to higher yields, these new varieties also have better fruit quality. Furrow irrigation is commonly used in process-ing tomato cultivation, although drip irrigation is increasing, particularly in salt-affected soils along the west side of the San Joaquin Valley. Recent stud-ies have shown that tomato yields in
Points, about 50 miles southwest of Fresno. Measurements were made in one drip-irrigated field and one furrow-irrigated field each year except for 2003, when measurements were made in two drip-irrigated fields. At all sites, irriga -tion water-management decisions were made by the growers or consultants hired by the grower. The soil type was clay loam for all fields.
The eight commercial fields that we studied were selected to represent a wide range of cultural practices (table 1). One plant row per bed was used at all sites except one (H2003), a drip-irrigated field with two plant rows per bed. Furrows ranged from about 640 to 800 feet long, and alternate furrow irrigation was used throughout except during the can-opy development stage in 2001.
Drip lines were installed from 8 to 14 inches deep, and their lengths were 2,600 feet in 2001, and 1,200 feet during the rest of the study. Emitter spacing was 12 inches from 2001 through 2003, and 18 inches in 2004. In 2002, the sub-surface drip system was replaced at the end of June due to emitter clogging; the new lines were installed in every other furrow. At all sites, each bed contained one drip line per bed, except for the sur-face drip system.
ETc was determined with the Bowen ratio energy balance (BREB) method us-ing Campbell Scientific (Logan, Utah) systems. The BREB method calculates ETc from measurements of net
radia-tion, soil heat flux, soil temperature, soil water content, wind speed, air tem-perature and dew point temtem-perature. A computer ET model developed by Hsiao and Henderson (1985) was used to estimate ETc during the cultivation periods, which required the removal of the BREB systems, and during periods
of instrument problems. There was a difference of 5% or less between the cumulative ETc estimated by the model (calibrated from the BREB data) and the BREB systems.
Using experimental plots in com-mercial fields sacrifices the statistical rigor of a randomized replicated design. However, there are several important ad-vantages to using commercial fields: (1) ETc is determined under the conditions experienced by growers, (2) ETc reflects
the fieldwide conditions, and (3) fields can be selected to reflect a range of cul -tural practices used by tomato growers.
Moreover, there are several reasons why it is not practical to measure ETc in a randomized, replicated experimental design. Plot sizes must be relatively large because the BREB method requires a significant amount of fetch, or area of crop around the instruments. A fetch-to-instrument height above the surface of 100-to-1 is commonly used as a rule of thumb. For example, at maximum can-opy coverage in our study, the instru-ments were positioned 6.5 feet above the ground surface and so required 650 feet of fetch. Furthermore, instruments would be needed in each plot, which — at $15,000 to $20,000 per setup — would be prohibitively expensive.
Crop coefficients were calculated as the ratio of ETc to ETo. The latter was obtained from the California Irrigation Management Information System (CIMIS) station at the UC Westside Research and Extension Center, about 3 to 5 miles from the eight study fields.
Crop evapotranspiration trends Initially, the 2001 furrow ETc was 0.22 inches per day due to sprinkler- irrigated stand establishment, but rap-idly decreased to nearly 0.05 inches
per day for the next 25 days (fig. 1A). Thereafter, ETc increased during canopy development, reaching maximum values on or about day 170, and then decreasing again to the season’s end. During canopy development, ETc spikes occurred due to furrow irrigations, which wet the soil surface across the bed. The 2001 drip ETc was very small at the beginning of the crop season due to stand establishment with the drip system, but increased with time to maximum values of nearly 0.3 inches per day. Thereafter, drip ETc generally
fluctuated between 0.22 and 0.32 inches per day. The average midseason ETc was 0.29 inches per day for furrow and 0.27 inches per day for drip irrigation.
In 2002, both furrow and drip ETc val-ues exceeded 0.17 inches per day due to sprinkler irrigation at the beginning of the crop season, but ETc rapidly decreased to less than 0.08 inches per day followed by relatively constant values until the start of canopy development (fig. 1B). ETc then rapidly increased to high midseason val-ues of 0.31 inches per day for both irriga-tion methods. Drip ETc decreased near the end of the crop season, indicating a late-season growth stage; no similar behavior occurred for the furrow ETc.
Relatively high initial values of ETc occurred for H2003 (drip irrigation) due to sprinkler irrigation, followed by val-ues generally smaller than 0.05 inches per day for about 35 days (fig. 1C). The initial values for D2003 (drip irrigation) were about 0.05 inches per day due to the drip-irrigated stand establishment, followed by a rapid increase in ETc after about 23 days. Average midseason val-ues were 0.27 and 0.31 inches per day for D2003 and H2003, respectively.
In 2004, two sprinkler irrigations oc-curred for both furrow and drip irriga-tion during initial growth. Following the second sprinkler irrigation of the furrow site, ETc decreased slightly but then increased to maximum values at midseason (fig. 1D). After day 210, fur -row ETc decreased with time. Drip ETc increased with time after the second sprinkler irrigation, reaching midseason values on about day 220. After day 220, drip ETc generally decreased with time. Average midseason values were 0.30 and 0.27 inches per day for furrow and drip irrigation, respectively.
TABLE 1. Characteristics of eight sites used in processing tomato study
2001 2002 2003 2004
Furrow Drip Furrow Drip Drip (H2003) Drip (D2003) Furrow Drip Planting date April 16 April 18 April 8 April 2 March 1 May 1 April 25 May 25 Bed spacing (in.) 66 66 60 60 60 66 66 66
Planting type* T T D D D T T T
Establishment† S Dr S S S Dr S S
Rows/bed 1 1 1 1 2 1 1 1
Crop season (days) 121 128 133 147 138 109 125 133 Variety BOS 3155 Heinz 9557 Heinz 9491 Heinz 9773 SUN 6117 Heinz 9557 Heinz 9780 Heinz 9492
Heinz 9557 Heinz 9665 Peto-Hypeel 303 Peto-Hypeel 303 Heinz 9665 Heinz 9773
Daily crop coefficients
During sprinkler irrigation at the start of the crop season, crop coefficients were nearly equal to 1 for all years; this indicates that ETc was nearly equal to ETo during sprinkler irrigation because
of evaporation from the soil surface (fig. 2). Maximum crop coefficients deter -mined from the BREB data ranged from 0.91 to 1.21, with an average of 1.03. The average crop coefficient between sprin -kler irrigation and 10% canopy coverage was 0.19, due to a substantial reduction in evaporation caused by a drying soil surface. Crop coefficients at the start of the crop season were smaller than 0.3 for sites where subsurface drip irriga-tion was used for stand establishment. During canopy development, crop coef-ficients increased rapidly to values gen -erally exceeding 1.
The crop coefficients remained rela -tively constant during midseason, but the average midseason crop coefficient varied year to year from 0.96 to 1.09 (table 2). No statistical differences were found between the midseason crop coef-ficients of the two irrigation methods in any year. The 2001 coefficients were smaller and generally statistically differ-ent from those of the other years, while the 2004 coefficients were higher and statistically different from those of the other years. These average midseason coefficients were similar to those found by Phene et al. (1985), but smaller than those of Pruitt et al. (1972).
The daily crop coefficient data showed well-defined late-season growth stages for only the 2002 drip system and the 2004 drip and furrow systems. The aver-age crop coefficients for the last 5 days of the measurement period were 0.55 (2004 drip), 0.59 (2002 drip) and 0.78 (2004 fur-row). No late-season stages of decreasing ETc were found for the other sites. Canopy growth rates
Canopy coverage over time (days after planting) showed similar growth rates for drip- and furrow-irrigated fields in 2001 and 2002, due to similar planting dates and types (figs. 3A and B). A slight decrease in canopy cover-age occurred near the end of the crop season due to vine training (pushing the vines in the furrow back onto the bed) and/or trimming (cutting off vines in
[image:3.612.37.368.173.697.2]Fig. 1. Daily reference crop evapotranspiration and daily crop evapotranspiration for furrow and drip sites in (A) 2001, (B) 2002, (C) 2003 (drip only) and (D) 2004.
Fig. 2. Daily crop coefficients with days after planting for (A) 2001, (B) 2002, (C) 2003 and (D) 2004.
TABLE 2. Average daily midseason crop coefficients and statistical analysis for processing tomato
2001 2002 2003 2004
Furrow Drip Furrow Drip Drip (H2003) Drip (D2003) Furrow Drip
Sample size 24 37 29 37 47 30 45 37
Average 1.02ab* 0.96b 1.06c 1.05ac 1.05c 0.99ab 1.09d 1.08d
SD 0.04 0.05 0.04 0.06 0.04 0.11 0.04 0.02
the furrow), methods used to improve air circulation and reduce mold and rot in the canopy.
The canopy growth of H2003 (drip irrigation) lagged behind that of D2003 (drip irrigation) because the former was planted much earlier (March 1 vs. May 1, respectively) (fig. 3C). This early planting date resulted in a much longer initial growth stage. However, similar values of maximum canopy coverage occurred in both 2003 fields.
In 2004, growth rates varied between the two fields due to different planting dates and stand establishment problems with the drip-irrigated field (fig. 3D). These problems slowed down the initial growth rate of the drip-irrigated field, but eventually its canopy coverage recovered to nearly 90%. The canopy coverage of the drip field later decreased to about 80% due to vine training.
Coverage and crop coefficients We described the relationship between canopy coverage (C) and crop coefficient (Kc) using a second-order polynomial
equation (fig. 4). Crop coefficients that oc -curred during the sprinkler irrigations or were calculated by the computer model were excluded from this relationship. A regression analysis developed the follow-ing equation:
Kc = 0.126 + (0.0172)(C) - (0.0000776)(C2). (1) The regression was highly significant, with a coefficient of determination of 0.96. This relationship appeared to be indepen-dent of specific field characteristics.
Equation 1 can be used to determine crop coefficients from canopy cover -age data for Central Valley processing tomatoes. However, this may be incon-venient due to the time required to mea-sure canopy coverage. Therefore, based on the canopy growth curves for differ-ent planting times and equation 1, we developed a family of curves showing crop coefficients by time of year for var -ious planting times (fig. 5). Some adjust -ments may be needed for site-specific conditions. For example, the canopy growth of transplants may be 10 to 20 days ahead compared to direct-seeded plants for similar planting times. Soil water tension
The soil water tension data (not shown) indicated that most of the time,
the irrigation frequencies and amounts of irrigation water applied during this study were adequate, and that ETc rates and processing tomato yields should not be adversely affected by water stress. The exception was H2002 (drip irrigation), where clogging of the drip lines during the initial and canopy- development growth stages caused soil water tensions to exceed 200 centibars (maximum values less than 80 centibars are recommended). Interestingly, the canopy growth rate and processing to-mato yield for that field did not show any adverse effects due to these high tensions.
Water-use study results
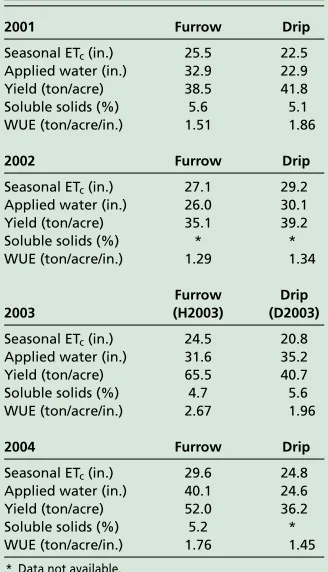
Evapotranspiration. For all years, seasonal crop ETc ranged from 20.8 to 29.6 inches (table 3), and the average difference in ETc between irrigation
methods was not statistically signifi -cant (t-test, level of significance = 0.05). The average ETc of all sites was 25.5 inches with a standard deviation (SD) of 3.1 inches. The average ETc of the fur-row systems was 27.4 inches (SD = 2.0 inches) and the drip systems was 24.4 inches (SD = 3.1 inches).
Applied water. Applied water ranged from 22.9 to 40.1 inches. The fur-row irrigation amounts included surface runoff that was recovered and reused elsewhere on the farms. The D2003 high water applications reflected an attempt by the irrigator to reverse decreasing soil water potential at the 6-inch depth. Reasons for the high water application of H2003 (drip irrigation) were not clear.
[image:4.612.55.220.53.342.2]Yields. Crop yields ranged from 35.1 to 65.5 tons per acre. The large yield of H2003 reflected its very early plant -ing time, which experience has shown results in larger yields. Differences between average yields of furrow and drip irrigation were not statistically sig-nificant, which is not surprising consid -ering the variability in the data. There was no correlation between crop yields and ETc; we believe the main reason for this was the different processing-tomato varieties planted, based on a separate study that we conducted on the effects of variety on yield under drip irrigation (May and Hanson 2004). Year-to-year climate variability and different crop seasons also may have contributed to the crop yield differences.
[image:4.612.54.224.392.524.2]Fig. 3. Canopy coverage (%) versus days after planting for (A) 2001, (B) 2002, (C) 2003 or (D) 2004.
Fig. 4. Relationship between average crop coefficient and canopy coverage.
[image:4.612.54.225.563.703.2]TABLE 3. Water-use efficiency (WUE), seasonal evapotranspiration (ETc), seasonal applied water
and tomato yield of eight study sites
2001 Furrow Drip
Seasonal ETc (in.) 25.5 22.5
Applied water (in.) 32.9 22.9 Yield (ton/acre) 38.5 41.8 Soluble solids (%) 5.6 5.1 WUE (ton/acre/in.) 1.51 1.86
2002 Furrow Drip
Seasonal ETc (in.) 27.1 29.2
Applied water (in.) 26.0 30.1 Yield (ton/acre) 35.1 39.2 Soluble solids (%) * * WUE (ton/acre/in.) 1.29 1.34
Furrow Drip
2003 (H2003) (D2003)
Seasonal ETc (in.) 24.5 20.8
Applied water (in.) 31.6 35.2 Yield (ton/acre) 65.5 40.7 Soluble solids (%) 4.7 5.6 WUE (ton/acre/in.) 2.67 1.96
2004 Furrow Drip
Seasonal ETc (in.) 29.6 24.8
Applied water (in.) 40.1 24.6 Yield (ton/acre) 52.0 36.2 Soluble solids (%) 5.2 * WUE (ton/acre/in.) 1.76 1.45 * Data not available.
Water-use efficiency. Water-use ef-ficiency, defined as the ratio of yield to ETc, ranged from 1.29 tons (2002 furrow) to 2.67 tons (H2003) per acre per inch. The average water-use efficiency was 1.52 and 1.86 tons per acre per inch for furrow and drip irrigation, respectively, but these values were not statistically different (t-test, level of significance = 0.05).
It has been hypothesized that the sea-sonal ETc of subsurface drip irrigation may be smaller than that of furrow irri-gation due to reduced evaporation from the soil. The only previous study found on this matter showed little difference in seasonal ETc — measured with lysime-ters — between surface drip and furrow irrigation of processing tomatoes (Pruitt et al. 1984).
The only conclusion that can be drawn from our current study is that evaporation under subsurface drip ir-rigation may be smaller during the early growth stage compared to furrow irriga-tion, as shown by the furrow and drip ETc data for 2001. For the furrow system, relatively high ETc due to evaporation from the wet soil surface occurred
dur-ing the stand-establishment sprinkler irrigation and during furrow irrigations at the canopy development stage, as evidenced by the spikes in the ETc data
(fig. 1). During those irrigations, wet -ting of the soil surface occurred across the bed width. In contrast, little wetting occurred with the subsurface drip sys-tem. Cumulative ETc at the end of can-opy development was 4.6 inches higher for the furrow system as compared to the subsurface drip system. Similar be-havior, however, was not found for the 2002 and 2004 furrow systems. These systems were managed so that soil-sur-face wetting was minimal, reducing the evaporation component of ETc during canopy development.
Seasonal trends. In 2002, the seasonal ETc for drip irrigation was 2.1 inches more than that for furrow irrigation. Contributing factors were the longer crop season of the drip system as well as reduced evaporation during furrow irrigation at the early growth stages due to limited surface wetting during furrow irrigation. The 2004 data showed higher seasonal furrow ETc when compared to seasonal drip ETc. However, this differ-ence was partly due to different planting times and problems with the stand estab-lishment in the drip system.
Efficient irrigation scheduling
The seasonal ETcs that we calculated are similar to those reported by Fereres and Puich in 1981. Therefore, the 53% increase in processing tomato yields since the mid-1970s has not increased the seasonal ETc. Instead, the average
water-use efficiency of processing toma -toes has increased by about 50% during the same period (from 0.93 to 1.42 tons per acre per inch). For the same amount of water per acre, much higher tomato yields are being obtained today com-pared to those of 35 years ago.
It is unlikely that converting from furrow to drip irrigation in processing tomatoes will reduce seasonal ETc. While some reduction in water use may occur during the early growth stages, as shown by the 2001 data, the 2002 and 2004 data showed that evaporation under furrow irrigation can be reduced. Stand estab-lishment with subsurface drip irrigation may reduce ETc during the initial growth stage compared to sprinkler irrigation, but this approach is feasible only for
transplanted fields. There is little or no opportunity for reduced drip ETc during midseason because for a given year, simi-lar midseason crop coefficients occurred with both irrigation methods.
To provide sufficient water to meet crop ETc requirements, we recommend that processing tomato growers sched-ule irrigations using either the relation-ship between canopy coverage and coefficients along with ETo data, or the
family of curves in figure 5.
B.R. Hanson is Extension Irrigation and Drainage Specialist, and D.M. May is Postgraduate Re-searcher and Cooperative Extension Farm Advisor Emeritus, Department of Land, Air and Water Resources, UC Davis. We appreciate the funding provided by CalFed and the Department of Land, Air and Water Resources, UC Davis; the technical assistance of Ted Hsiao and Tony Matista, Depart-ment of Land, Air and Water Resources, UC Davis; and the cooperation of Farming D and Harris Farms, Five Points, Calif.
References
Allen RG, Pereira LS, Raies D, Smith M. 1998. Crop Evapotranspiration: Guidelines for Computing Crop Wa-ter requirements. FAO Irrigation and Drainage Paper 56. United Nations, Rome.
[CTGA] California Tomato Growers Association. 2005. California Tomatoes For Processing. www.ctga. org/newctga/production.htm.
Fereres E, Puech I. 1981. Irrigation Scheduling Guide. California Department of Water Resources, Sacramento, CA.
Hanson, B. May D. 2003. Drip irrigation increases tomato yields in salt-affected soil of San Joaquin Valley. Cal Ag 57(4):132–7.
Hsiao TC, Henderson DW. 1985. Improvement of crop coefficients for evapotranspiration. In: California Irrigation Management Information System Final Report, June 1985.
May D, Hanson B. 2004. Variety Versus Moisture Stress in Drip Irrigated Tomatoes in 2004. Report submit-ted to California tomato processors; contact authors for more information.
Phene CJ, McCormick RL, Miyamoto JM. 1985. Evapotranspiration and crop coefficient of trickle- irrigated tomatoes. Proceedings of the Third Interna-tional Drip/Trickle Irrigation Congress, Nov. 18–21, 1985. Fresno, CA.
Pruitt, WO, Fereres E, Martin PE, et al. 1984. Micro-climate, evapotranspiration, and water-use efficiency for drip-and furrow-irrigated tomatoes. Twelfth International Congress on Irrigation and Drainage, International Com-mission on Irrigation and Drainage. Fort Collins, CO. May 28–June 2, 1984.
Pruitt WO, Lourence FJ, Von Oettingen S. 1972. Wa-ter use by crops as affected by climate and plant factors. Cal Ag 26(10):10–4.
[USDA] US Department of Agriculture. 2005. Veg-etables 2004 Summary. National Agricultural Statistics Service. http://usda.mannlib.cornell.edu/reports/nassr/ fruit/pvg-bban/vgan0105.pdf.