International Conference on Mechanical Engineering Research (ICMER2013), 1-3 July 2013 Bukit Gambang Resort City, Kuantan, Pahang, Malaysia Organized by Faculty of Mechanical Engineering, Universiti Malaysia Pahang Paper ID: P013
1
DIVERSITY MODELLING FOR ELECTRICAL POWER SYSTEM SIMULATION
Rina Mohd Sharip1, Mohamad Abu Ubaidah Amir2
1
Faculty of Electrical & Electronic Engineering, Universiti Tun Hussein Onn Malaysia, 86400 Parit Raja, Batu Pahat Johor, Malaysia
Phone: +607-4533885 Email: [email protected] 2
Faculty of Science and Defence Technology, Universiti Pertahanan Nasional Malaysia, Kem Sungai Besi, 57000 Kuala Lumpur, Malaysia.
Phone: +603 90513400 ext 7622040 Email: [email protected]
Abstract
This paper is consider diversity of generation and demand profiles against the different future energy scenarios and evaluate these on a technical basis. Compared to previous studies, this research applied a forecasting concept based on possible growth rates from publically electrical distribution scenarios concerning the UK. These scenarios were created by different bodies considering aspects such as environment, policy, regulation, economic and technical. In line with these scenarios, forecasting is on a long term timescale (up to every ten years from 2020 until 2050) in order to create a possible output of generation mix and demand profiles to be used as an appropriate boundary condition for the network simulation. The network considered is a segment of rural LV populated with a mixture of different housing types. The profiles for the „future‟ energy and demand have been successfully modelled by applying a forecasting method. The network results under these profiles shows for the cases studied that even though the value of the power produced from each Micro-generation is often in line with the demand requirements of an individual dwelling there will be no problems arising from high penetration of Micro-generation and demand side management for each dwellings considered. The results obtained highlight the technical issues/changes for energy delivery and management to rural customers under the future energy scenarios.
Keywords: Demand side management (DSM); Low voltage (LV) network; Micro-generation (MG); Scenarios writing.
INTRODUCTION
2
panels and micro-wind turbines) are believed to be able to increase the efficiency of local energy production and thusly help reduce carbon emissions (Peter Richardson et al., 2009, Ian Richardson, 2009). Also with the help of widespread demand side management (DSM) such as smart metering and direct load control, storage devices (e.g. electric vehicles (EVs)) and changes in consumer behaviour further impacts can be made on the electricity sector‟s targets.
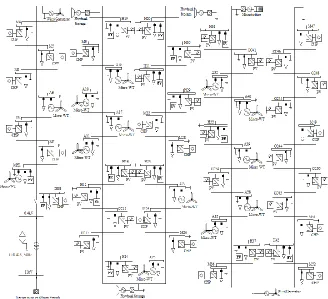
This position requires changes to both the operation and management of the electrical system, several options identified will see a gradual shift from large centralised power plants to smaller and more distributed generators (Arturo. D. , April 2009). Such a change would have many implications for the existing distribution networks in terms of management and control. It is therefore important to examine how the networks in the UK today would respond to a move towards large-scale deployments of MG and adoption of DSM. Figure 1 shows an example of a future rural network with large penetrations of MG and energy storage. The analysis of the behaviour of such a system requires the modelling of both the electrical distribution system and the coupled MG devices in a realistic context. The remainder of the paper provides a review of relevant literature outlines the modelling approach adopted and applies this to a UK rural Zero Carbon Community network example. Finally simulation results are presented and conclusions and further work are given.
LITERATURE REVIEW
There are a number of previous studies that have investigated the impacts of a large penetration of MG (Peter Richardson and Andrew Keane, 2009) and DSM (Ian Richardson, 2009) on the distribution network system. Those and other studies generally addressed the network concerns in the problem; those of voltage imbalance (M Thomson and D Infield, 2008, Ian Richardson, 2009), quality of power (M Thomson and D Infield, 2008), voltage regulation, potential increases in network fault level and the breach of thermal constraints. However, the generation and demand data and how this data has been modelled for all these studies were different. Hence this study provides details about an integrated simulation approach to modelling the network and pays particular attention to how the diversity in the generation and demand profiles of these aspects will affect future system behaviour.
3
Figure 1. Example of simplified low voltage network with large penetrations of micro-generation and demand side management
Figure 2. Changes of modelling approach from foundation paper (G M Burt et al., 2008)
MODELLING APPROACH
4
et al., 2008, C N Jardine and G W Ault), HiDEF (Consortium, [EPSRC], Brenda Boardman) and DECC (DECC [Department of energy and climate change], National strategy for climate and energy, 20 July 2009) scenarios which are all developed by considering several aspects such as the environment, policy, regulation and economic and technical factors.
A. Micro-generation and Demand profiles; UKGDS
In order to provide a more realistic appraisal of likely system performance, the half-hourly interval data of United Kingdom Generic Distribution Systems (UKGDS) network case study data set (United kingdom generic distribution system (UKGDS)) was applied as the basis for the profiles used in this research in order to give an accurate result for the load flow simulation studies and form accurate diversity profiles. The demand and generation profiles of UKGDS are then forecasted based on the growth rate(s) which are developed in line with the future distribution scenarios in the UK so as to create a large population of diverse devices and provide appropriate boundary conditions suitable for network studies. The practicality of the approach is demonstrated through its application to the analysis of the Zero Carbon Community network in this paper.
B. Publicly available electrical distribution scenarios in the UK
As part of this research work the authors‟ own future scenarios for 2050 have been considered based on the possible growth rates from publically available electrical distribution scenarios in the UK. Here are the summary of these different future scenarios:
1) HDPS (Highly Distributed Power Systems) scenarios
These scenarios were created by the consortium of UK Universities and industrial partners funded by the EPSRC which considered the control and design for future power systems(Consortium) with many distributed generation connections. It illustrate the scale of change required to reduce carbon emissions by 60% by 2050 (C N Jardine and G W Ault) in line with UK targets at the time.
2) LENS (Long- term Electricity Network Scenarios)
The project was undertaken by OFGEM under its commitment to look at a range of future scenarios for electricity networks that could arise as a consequence of market and policy developments (OFGEM). Together with OFGEM the LENS project team consisted of University of Strathclyde, Policy Studies Institute (PSI), University of Westminster and SPRU (Science and Technology Policy Research), University of Sussex (OFGEM, December 2007).
3) DECC scenarios (UK Low Carbon Transition Plan)
These scenarios were developed by the Department of Energy and Climate Change (DECC) (DECC [Department of energy and climate change]) and contain a comprehensive low carbon transition plan to 2020 which sets out how to deliver emission cuts of 18% on 2008 levels by 2020 and over a one third reduction on 1990 levels.
4) HiDEF (Highly Distributed Energy Futures) scenarios
5
energy resources (DERs) and thus contributes to global ambition towards a low carbon future”(Consortium).
C. Forecasting scenarios for 2050
This research is conducted to improve the stochastic load and generation modelling method used by Galloway (2008), in which sample power generation time series profiles were processed and replicated in order to create a large population of diverse devices and provide appropriate boundary conditions suitable for network simulation as shown in figure 2. Contrastingly in this research, the method considered utilises a forecasting technique to account for diversity in future generation and load that becomes boundary conditions in network simulation study.
Previous studies that have employed forecasting of the load and demand profile in the power system area but most of these studies run on short and medium timescales (G.A. Adepoju, 2007). The work in this paper will focus on long term forecasting, typically 40 years, which means there is a need to implement a suitable forecasting method for this long term horizon. Based on (Chris Chatfield) forecasting methods are broadly classified into two groups i) Quantitative, also known as Univariate and Multivariate and ii) Qualitative, which is known as „expert judgement „or subjective.
[image:5.595.87.512.499.681.2]The qualitative forecasting method, or scenarios writing, was the best choice for this research as this method is suitable for a long term forecasting period of up to 40 years. Moreover this scenarios writing method has been successfully applied in the power system area (R. Ghanadan and J.G. Koomey, 2005; C. E. T. Foote et al., 2005; I.M. Elders et al., 2005). Based on (R. Ghanadan and J.G. Koomey, 2005) scenarios writing provides a set of alternative contexts for exploring different ways that a future may unfold. Moreover, it is a unique technique as it can explore a range of possible outcomes resulting from uncertainty; in contrast with the quantitative forecasting method which aims to identify the most likely pathway and estimate uncertainties. Nevertheless, quantitative forecasting models are most efficient when under conditions such that extensive information is available and the understanding of governing is high.
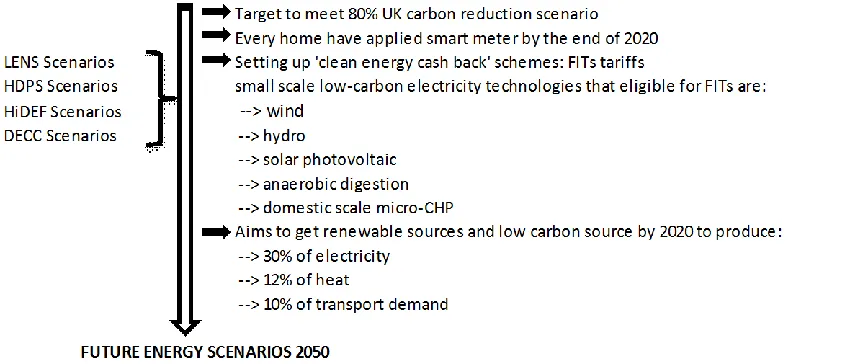
Figure 3. Forecast scenarios for future „smart networks‟ 2050 based on publically available electrical distribution scenarios in the UK
6
J.G. Koomey, 2005). This statement was supported in (Craig, 2002) which asserted that in a recent review of energy forecasting of the US in the last 50 years illustrated that the historical forecasts have regularly failed to represent actual conditions by systematically overestimating consumption and underestimating uncertainty. As stated in modelling approach section, the forecast scenarios were created by considering several aspects such as environment, policy, regulation, economic and technical issues across the published scenarios (LENS, HDPS, DECC and HiDEF). As such, there are four main points for future 2050 scenarios have been successfully created by the author; as shown in figure 3.
D. Rate forecast for 2020
1) Micro-generation profiles
Paper (C. E. T. Foote et al., 2005) designed a questionnaire to collect opinions on the suitability of different DG technologies to different LV grid condition and from this method the authors have identified the top three ranked technologies in each of the LV grid scenarios for 2010 and 2020. Since this paper more focuses in the future scenarios (2020 until 2050) the result for 2020 only will be considered in this research; based on this paper, photovoltaics emerged as the dominant technologies in 2020 and followed by reciprocating engines and wind turbines. Moreover, as one of the main points for „future energy scenarios for 2050‟ in figure 3 above; the „clean energy cash-back‟ scheme which also called FITs tariffs will be adopt in the UK and the eligible small-scale low carbon electricity technologies for this FITs tariff are Wind turbine, Solar photovoltaics (PV), Hydro, Anaerobic digestion and Domestic scale micro-CHP. Thus, based on these statements the Photovoltaics, Wind turbine and Micro-CHP have been chosen as the top three ranked technologies that suit the best for this research.
The „prioritized but arbitrary assignment‟ method from paper (C. E. T. Foote et al., 2005) have been applied and altered to be suit with the case of this research in order to produce the growth rate(s) value. From the four mains points for future 2050 scenarios as shown in figure 3, the total percentages of energy value that need to come from the renewable source and low carbon sources by 2020 is 42%. Thus, the total growth rate(s) of each micro-generation that have been considered in this research could be split between them. The split could be based on an arbitrary division, with the top-ranked technology taking, say, half. Then the second ranked taking a third and the third ranked taking a sixth (C. E. T. Foote et al., 2005). This arbitrary value of growth rate(s) between technologies would produce realistic and useable scenarios for micro-generation profiles as summaries in more detail in table 1. From these scenarios and the methodologies laid out in (C. E. T. Foote et al., 2005) and (G M Burt et al., 2008), the growth rate(s) of micro-generation profiles for Photovoltaics, Micro-Wind Turbines and Micro-CHP as well as demand profiles for Smart Meters and Electric Vehicles were forecast and created as shown in figure 4.
2) Demand profiles
7
[image:7.595.84.512.214.361.2]the UK will be reduced to 50% and this reduction rate(s) were predicted to be consistent until 2050. Electric vehicle‟s percentage for 2020 was also created by considered one of the main points as created in „future energy scenarios 2050‟; as shown in figure 3. By targeting 10% of transport demand need to come from the renewable source and low carbon sources by 2020, this research applied 10% as a growth rate(s) value for demand profiles as represent the adoption of Electric vehicle in the network studies.
Table 1. Defining growth rate(s) for micro-generation penetration in 2020
Micro-generation Technologies
Division Percentage of growth rates for MG from 42%
Solar Photovoltaic
50% 21%
Micro Wind
Turbine 33% 14%
Micro CHP 17% 7%
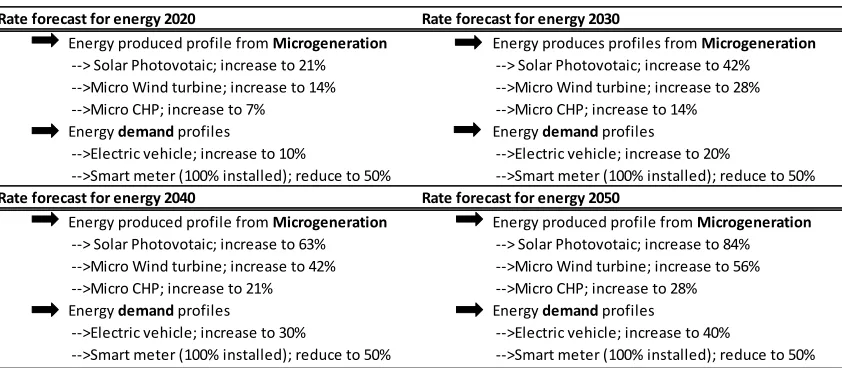
[image:7.595.90.511.496.680.2]Since objective of this research is to model and forecast the future profile; 2020 until 2050. Thus, the growth rate(s) in table 1 were used as a base growth rate(s) which it is expected that every 10years the value of growth rate(s) for the profile will be double the rate(s) of the base growth rate(s) as shown in table 2 aligned with the forecast scenarios for „future‟ energy systems in figure 3.
Table 2. Micro-generation and demand side management penetration forecast rates for future energy through to 2050
SIMULATIONS
A. Micro-generation and demand profile
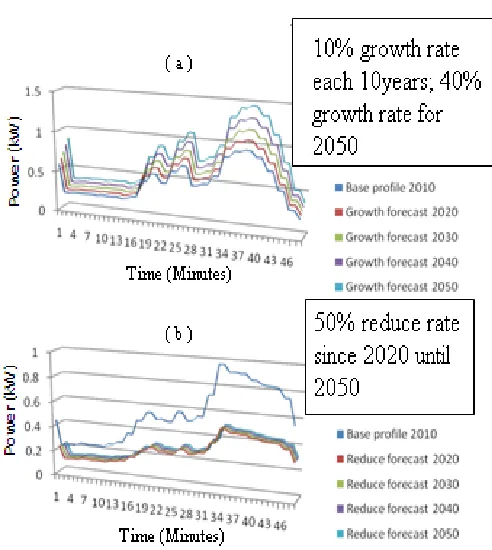
Figures 4 and 5 show the original 10 year UKGDS forecast profiles based on growth rate(s) created previously (United kingdom generic distribution system (UKGDS)). The
Rate forecast for energy 2020 Rate forecast for energy 2030
Energy produced profile from Microgeneration Energy produces profiles from Microgeneration
--> Solar Photovotaic; increase to 21% --> Solar Photovotaic; increase to 42% -->Micro Wind turbine; increase to 14% -->Micro Wind turbine; increase to 28% -->Micro CHP; increase to 7% -->Micro CHP; increase to 14%
Energy demand profiles Energy demand profiles
-->Electric vehicle; increase to 10% -->Electric vehicle; increase to 20%
-->Smart meter (100% installed); reduce to 50% -->Smart meter (100% installed); reduce to 50%
Rate forecast for energy 2040 Rate forecast for energy 2050
Energy produced profile from Microgeneration Energy produced profile from Microgeneration
--> Solar Photovotaic; increase to 63% --> Solar Photovotaic; increase to 84% -->Micro Wind turbine; increase to 42% -->Micro Wind turbine; increase to 56% -->Micro CHP; increase to 21% -->Micro CHP; increase to 28%
Energy demand profiles Energy demand profiles
-->Electric vehicle; increase to 30% -->Electric vehicle; increase to 40%
8
final profiles have been produced by forecasting the original profile data from UKGDS for every 10 years based on the growth rate of the publically available scenarios of electrical distribution system in the UK research which used as a boundary conditions in the network simulation studies.
B. Overview of the network modelled
[image:8.595.158.436.323.624.2]Power flow studies were run in order to investigate the effects of high penetrations of MG and DSM on the future „smart network‟. The network was implemented using DIgSILENT Powerfactory V14.0 software and was used as a test-bed study for this research. By modelling individual dwellings network security issues such as under and over voltage, power quality and reverse power flow for each dwelling could be explored in more detail. Here, the example of a Zero Carbon Community network (Figure 1) was designed with the main terminal connected to the three-phase network and each load was connected to single phase network with an underground cable. The load and generation profiles were developed and forecast by the process described above and were installed in each dwelling of the network. The high-level characteristics of this model are its long circuit length, low customer density, radial topology and large overall size.
Figure 4. Forecasting growth rates for half-hourly interval of power production data of a day after the adoption of (a) solar photovoltaic (b) Micro-Wind turbine and (c)
9
Figure 5. Forecasting rates for half-hourly interval of demand unrestricted data of a day after the adoption of (a) Electric vehicle and (b) Smart meter demand data for 2050
RESULTS AND DISCUSSION
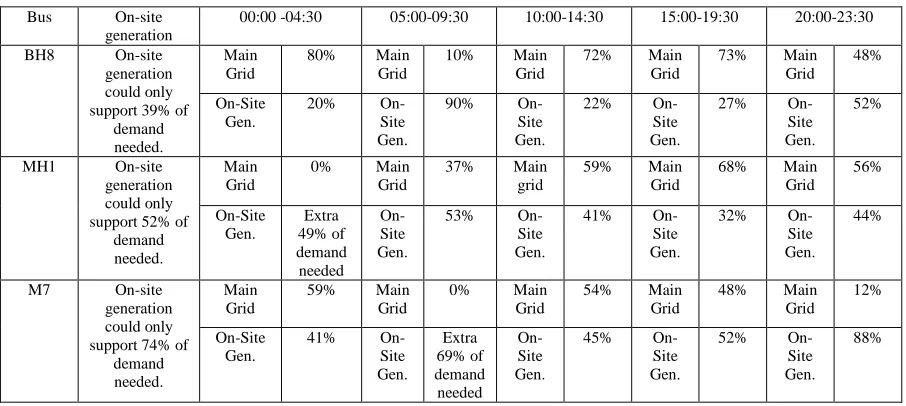
[image:9.595.92.513.544.708.2]Studies have been conducted for the network and details of the results are shown in figure 6 until 9 and the summaries of the result shown in Table 3. The results from table 3 identify that the demand across each of the time periods cannot totally be met by the configuration of onsite generation. Electrically the network is balanced in terms of power quality measures (see figure 6) although loads and generation were installed in a different phase of each bus. This balance is largely achieved because the network still has support from the main grid enabling shortfalls in generation to be covered.
10
[image:10.595.91.518.83.379.2]Figure 7. The results of voltages between different phase (A, B, C) and (b) power between load and micro-generators in the bus BH8 in the network
[image:10.595.92.518.436.693.2]11
Figure 9. The results of (a) voltages between different phase (A, B, C) and (b) power between load and micro-generators in the bus M7 in the network
Table 3. Result of power flow analysis for selected of dwelling/bus in the network
Bus On-site generation
00:00 -04:30 05:00-09:30 10:00-14:30 15:00-19:30 20:00-23:30
BH8 On-site generation could only support 39% of
demand needed.
Main Grid
80% Main Grid
10% Main Grid
72% Main Grid
73% Main Grid
48%
On-Site Gen.
20% On-Site Gen.
90% On-Site Gen.
22% On-Site Gen.
27% On-Site Gen.
52%
MH1 On-site generation could only support 52% of
demand needed.
Main Grid
0% Main Grid
37% Main grid
59% Main Grid
68% Main Grid 56% On-Site Gen. Extra 49% of demand needed On-Site Gen.
53% On-Site Gen.
41% On-Site Gen.
32% On-Site Gen.
44%
M7 On-site generation could only support 74% of
demand needed.
Main Grid
59% Main Grid
0% Main Grid
54% Main Grid
48% Main Grid
12%
On-Site Gen.
41% On-Site Gen. Extra 69% of demand needed On-Site Gen.
45% On-Site Gen.
52% On-Site Gen.
88%
CONCLUSIONS AND FURTHER WORK
[image:11.595.80.533.420.623.2]12
voltage values, each phase of the network remains balanced. As the network still has the support from the main grid enabling shortfalls in generation to be balanced through imports. Thus, this paper shown that there will be no problems arising from high penetration of Micro-generation and Demand side management for each dwelling in the community network as long as the network has the support from the main grid.
The „smart network‟ considered here might look advanced compared to the existing infrastructure and management but in line with the future scenarios such systems may appear bringing with them a challenge for the network operator and the future. This research has a special contribution to our country as the energy scenarios in Malaysia have been subject to tremendous change from the 8th Malaysia Plan (2001-2005) until the current plan, the 10th Malaysia Plan (2011-2015). Oil and gas have traditionally been the main energy sources in Malaysia, however, with its gas reserves estimated to last only another 33 years and oil for only 19 years, the Malaysian government has been strengthening the role of renewable energy (RE), as the fifth main energy source as noted in (UniMAP, wteconsult). Moreover, this research may help the Malaysian government in obtaining a clearer viewpoint regarding the implication of an increased penetration of generation coming from renewable sources to Malaysia‟s network system.
REFERENCES
[EPSRC], E. A. P. S. R. C. Engineering and physical sciences research council [Online]. Available: http://Gow.Epsrc.Ac.Uk/Viewgrant.Aspx?Grantref=Ep/G031681/1 [Accessed may 2012].
Arturo. D. . April 2009. A multi-objective planning framework for analysing the integration of
distributed energy resources. A Thesis Degree of Doctor of Philosophy, University of
Strathclyde, Glasgow.
Brenda Boardman. ‘Home truths: a low carbon strategy to reduce UK housing emissions by
80% by 2050’ [Online]. Available:
http://www.foe.co.uk/resource/reports/home_truths.pdf [Accessed may 2012]. C N Jardine and G W Ault Scenarios for examination of highly distributed power systems,.
Proceeding of the Institution of Mechanical Engineers, Part A: Journal of Power and
Energy, 222, 643-655.
C. E. T. Foote et al. 2005. Developing Distributed Generation Penetration Scenarios.
International Conference on Future Power Systems, 6.
Chris Chatfield (ed.) ‘The analysis of time series; an introduction’: Chapman & Hall/Crc. CONSORTIUM, S. SUPERGEN: Highly distributed energy future [Online]. Available:
http://www.supergen-hidef.org/Pages/Home.aspx [Accessed may 2012].
Craig, P. P. E. A. 2002. Annual Review of Energy and the Environment,What Can History Teach Us? A Retrospective Examination of Long-Term Energy Forecasts for the US. DECC [Department of Energy and Climate change]. Department of energy and climate change
[Online]. Available: http://www.decc.gov.uk [Accessed may 2012].
G M Burt, I M Elders, S J Galloway, N J Kelly & R M Tumilty 2008. Assessment of highly distribution power systems using an integrated simulation approach. Proceeding of the
Institution of Mechanical Engineers, Part A:Journal of Power and Energy, 222,
657-668.
G.A. Adepoju, S. O. A. O. A. K. O. A. 2007. Application of neural network to load forecasting in Nigerian electrical power system. The Pacific Journal Of Science And Technology, 8. I.M. Elders et al. 2005. Identification of Long-term Scenarios of Electricity Network
13
Ian richardson, M. T., David Infield and Alice delahunty, 2009. A modelling framework for the study of highly distributed power systems and demand side management. International
Conference on Sustainable Power Generation and Supply ‘SUPERGEN’09’, 1-6.
Kamalanath Samarakoon et al. 2009. Demand side primary frequency response support through smart meter control. Universities Power Engineering Conference (UPEC),Proceedings of the 44th International, 1.
M Thomson and D Infield 2008. Modelling the impact of micro-combined heat and power generators on electricity distribution networks. Proceeding of the Institution of
Mechanical Engineers, Part A: Journal of Power and Energy, 222, 697-706.
National Strategy for Climate and Energy 20 July 2009. The UK low carbon transition plan. OFGEM. Long term electricity scenarios (Lens), [Online]. Available:
http://www.ofgem.gov.uk/Networks/Trans/Archive/ElecTrans/LENS/Pages/LENS.aspx [Accessed 10 may 2012].
OFGEM. December 2007. Long term electricity network scenarios (lens), Second Workshop
[Online]. Available:
http://www.ofgem.gov.uk/Networks/Trans/Archive/ElecTrans/LENS/Documents1/Pres entation1.pdf [Accessed may 2012].
Peter Richardson and Andrew Keane 2009. Impact of high penetrations of micro-generation on low voltage distribution networks. 20th International Conference On Electricity
Distribution Prague, 0172.
Peter richardson et al. 2009. Impact of high penetrations of micro-generation on low voltage distribution networks. 20th International Conference On Electricity Distribution
Prague, 0172.
R. Ghanadan and J.G. Koomey 2005. Energy Policy, Using Energy Scenarios to Explore Alternative Energy Pathways in California.
Timothy J. Foxon, Geoffrey P. Hammond & Peter J.G. Pearson October 2010. Developing transition pathways for a low carbon electricity system in the UK. Technological
Forecasting and Social Change, 77, , 1203-1213.
UNIMAP. Renewable Energy and Kyoto Protocol: Adoption in Malaysia [Online]. Available: http://publicweb.unimap.edu.my/~ppkas/home/index.php/news/articles/29-renewable-energy-and-kyoto-protocol-adoption-in-malaysia [Accessed may 2012].
United Kingdom Generic Distribution System (UKGDS). United kingdom generic distribution
system [Online]. Available: http://Monaco.Eee.Strath.Ac.Uk/Ukgds [Accessed may
2012].
Willet Kempton et al. 1997. Electric vehicle as a new power source for electric utilities. Elsevier
Science Ltd, 2, 157-175.
WTECONSULT. Renewable Energy Scenarios in Malaysia [Online]. Available: