Journal of Chemical and Pharmaceutical Research, 2014, 6(1):654-663
Research Article
ISSN : 0975-7384
CODEN(USA) : JCPRC5
Mass transfer coeffcient effect on vacuum drying process of porous
medium modeling
Lili Zhao
1, Zhijun Zhang
2, Shiwei Zhang
2and Wenhui Zhang
21
School of Mechanical Engineering, Shenyang University, Shenyang, China
2
School of Mechanical Engineering and Automation, Northeastern University, Shenyang, China
_____________________________________________________________________________________________
ABSTRACT
As the basic unit operation in chemical industry, drying is the key process in chemical, food and other related industry process. A lot of modeling methods and simulation technology has been used to reveal the heat and mass transfer process The parameters of modeling are very important because the simulation results are decided by them. The mass transfer coefficient is condition boundary that is very difficult to gotten. Based on the theory of heat and mass transfer, a coupled model for the porous medium vacuum drying process is constructed. The model is implemented and solved using COMSOL software. The parameter sensitivity analyses of mass transfer coefficient were then examined. The temperature, pressure and moisture characteristics were shown.
Key words: heat and mass transfer; porous medium; sensitivity analyses; vacuum drying; COMSOL;
_____________________________________________________________________________________________
INTRODUCTION
As the basic unit operation in chemical industry, drying is the key process in chemical, food and other related industry process. The corn drying is used the air drying usually, but the vacuum drying has been used to corn in china [1–3]. Hypothesized the corn as the porous medium, the vacuum drying of corn is a complicated heat and mass transfer process. It has been the subject of intensive research [4–7]. A lot of modeling methods and simulation technology has been used to reveal the heat and mass transfer process [8-16]. As the porous medium, the heat and mass transfer in vacuum drying process has been studied with non-equilibrium method by us [17, 18]. In fact, the parameters of modeling are very important because the simulation results are decided by them. The mass transfer coefficient is condition boundary that is very difficult to gotten. But most of the modeling is gotten by the reference [8-11]. It must be clarify the impact of model parameters on the model predictions [19].
EXPERIMENTAL SECTION
PROBLEM DESCRISPTION
A physical one-dimensional (1D) model that explains the drying process is shown in Fig. 1. The heat and mass transfer is considered only in the y direction. The heat transfer is through the bottom surface of medium and mass transfer is through the top surface of medium. The total height of the porous medium is 1 cm.
Assumption
The porous medium consists of a continuous rigid solid phase, an incompressible liquid phase (free water), and a continuous gas phase that is assumed to be a perfect mixture of vapor and dry air, considered as ideal gases. For a mathematical description of the transport phenomenon in a porous medium, we adopt a continuum approach, wherein macroscopic partial differential equations are achieved through the volume averaging of the microscopic conservation laws. The value of any physical quantity at a point in space is given by its average value on the averaging volume centered at this point.
The moisture movement of the inner porous medium is liquid water and vapor movement; that is, the liquid water could become vapor, and the vapor and liquid water are moved by the pressure gradient. The heat and mass transfer theory could be found in everywhere [8].
Figure 1. 1D model of porous medium with cortex
The compressibility effects of the liquid phase are negligible, and the phase is homogeneous:
w
cste
ρ
=
(1)The solid phase is rigid and homogeneous:
s
cste
ρ
=
(2)The gaseous phase is considered an ideal gas. This phase ensures that
T
R
P
m
a aa
=
ρ
(3)T
R
P
m
v vv
=
ρ
(4)v a
g
P
P
P
=
+
(5)v a
g
ρ
ρ
ρ
=
+
(6)The assumption of the local thermal equilibrium between the solid, gas, and liquid phases involves
s g w
T
=
T
=
T
=
T
(7)bottom
y
GOVERNING EQUATIONS Mass balance equation
Mass conservation equations are written for each component in each phase. Given that the solid phase is rigid, the following is given:
0
=
∂
∂
t
sρ
(8)The averaged mass conservation of the dry air yields
0
)
(
)
(
=
⋅
∇
+
∂
⋅
∂
a a a gV
t
S
ρ
ρ
ε
(9) For vapor,I
V
t
S
v v v g&
=
⋅
∇
+
∂
⋅
∂
)
(
)
(
ρ
ρ
ε
(10)For free water,
(
)
(
)
w w w wS
V
I
t
ε
ρ
ρ
∂ ⋅
+ ∇ ⋅
= −
∂
&
(11)For water, the general equation of mass conservation is obtained from the sum of the conservation equations of vapor (v) and free water (l). The general equation is written as follows:
1
(
w w v v)
0
sW
V
V
t
ρ
ρ
ρ
∂ +∇⋅
+
=
∂
(12)(1
)
w w g v
s
S
S
W
ε
ρ
ε
ρ
ε ρ
⋅
+ ⋅
=
−
(13)For the Darcy flow of vapor,
ω
ρ
ρ
ρ
vV
v=
vV
g−
gD
eff⋅
∇
(14)For the Darcy flow of air,
ω
ρ
ρ
ρ
aV
a=
aV
g+
gD
eff⋅
∇
(15)The vapor fraction in mixed gas is given by
g v
ρ
ρ
ω
=
(16)The saturation of free water and gas is
1
g w
S
+
S
=
(17)Momentum balance equation
Where the gas and free water velocity is given by
, ,
(
)
in g r g
g g g
g
k
k
V
P
ρ
g
µ
⋅
= −
⋅ ∇ −
r
(18), ,
(
)
in w r w
w w w
w
k
k
V
P
ρ
g
µ
⋅
The pressure moving the free water is given by
w g c
P
=
P
−
P
(20)Energy balance equation
By considering the hypothesis of the local thermal equilibrium, the energy conservation is reduced to a unique equation:
(
a a a a v v v v w w w w)
(
e)
T
V C T
V C T
V C T
k
T
I
t
ρ
ρ
ρ
ρ
λ
∂
+ ∇ ⋅
+
+
= ∇
⋅∇ − ⋅
∂
&
(21)(1
)
(
(
(1
)
))
e s w g v a
k
= −
ε
k
+
ε
S
+
S
ω
k
+ −
ω
k
(22)s s g a a g v v w w w
T
T
S
T
S
T
S
T
ρ
=
ρ
+ ⋅
ε
ρ
+ ⋅
ε
ρ
+ ⋅
ε
ρ
(23)Boundary and Initial Conditions
The model was run for different parameters. It was heated from the bottom, and the air and vapor was escaped from the top surface. The other boundaries of the model are insulated and impermeable. The boundary conditions are then given as:
B.C. for Eq. (9):
, ,
a top a dryer
ρ
=
ρ
(24)B.C. for Eq. (10) [15]:
,
(
, ,)
v top m g v top v dryer
n
= −
h
ε
S
ρ
−
ρ
(25)B.C. for Eq. (15):
,
(
, ,)
w top m w v top v dryer
n
= −
h
ε
S
ρ
−
ρ
(27)B.C. for Eq. (21) in bottom:
bottom h
T
=
T
(29)B.C. for Eq. (21) in top:
, ,
(
) (
)
top ext w w top v v top
q
=
h T
−
T
+ +
λ
C T n
+
C Tn
(30)The initial moisture of the porous medium is represented by the liquid water saturation. And other initial condition is as follows.
I.C. for Eq. (9):
,0 ,0 0 amb a a a
P
M
RT
ρ
=
ρ
=
(31)I.C. for Eq. (10):
,0 ,0 0 sat v v v
P
M
RT
ρ
=
ρ
=
(32)I.C. for Eq. (11):
,0
w w
S
=
S
(33)0
T
=
T
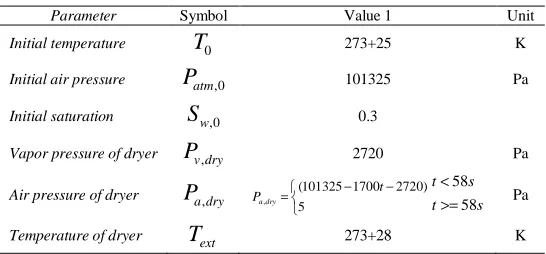
(34) [image:5.595.162.435.173.300.2]The detail value of boundary and initial condition is show in Table 1.
Table 1. Boundary and initial condition
Parameter Symbol Value 1 Unit
Initial temperature
T
0 273+25 KInitial air pressure
P
atm,0 101325 PaInitial saturation
S
w,0 0.3Vapor pressure of dryer
P
v dry, 2720 PaAir pressure of dryer
P
a dry, ,(101325 1700 2720) 5
a dry
t
P = − −
58 58
t s t s
<
>= Pa
Temperature of dryer
T
ext 273+28 KNUMERICAL SOLUTION
A two-dimensional (2D) grid was used to solve the equations using COMSOL Multiphysics 3.5a. Given the symmetry condition setting at the left and the right sides, the 2D is applied to the 1D model shown in Fig. 1. The mesh consists of 2 × 100 elements (2D), and time stepping is 0.1 (0 s to 10 s of solution), 1 (10 s to 100 s of solution), 10 (100 s to 10000 s of solution), 20 (10000 s to 20000 s of solution), 50 (20000 s to 20000 s of solution). Several grid sensitivity tests were conducted to determine the sufficiency of the mesh scheme and to ensure that the results are grid-independent. The maximum element size was established as 1e-4. A backward differentiation formula was used to solve time-dependent variables. Relative tolerance was set to 1e-6, whereas absolute tolerance was set to 1e-6. The simulations were performed using a Tongfang PC with Intel Core 2 Duo processor with 3.0 GHz processing speed, and 4096 MB of RAM running Windows 7.
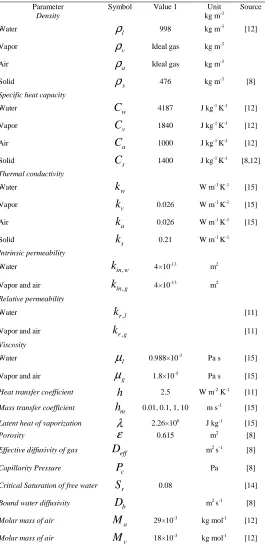
INPUT PARAMETER
Table 2. Parameters used in the simulation process
Parameter Symbol Value 1 Unit Source
Density kg m-3
Water
ρ
l 998 kg m-3 [12]Vapor
ρ
v Ideal gas kg m-3Air
ρ
a Ideal gas kg m-3Solid
ρ
s 476 kg m-3 [8]Specific heat capacity
Water
C
w 4187 J kg-1 K-1 [12]Vapor
C
v 1840 J kg-1 K-1 [12]Air
C
a 1000 J kg-1 K-1 [12]Solid
C
s 1400 J kg-1 K-1 [8,12]Thermal conductivity
Water
k
w W m-1 K-1 [15]Vapor
k
v 0.026 W m-1 K-1 [15]Air
k
a 0.026 W m-1 K-1 [15]Solid
k
s 0.21 W m-1 K-1Intrinsic permeability
Water
k
in w, 4×10-13 m2Vapor and air
k
in g, 4×10-13 m2Relative permeability
Water
k
r l, [11]Vapor and air
k
r g, [11]Viscosity
Water
µ
l 0.988×10⁻³ Pa s [15]Vapor and air
µ
g 1.8×10⁻⁵ Pa s [15]Heat transfer coefficient
h
2.5 W m-2 K-1 [11]Mass transfer coefficient
h
m 0.01, 0.1, 1, 10 m s-1 [15]Latent heat of vaporization
λ
2.26×10⁶ J kg-1 [15]Porosity
ε
0.615 m2 [8]Effective diffusivity of gas
D
eff m2 s-1 [8]Capillarity Pressure
P
c Pa [8]Critical Saturation of free water
S
r 0.08 [14]Bound water diffusivity
D
b m2 s-1 [8]Molar mass of air
M
a 29×10-3 kg mol-1 [12]Molar mass of air
M
v 18×10-3 kg mol-1 [12]RESULTS AND DISCUSSION
little effect on drying process; the drying process is controlled by inner heat and mass transfer. But when
h
m=0.01, the moisture curve is has larger different. It is shown that the drying process is controlled by outside condition. Compared the all moisture curve, the drying time is almost same includingh
m=0.01. It is shown that the drying process is controlled by inner process during later drying process whenh
m=0.01. The effect of mass transfer coefficient on moisture is so obviously.Figure 2. Moisture curve (d. b.) of different intrinsic permeability
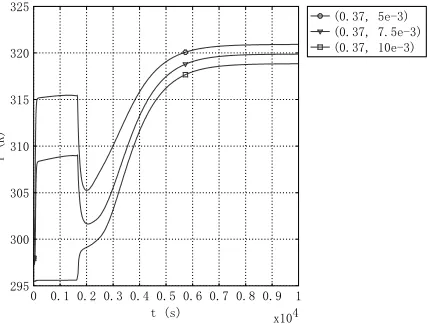
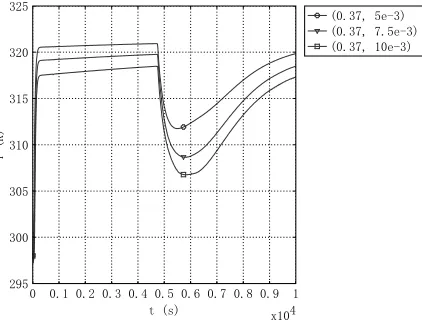
The temperature curve of different mass transfer coefficient at different height (5mm, 7.5mm and 10 mm) was shown in Figure3. Figure4, Figure5 and Figure6. When
h
m=10, 1, and 0.1 m s-1, the temperature curve is almost the same. But the obviously theh
m=0.01 is very different.[image:7.595.193.407.482.645.2]
Figure 4.Temperature curve of different position with
h
m= 1 (height of 5mm, 7.5 mm and 10mm) [image:8.595.194.407.315.477.2]
Figure 5.Temperature curve of different position with
h
m= 0.1 (height of 5mm, 7.5 mm and 10mm) [image:8.595.194.405.515.675.2]In All Figures, the temperature is lift up and maintain some time, and then slowly down. At last, the temperature is slowly lift up and gotten the end temperature. But when,
h
m= 0.01, the temperature is just lift up and maintain long time, and then lift up until gotten the end temperate.CONCLUSION
A coupled model of porous medium vacuum drying with cortex effect based on the theory of heat and mass transfer was implemented in this paper. The parameter sensitivity analyses of mass transfer coefficient were then examined. The moisture and temperature characteristic is gotten. The results are shown that mass transfer coefficient has obviously effect on drying process. It would be affect the mass and heat transfer, and then the temperature curve is shown obviously different. The results has some meaningful for vacuum drying of food and chemical material for heat sensitivity.
Nomenclature
B
diagonal tensorD
diffusivity (m2s-1)eff
D
diffusion tensor (m2s-1)g
gravity vector (m s−2)h
intrinsic averaged enthalpy (J kg−1)I
water phase rate (kg s-1m-3)k
intrinsic permeability (m2)r
k
relative permeabilitym
mass (kg)n
outer unit normal to the productP
pressure (Pa)c
P
capillary pressure (Pa)R
universal Gas constant (J kmol-1K-1)S
saturationt
time (s)T
temperature (K)W
moisture content (in dry basis)Greek letters
H
∆
latent of phase change (J kg-1)ef
λ
effective thermal conductivity tensor (W m−1 K−1)µ
viscosity (kg m−1 s−1)ρ
density (kg m−3)ω
vapor fractionSubscripts
a
dry airg
gasw water
s
solidv
vaporsat
vapor saturationin intrinsic
r relative
Mathematical operators
∆
gradient operator⋅
Acknowledgments
This research was supported by the National Natural Science Foundation of China (Grant Nos. 31000665, 51176027, 31371873, 31300408).
REFERENCES
[1]CH Xu, ZJ Zhang, SW Zhang and X He, Proceedings of the 5th Asia-Pacific Drying, 2007, 1261-1267.
[2]ZJ Zhang, CH Xu, SW Zhang and X He, Proceedings of the 5th Asia-Pacific Drying Conference, 2007,330-337. [3]ZJ Zhang, CH Xu, and SW Zhang, Proceedings of the International Conference on Computer Science and Information Technology, 2008, 534-538
[4]Y Ichikawa, A.P.S. Selvadurai, Transport Phenomena in Porous Media, Aspects of Micro / Macro Behaviour, 2012.
[5]AK Haghi, Theor. Found. Chem. Eng., 2006, 40(1), 14-26. [6]SJ Kowalski, Drying of porous materials, Springer, 2007
[7]J Bear, Y Bachmat, Introduction to Modeling of Transport Phenomena in Porous Media, Springer, 1990. [8]A Erriguible, P Bernada, F Couture, and MA Roques, Chem. Engin. Process., 2007, 46,. 1274-1285. [9]A Erriguible, P Bernada, F Couturea and MA Roques, Drying Technol., 2005, 23(3), 455-472.
[10] K Murugesan, HN Suresh, K. N.Seetharamu, and PA Aswatha NarayanaT Sundararajan, Int. J. Heat Mass Tran., 2001, 44(21), 4075-4086.
[11] P Perré and IW Turner, AIChE Journal, 2006, 52(9), 3109-3117.
[12] SS Torres, W Jomaa, JR Puiggali and S Avramidis, Appl. Math. Model., 2011, 35(10), 5006-5016.
[13] SS Torres, JR Ramírez and LL Méndez-Lagunas, Chem. Biochem Engin. Quart., 2011, 25(3), 327-334.
[14] A Warning, A Dhall, D Mitrea and AK Datta, J. Food Engin., 2012, 110(3), 428-440. [15] A Halder, A Dhall, and AK Datta, Food Bioprod. Process. 2007, 85(3), 209-219. [16] A Halder, A Dhall, and A K Datta, Food Bioprod. Process., 2007, 85(3), 220-230. [17] ZJ Zhang and NH Kong, Math. Probl. Engin., 2012, Article ID 347598, 18 pages.