Data Mining in Customer Profitability Analysis
Drazena Gaspar
1,*, Ivica Coric
2, Mirela Mabic
11Faculty of Economics, University of Mostar, Bosnia and Herzegovina 2HERA Company, K.P.Kresimira IV bb, Bosnia and Herzegovina
Copyright © 2015 by authors, all rights reserved. Authors agree that this article remains permanently open access under the terms of the Creative Commons Attribution License 4.0 International License
Abstract
The aim of this paper is a presentation of data mining model that could be used for the measurement of current and forecasting of the future customer profitability. The purpose of this model is to forecast activities of individual customers in the future, and to value that company could expect in doing business with them. Modern customer profitability analysis shows that product cost is just one part of the relation enterprise-customer. A general framework for defining customer profitability, besides pure financial items, has to include a lot of non-linear and non-financial elements. Data mining methods do not use conventional learning methods that suffer from imperfections such as inability to explicitly transfer the knowledge from experts to machines or nonexistence of experts’ will for knowledge transfer. Data mining can identify and adopt patterns and rules that exist in historical data stored in databases and/or data warehouses. It can work equally well with nonlinear and nonfinancial elements of environment which have influence on profitability results. Neural networks approved their capability for approximate description of any continuous function. Together with robust methods of genetic algorithms used in the learning process of networks, they make a good choice in the process of selecting methods for forecasting customer profitability. The proposed model for the forecasting of the customer profitability uses two data mining methods: neural networks and genetic algorithm. The paper presents results of empirical research related to forecasting of customer determination to specific segment made in a company which produces and distributes products like dry fruits, nuts, seeds and cereals for the market of South-East Europe.Keywords
Customer Profitability, Data Mining, Genetic Algorithm, Neural Network1. Introduction
Analysis of business operations shows that product cost is just one part of the relation enterprise-customer. This relation is burdened with other different costs generated by
business activities like inbound logistics, administration of customer orders, sale, marketing and post-sales services. Customers, consistent with their own characteristics, differ a lot in the allocation of these costs. The first theoretical analysis related to this issue has started with work of [1], [2] and [3] in 1990s. The main contribution of all these works is that each monetary unit of revenue does not participate in profit in the same way. So, the focus has been changed on a particular customer and measurement of the revenue’s monetary unit “value” emerged from doing business with this customer. This value is represented by the difference between revenue and costs that arise from doing business with the customer. While revenue presentation is a relatively simple, presentation of costs is a complex problem. Calculation of customer profitability starts with a deduction of product costs and proceeds with the recognition and deduction of other types of costs which strain on this business transaction.
Modern customer profitability analysis (CPA) refers to trends in business profitability research, measured at the customer level. Van Triest [4] distinguishes costs related to physical product delivery, targeted customer costs and the costs that could not be allocated to the individual customer. Shapiro [1] divides costs to the costs before sale, production costs, distribution costs and costs for post-sale service.
Advances in Economics and Business 3(12): 552-559, 2015 553
Enforcement of strategic customer management based on retrospective analysis has become insufficient for survival on the global market. One different approach to profitability, view on prospective customer profitability, brings a completely new knowledge important for decision making process. Prospective customer analysis forecasts elements of business relationship with the customer during its future lifetime (as the customer of the company), finding basis for forecasting in the retrospective analysis. Data mining methods, as neural networks and genetic algorithms, are especially suitable for this type of analysis.
Neural networks do not use conventional learning methods that suffer from imperfections such as inability to explicitly transfer of knowledge from experts to machines or nonexistence of experts’ will for knowledge transfer. On the contrary, the knowledge stored in historical cases makes the basis for neural network learning. It means that instead of request that expert articulates knowledge and then enables the machine to absorb such articulated knowledge, neural networks are capable to identify and absorb hidden knowledge and patterns of behavior that are stored in historical data of retrospective customer analysis. They could work equally well with nonlinear and nonfinancial elements of environment which have influence on profitability results. Neural networks approved their capability for approximate description of any continuous function. That characteristic makes them a good choice in the process of selecting methods for forecasting customer profitability. But, beside obvious advantages, the usage of neural network has some potential limitations. Per example, back-propagation topology of neural network adjusts the network’s weights and biases by calculating the gradient of the error. Usually, back-propagation neural networks are applied with random initial weight setting because of symmetry breaking [9]. However, training the neural networks with random initial weights may cause two main drawbacks: trapping into local minima and converging slowly [9]. In view of these limitations of back-propagation neural networks, global search techniques (e.g. genetic algorithm) could be used to overcome these shortcomings [10], [11]. A number of works compare the evaluation between back-propagation neural network and genetic algorithm for training neural networks [12]. Genetic algorithms (GAs) developed to mimic some of the processes observed in natural evolution are a class of global search algorithms techniques. They have been shown in practice to be very effective at function optimization, and searching large or complex (multimodal, discontinuous, etc.) spaces to
find nearly global optimum efficiently [9].
In genetic algorithm, fitness function will evaluate the adaptation of each individual; it is a key point to decide whether the outcome is good or not. Selection operator will choose adaptive parents depending on their fitness values. By this step, the population tends towards better individuals [9].
This paper presents results of empirical research, based on neural networks and genetic algorithm, related to forecasting of customer determination to specific segments.
2. Objectives
Business subjects present the profitability of their business using aggregate values. Measures like market share, relative market share, market penetration, brand penetration, customer satisfaction, total revenue, total costs, marketing costs and so on, show the way how company works with their customers as a whole. Continuous management tendency for improving the business results lead to necessity of analyzing individual customers. From that perspective, it is not enough anymore that company is agile and efficient in its business. The company should have to be the part of the value chain and to have suppliers and customers that will not decrease its profit margin. Results of customer profitability analysis presented in this paper, show that every customer is not equally valuable, i.e. profitable, for company. That is the reason why it is not enough for a company to rely on detail analysis of existing customer data, but it should be focused on proactive and predictive customer management. Prerequisites for that are big volumes of quality data (data warehouse) and understanding of data mining methods.
Figure 1. Cumulative customer profitability - „whale curve“ [13]
So, “whale curve” once again point out that not all customers are of equal value. According to the results of “whale curve” the customers should be divided into three different layers [14]:
1. Top segment customers: The most valuable and loyal customers. The company should do everything that can keep that customer and have to devote to them more attention and award them for their loyalty.
2. The second segment customers: Customers with average-small profit. Those customers have potential for growth and transition into top segment customers. 3. The third segment customers: Customers whose
servicing cause loss for company.
Total result of company could be improved by actions customized to different customer segments. Kaplan [9], according to their nature, classifies those actions into three groups:
Process improvement
Price decisions
Modify relationships with customers.
The third group opens the room for the possibility of improvement of customer loyalty and profitability measurement in order to represent and the forecast relationship between individual customers and company. The quantity and characteristics of the parameters of customer profitability point to the complexity of problem, measurement and forecast. Generally, the profitability is presented as financial item. But, a lot of nonfinancial factors like customer satisfaction, loyalty or reputation, have an important influence on the financial performance of the company, especially on long term. So, per example, customer satisfaction is preceding customer loyalty, while the result of customer loyalty is his profitability. The
important place in research of customer profitability belongs defining and measuring of customers’ costs.
3. Materials and Methods
The data source for research related to customer segmentation was a data warehouse of the company which produces and distributes products like dry fruits, nuts, seeds and cereals for the market of South-East Europe and for the period 2008 - 2013.
All customers are, according to data from Table 1, classified into corresponding segments (defined in the previous paragraph). The combination of data mining methods, neural networks and genetic algorithm, was used during research in two different ways.
The first way of use (Application 1) should confirm the capacity of classification of used data mining methods related to aligning of customers in the adequate segment.
The second way of use (Application 2) should present predictive capacity of combination of neural network and genetic algorithm. The starting point was the same data set, but limited by time. Namely, the idea was to use the same indicators from former example, but limited to first quarter.
The main hypothesis was: If network shows the ability to predict correct determination to customer segment that will be at the end of the year, based on value of input variables for the first quarter, it means that network has predictive capacity.
Advances in Economics and Business 3(12): 552-559, 2015 555
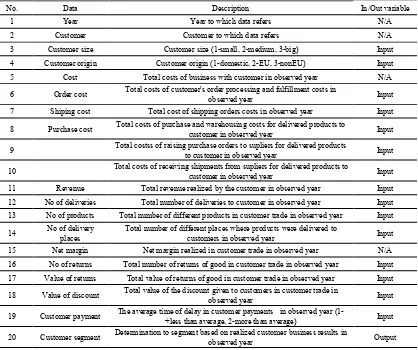
Table 1. Data used in customer segmentation
No. Data Description In/Out variable
1 Year Year to which data refers N/A
2 Customer Customer to which data refers N/A
3 Customer size Customer size (1-small, 2-medium, 3-big) Input
4 Customer origin Customer origin (1-domestic, 2-EU, 3-nonEU) Input
5 Cost Total costs of business with customer in observed year N/A
6 Order cost Total costs of customer's order processing and fulfillment costs in observed year Input
7 Shiping cost Total cost of shipping orders costs in observed year Input
8 Purchase cost Total costs of purchase and warehousing costs for delivered products to customer in observed year Input
9 Total costss of raising purchase orders to supliers for delivered products to customer in observed year Input
10 Total costs of receiving shipments from supliers for delivered products to customer in observed year Input
11 Revenue Total revenue realized by the customer in observed year Input
12 No of deliveries Total number of deliveries to customer in observed year Input 13 No of products Total number of different products in customer trade in observed year Input 14 No of delivery places Total number of different places where products were delivered to customers in observed year Input
15 Net margin Net margin realized in customer trade in observed year N/A
16 No of returns Total number of returns of good in customer trade in observed year Input 17 Value of returns Total value of returns of good in customer trade in observed year Input 18 Value of discount Total value of the discount given to customers in customer trade in observed year Input
19 Customer payment The average time of delay in customer payments in observed year (1- +less than average, 2-more than average) Input
20 Customer segment Determination to segment based on realized customer business results in observed year Output
In the both ways of usage, the input set of data (customer, customer size, customer origin, cost, order cost, shipping cost, purchase cost, costs of raising purchase orders, costs of receiving shipments, revenue, number of deliveries, number of products, number of delivery places, net margin, values of returns, number of returns, discount value and customer payment) was divided to:
Training data (60%),
Cross Validation data (15%) and
Testing data (25%).
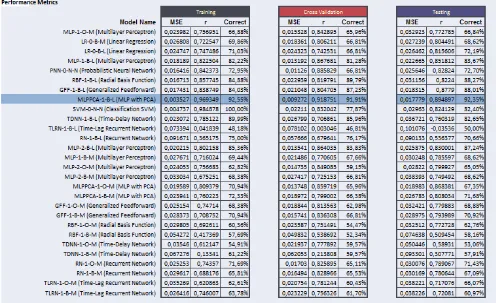
As a software tool was used NeuroSolutions for Excel version 6.20 of company NeuroDimension. Tool Express Builder was used for comparison of results of different types of neural network: MLP-Multi Layer Perceptron, LR-Linear Regression, PNN-Probabilistic Neural Network, RBF-Radial Basis Function, MLPPCA-Multi Layer Perceptron with Principle Component Analysis, SVM- Classification Support Vector Machine, GFF- Generalized Feedforward, TDNN- Time-Delay Network, TLRN- Time-Lag Recurrent Network and RN- Recurrent Network. The number of epochs was 100.
Test results of the first set of data, which were used for testing classification ability of the model, were declared architecture of MLP with PCA network as the best (Figure 2). A Multi-Layer Perceptron (MLP) is a kind of feed-forward ANN model (i.e. forward direction links), consisting of three layers; the input, hidden and output layers [15]. This kind of networks is called the autoassociative network [16]. The performance of a MLP depends on its generalization capability, meaning the data representation. This could suggest a need for eliminating correlation in the data before they are being presented to an MLP. This can be achieved by applying the Principal Component Analysis (PCA) technique onto input data sets prior to the MLP training process as well as interpretation stage [15].
Figure 2. Summary of all Networks for Application 1
Advances in Economics and Business 3(12): 552-559, 2015 557
4. Results
[image:6.595.87.524.146.360.2]Test results of the second data set, which were used for testing predictive ability of the model, were declared MLP – 2- B- L network (Figure 3) as the optimal one.
Table 2. Metrics of Best-Performing networks for Application 1
Training Cross Val. Testing
# of Rows 939 235 392
MSE 0,0035272 0,0092725 0,0177791
Correlation (r) 0,9693491 0,9187507 0,8948969
# Correct 869 216 362
# Incorrect 70 19 30
[image:6.595.93.518.151.257.2]% Correct 92,55% 91,91% 92,35%
Table 3. Final and Minimum MSE for Application 1
Best Networks Training Cross Validation
Epoch # 98 67
Minimum MSE 0,0622935 0,0741663
Final MSE 0,0633549 0,0796188
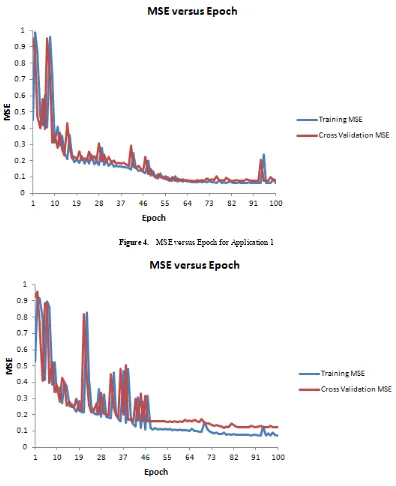
The results of MLP network are presented in tables 4 and 5. Moving of MSE through epochs during the learning process of this network is shown on Figure 5. In the case of the training, set network had a minimal error in 100 epochs, while in the case of validation set network reached the best result in 78 epochs.
Table 4. Metrics of Best-Performing networks for Application 2
Training Cross Val. Testing
# of Rows 886 222 369
MSE 0,0165998 0,0225251 0,0282442
Correlation (r) 0,8525781 0,8191502 0,7754392
# Correct 809 192 297
# Incorrect 75 30 72
% Correct 91,31% 86,49% 80,49%
Table 5. Final and Minimum MSE for Application 2
Best Networks Training Cross Validation
Epoch # 100 78
Minimum MSE 0,0738607 0,1179428
[image:6.595.92.518.421.528.2] [image:6.595.92.521.551.613.2]Figure 4. MSE versus Epoch for Application 1
Figure 5. MSE versus Epoch for Application 2
[image:7.595.313.551.620.680.2]After initial network training for application 2 and achieved results which were presented previously, genetic algorithm was used for network optimization. Training parameters were set on as follows: the number of epochs on 100, maximum number of generations on 100 and the value of a population of 50. During the process of optimization, genetic algorithm optimized selection of input variables, step size, value of momentum and the number of neurons in the hidden layer of the network. The goal of such optimization is finding parameters which will result in a minimal error of the network. After a cycle of optimization by use of genetic algorithm was finished, the error of the network was reduced as it is presented in Table 6.
Table 6. Final and Minimum Minimum MSE for Application 2 after generic optimization.
Optimization Summary Best Fitness Average Fitness
Generation # 6 7
Minimum MSE 0.0748949 0.095297847
Final MSE 0.0748949 0.095297847
5. Conclusions
Advances in Economics and Business 3(12): 552-559, 2015 559
individual/group customer profitability gives a basis for a detailed analysis of customer profitability distribution inside a company. Enforcement of strategic customer management based on retrospective analysis has become insufficient for survival on the global market. Modern approach to profitability, based on prospective customer profitability, brings a completely new knowledge important for decision making process. Prospective customer analysis forecasts elements of business relationship with the customer during its future lifetime, finding basis for forecasting in the retrospective analysis.
The paper presents the potential of neural networks as a tool in the process of analyzing and forecasting customer profitability. The advantages of neural networks lay in the characteristics of their structure and ability of learning and generalization. By using historical data, neural networks are capable to learn and make input-output data mapping. Also, they can adapt weights if new influences arrive from the environment, e.g. it means that they are capable to adjust themselves according to the changes in the environment. Neural network can be projected, not only to give answer to the setting of data parameters, but also to define the degree of confidence in their output result. One of the potential limitations of neural networks – setting initial weights – could be overcome by using genetic algorithm.
The results of presented research showed that classification based on neural networks and genetic algorithm - used for defining network weight factors - could be the efficiency used in customer segmentation. This combination of neural networks and genetic algorithm approved its applicability with classification precision of 91.91 - 92.55% and with prediction precision of 86.49 – 91.31% in the conducted research.
The further research should include new variables into model, taking into account of the number of parameters that defined customer profitability. Since neural networks have the ability to equally well process financial and nonfinancial factors like customer satisfaction or loyalty, it opens new possibilities for more complex applications of these methods, all with a main goal to ensure data necessary for decision making process related to customer management.
REFERENCES
[1] Shapiro P, Rangan K, Moriarty R, Ross E. Manage Customers for Profits (Not Just Sales). Harvard Bussines Review
September-October 1987.
[2] Howell R A, Soucy S R. Customer profitability; as critical as product profitability. Managment Accounting, October 1990: 43-47.
[3] Foster G, Gupta M, Sjoblom L. Customer profitability analysis: Challenges and new directions. Journal of Cost Management (Spring 1996): 5-17.
[4] Triest S. Customer size and customer profitability in non-contractual relationships. Journal of Business & Industrial Marketing 2005, 20/3: 148-155.
[5] Cooper R, Kaplan R. Profit Priorities from Activity-Based Costing. Harward Bussines Review 1991.
[6] Storbacka E K. Segmentation based on customer profitability: retrospective analysis of retail bank customer bases. Journal of Marketing Management 1997, Vol. 13 No. 5:479-92. [7] Krakhmal V. Customer profitability analysis in service
industries. BAA Annual Conference 11-13 Apr 2006, Portsmouth, UK.
[8] Mittal V, Sarkees M, Murshed F. The right way to manage unprofitable customers. Harvard Business Review April 2008 [9] Chang Y, Lin J, Shieh J, Abbod M.F. Optimization the Initial Weights of Artificial Neural Networks via Genetic Algorithm Applied to Hip Bone Fracture Prediction. Advances in Fuzzy Systems 2012
[10]Al-Shareef A.J, Abbod M.F. Neural networks initial weights optimization. Proceedings of the 12th International Conference on Modelling and Simulation (UKSim ’10), March 2010, pp. 57–61.
[11]Venkatesan D, Kannan K, Saravanan R. A genetic algorithm-based artificial neural network model for the optimization of machining processes. Neural Computing and Applications 2009, vol. 18, no. 2, pp. 135–140.
[12]Sexton R.S., Gupta J.N.D. Comparative evaluation of genetic algorithm and backpropagation for training neural networks. Information Sciences 2000, vol. 129, no. 1–4, pp. 45–59. [13]Kaplan R, Narayanan V G.Measuring and managing customer
profitability. Journal of Cost Management 2001, 15(5): 5–15. [14]Farris P W, Bendle N T, Pfeifer P E, Reibstein D J. Marketing
metrics, Wharton School Publishing, USA, 2006
[15]Mohamad-Saleh J, Hoyle B.S. Improved Neural Network Performance Using Principal Component Analysis on Matlab. International Journal of the Computer, the Internet and Management Vol.16. N.o.2 (May-August, 2008) pp 1-8. [16]Qiu J, Wang H, Lu J, Zhang B, Du K.L. Neural Network
![Figure 1. Cumulative customer profitability - „whale curve“ [13]](https://thumb-us.123doks.com/thumbv2/123dok_us/8779559.903423/3.595.207.479.80.333/figure-cumulative-customer-profitability-whale-curve.webp)