Probabilistic Analysis of Breakdown at Merging Sections of Expressway
in Malaysia
Mohd Erwan bin Sanik, PhD Candidate, [email protected]
Faculty of Civil and Environmental Engineering, Universiti Tun Hussein Onn Malaysia
Joewono Prasetijo, Senior Lecturer (Dr. –Ing.), [email protected] and
Ahmad Shukri Yahya, Associate Professor, [email protected] School of Civil Engineering, Universiti Sains Malaysia
Abstract
This research, in general, aims to investigate the breakdown phenomenon at on-ramp merging sections of expressway in Malaysia. Expressway is an uninterrupted flow facility that accommodates high volume of traffic flow with high speed and only accessible via on- and off-ramps. These two parameters; flow and speed, characterize the traffic flow model of uninterrupted flow facility. If these parameters are deeply studied, there is an exclusive condition of flow occurs between the steady flow and congested flow. This condition can be called „breakdown‟. Breakdown was defined in various explanations by different researchers but mostly still studied in a similar approach. Therefore, with regards to Malaysian unique traffic condition, the purpose of this research is to establish the breakdown probabilistic model by determining and analyzing the breakdown speed and flow. One of the major tasks in this research is the collection of field data. The methods used may consist of either loop detection, intelligent image processing or radar detection techniques. However, only an established data collection procedure will be used in order to ensure the consistency of the outcomes. Data will be analyzed based on the fundamental traffic flow model of speed-flow relationship. Simultaneously, the duration and queue discharge flow of breakdown will be obtained by developing the time series plotting of speed and flow versus actual time. Lastly, the breakdown distribution functions will be obtained using appropriate distribution. The outcomes of this research are expected to support the findings of previous researches that the breakdown probability is an increasing function of main-stream and on-ramp flow rates. However, in-depth study will be carried out through this research to specify which condition that really affecting the breakdown probability especially with respect to Malaysian expressway traffic.
Keywords: breakdown, expressway, flow, on-ramp, speed
1- Introduction
when there is construction activity at basic segment, as well as at expressway ramp especially on-ramp or merging section. Near on- and off-ramps or weaving sections, drivers often change to the lanes that are connected to their destinations. These areas are potential locations for bottleneck formation when the fraction of drivers trying to change lanes is high. Therefore, a study to understand the breakdown needs to be done with respect to Malaysian expressway condition.
[image:2.612.156.458.465.704.2]Expressway is an uninterrupted flow facility which consists of several elements such as basic segment, off-ramp, weaving area, and on-ramp, as shown in Figure 1.
Figure 1: Elements in typical expressway (TRB, 2000)
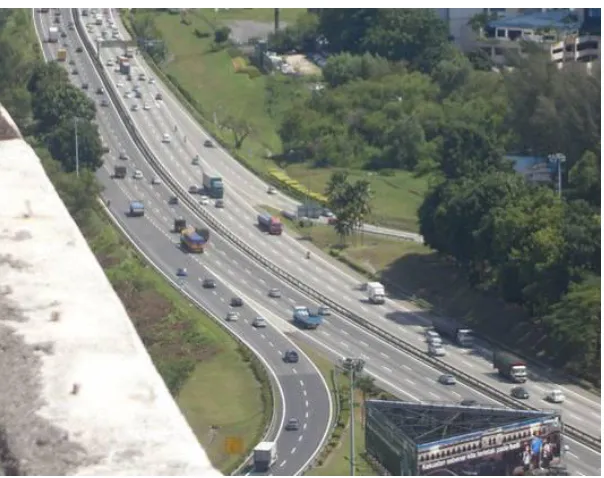
Figure 2: Expressway ramp near Damansara, Kuala Lumpur
This study will focus at the expressway on-ramp which has the high probability of breakdown event. The operational situation of on-ramp-expressway is merging activity which known as a more difficult operation than diverging at off-ramp (Roess & Ulerio, 1994). The uniqueness of Malaysian traffic condition is of the mixed or heterogeneous traffic with motorcycles on the expressway which is not similar with other countries. The effect of motorcycle on capacity shall be one of the focuses in this study. Moreover, this study shall be the initiate of determining operation period until a ramp control system such as ramp metering can be emerged. Ramp metering is a technique using the traffic signal to yield several vehicles of ramp flow at one time in order to give a smooth driving for vehicles at main stream flow. Besides, the main stream has the priority in view of the fact that the expressway itself is an uninterrupted flow facility.
The objectives of the study are as follow:
1. To determine the breakdown speed and capacity at merging sections of Malaysian expressway.
2. To develop time series of flow rate and breakdown speed based on Malaysian expressway traffic condition.
3. To obtain breakdown probability functions for study locations at Malaysian expressway.
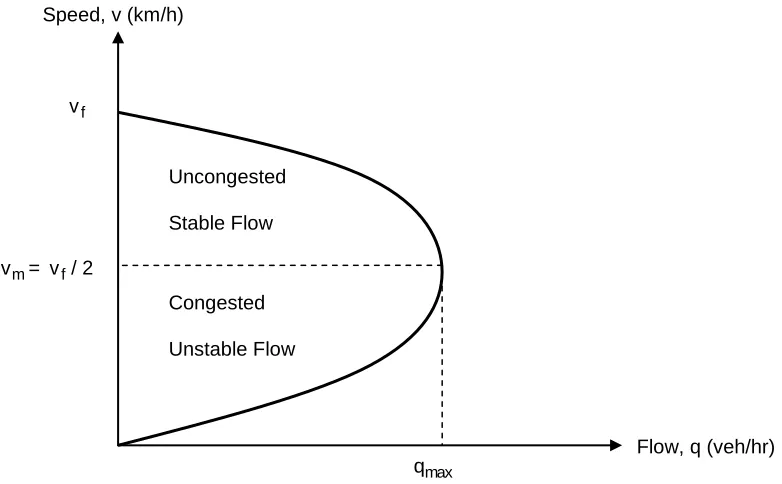
[image:3.612.125.516.432.674.2]Breakdown can be initially explained by the fundamental traffic flow model for uninterrupted flow facility. Figure 3 shows the traffic flow model of speed-flow relationship which will be used throughout this study.
Figure 3: Speed-flow relationship
Speed, v (km/h)
qmax vm= vf/ 2
Uncongested
Stable Flow
Congested
Unstable Flow vf
In the mathematical model term, the speed-flow relationship is explained as follows:
a. Capacity (qmax) is the maximum flow for the facility: When area under the v-k curve is at maximum. Reached when the product of increasing density and decreasing speed result in the maximum number of vehicles passing a certain point
b. Congested unstable flow = high density, low speed: No available gaps for entering vehicles. Any vehicle that do enter create a disturbance that is not easily dissipated c. Uncongested stable flow = low density, high speed: Plenty of gaps available for
merging traffic.
d. Note that the maximum flow occurs at ½ of the free mean speed (vf). This is also called the „optimal speed‟, which is denoted by vm. The value of qmax is determined using equation (1). 2 k 2 v k v
qmax m m f j
, 4
k v qmax f j
………..(1)
e. Derivation of speed at maximum flow, vm (also known as „optimal speed‟):
f 2 j v v v k q 0 v v 2 1 k dv dq f m
j
0 v v 2 1 f m 1 v v 2 f m 2 v vm f
………..(2)
f. Derivation of density at maximum flow, km (also known as „optimal density‟).
j 2 f k k k v q 0 k k 2 1 v dv dq j m
f
0 k k 2 1 j m 1 k k 2 j m 2 k km j
……….(3)
2 k
2 v k v
qmax m m f j
, 4
k v qmax f j
……….(4)
This technical paper consists of four main sections; Introduction, Related Works Methodology, and Conclusion/Expected Contributions. This paper also includes References and Appendix at the end of the manuscript.
2- Related Works
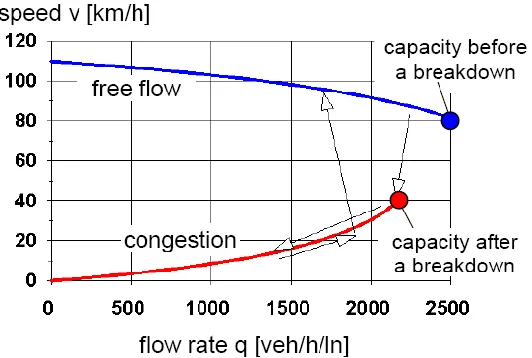
[image:5.612.176.442.419.598.2]Understanding the breakdown phenomenon in urban expressway merging sections is a key parameter for more effective geometric design and control strategies. In merging sections, two traffic streams conflict: main stream and ramp flows, where each vehicle of these two streams looks for a space that maximizes its utility. Consequently, breakdowns that start from such sections appear to be an indefinable phenomenon, yet they need to be understood. Previous studies (Elefteriadou et al., 1995; Lorenz and Elefteriadou, 2000) proved that the breakdown events at merging sections are not a direct result of peak traffic volumes. In their studies, the breakdown phenomenon was treated as a probabilistic problem. They found that the breakdown probability is an increasing function of main-stream and on-ramp flow rates. However, the shape of the developed probability models varies among them. A simple definition of breakdown was introduced by Lorenz & Elefteriadou (2000) as “transition from an uncongested state to a congested state”. Breakdown can also be explained by the duality of capacity on an expressway (Wu, 2004). The missing line in the graph of speed-flow relationship in Figure 4 can be called “breakdown‟.
Figure 4: Duality of the capacity at expressway (Wu, 2004)
condition sustains for at least 15 min while the downstream speeds at (D) remain over this critical value.” A typical example of this is shown in Figure 5.
Figure 5: Shibakoen (Japan) merging section (Shawky and Nakamura, 2007)
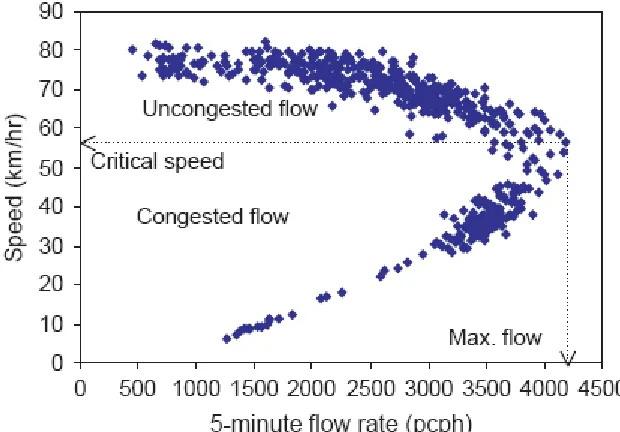
[image:6.612.152.462.368.584.2]Traffic breakdown is referred as transition of traffic flow from fluid into congested conditions (Geistefeldt and Brilon, 2009). In this study, the speed-flow relationship will be obtained to determine critical speed or breakdown speed and maximum flow or capacity. Figure 6 shows the example of speed-flow relationship and how the breakdown speed and capacity by Shawky and Nakamura (2007).
Figure 6: Example of speed-flow relationship (Shawky & Nakamura, 2007)
According to Brilon et al. (2005), the suddenness of breakdown, however, may differ from one country to another depending on the general driving culture. Table 1 shows the summary of previous findings at various countries. These findings are best explained in the form of figures. Somehow, the summary is to show the comparison of related studies.
Table 1: Summary of previous findings
Speed (km/h) capacity
Lorenz & Elefteriadou
(2000)
United
States Bottleneck Approximately 90 1800 - 2500 vphpl
Brilon et al.
(2005) Germany Bottleneck Approximately 70 2100 - 2300 vphpl Shawky &
Nakamura (2007) Japan On-ramp Approximately 60 2300 - 2400 pcphpl vphpl = vehicle per hour per lane
pcphpl = passenger car per hour per lane
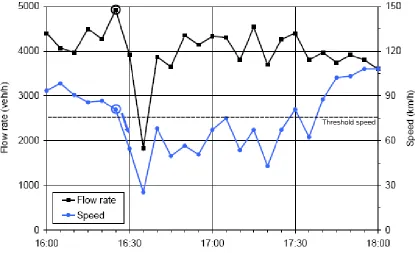
[image:7.612.101.516.298.551.2]The breakdown speed and capacity will be used to develop time series of flow rate and average speed. The duration of breakdown as well as the time can be determined using this time series. The example of time series is as shown in Figure 7.
Figure 7: Example of Time series of flow rate and average speed during a congestion incident (Geistefeldt & Brilon, 2009)
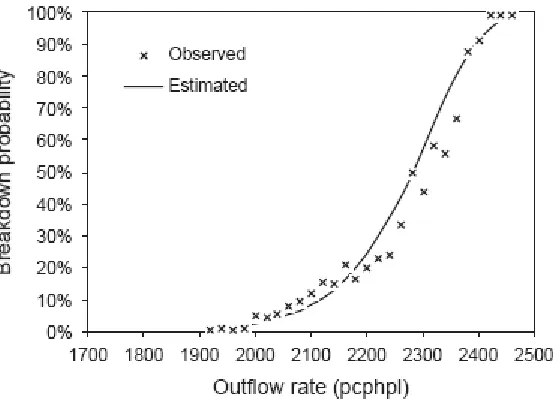
Figure 8: Example of breakdown probability functions (Shawky & Nakamura, 2007)
Weibull distribution was identified to be fitted model in most researches for probability distribution (Wu, 2004; Brilon et al., 2005; Shawky & Nakamura, 2007; Geistefeldt & Brilon, 2009). The Weibull distribution model is given in Equation (5).
………(5)
Where,
P = breakdown probability,
x = outflow rate (pcphpl), α = shape parameter, and β = scale parameter
3- Methodology
In general, the methodology of this study is as shown in Appendix. The first step is to identify the problem statement followed by gathering all literature review of the related problem. The related works of previous researchers are essential for identifying existing research, justifying study area as well as identifying potential research improvements with regards to local condition. Based on the study area and the potential research, the study location is identified and also the scope of study.
[image:9.612.175.439.166.417.2]
Data collection will be carried out either using the intelligent image processing technique or using the traffic radar recorder. The equipments are as shown in Figure 9 and 10. The data collection procedure will be finalized after the preliminary data collection and the process will be repeated. Data extraction and reduction will be carried out afterward in the traffic laboratory. Later, the data will be used in data analysis.
Figure 9: Intelligent Image Processing Software
Figure 10: Telescopic mast (to be used to collect data for software in Figure 9)
[image:9.612.94.571.456.597.2](Wu, 2004; Brilon et al., 2005; Shawky & Nakamura, 2007; Geistefeldt & Brilon, 2009) and more data can be obtained to model the breakdown probabilistic.
The objectives which consist of speed-flow relationship, time series of speed and flow rate and lastly the breakdown distribution functions, will be fulfilled after data analysis process. The results will then be discussed and the conclusion will be made. Since local study is still lacking and many new contributions can be made in future research, the recommendation will be carried out at the end of this study.
4.0- Conclusion/Expected Contributions
New discoveries will be made due to lack of local study and also with regards to unique Malaysian traffic condition. In this study, the expected outcomes or contributions will be as follow:
1. Speed-flow relationship and time series of breakdown speed and flow rate with respect to local traffic condition.
2. Breakdown probability functions of breakdown at the Malaysian expressway on-ramp.
3. Proposal of fundamental study to ramp metering at Malaysian expressway will be recommended especially for local expressway concessionaries.
References
Alabanese, M., Camus, R. and Longo, G. (2003). Capacity and Queue Modeling for On-Ramp-Freeway Junctions, Transportation Research Record, No. 1852, Traffic Flow Theory and Highway Capacity 2003, Transportation Research Board, U.S.A.
Altman, D., Burton, N., Cuthill, I., Festing, M., Hutton, J., and Playle, L. (2007), Experimental design and statistical analysis, NC3Rs. http://www.nc3rs.org.uk/page.asp?id=23
Brilon, W., Geistefeldt, J., and Regler, M. (2005): Reliability of Freeway Traffic Flow: A stochastic Concept of Capacity, Proceedings of the 16th International Symposium on Transportation and Traffic Theory, pp. 125 – 144.
Dong, J., and Mahmassani, H.S., (2009). Flow Breakdown and Travel Time Reliability Transportation Research Record: Journal of the Transportation Research Board, No. 2124, Transportation Research Board of the National Academies, Washington, D.C., pp. 203–212.
Elefteriadou, L., Roess, R.P. and Mcshane, W.R. (1995). Probabilistic Nature of Breakdown at Freeway Merge Junctions, Transportation Research Record, No. 1484, Traffic Operations: Highway Capacity, Transportation Research Board, U.S.A.
Geistefeldt, J. and Brilon, W. (2009). A Comparative Assessment of Stochastic Capacity Estimation Methods. In: Transportation and Traffic Theory 2009: Golden Jubilee, Proceedings of the 18th International Symposium on Transportation and Traffic Theory, Hong Kong, pp. 583-602.
Lorenz, M. and Elefteriadou, L. (2000). A Probabilistic Approach to Defining Freeway Capacity and Breakdown. Transportation Research Circular E-C018: 4th International Symposium on Highway Capacity, pp 84-95.
Muhammad Akram, A., Wan Hashim, W.I., Ahmad Shukri, Y., and Meor Othman, H. (2007). Development of Merging Capacity Models Based on Malaysian Urban Expressway Condition, 1st Civil Engineering Colloqium (CEC ‟06), 34-25th May 2006.
Roess, R., and J. Ulerio, Capacity of Ramp-freeway Junctions, Final Report, NCHRP Project 3-37, Polytechnic University, Brooklyn, N.Y., Nov. 1993.
Roess, R.P. and Ulerio, J.M. (1994). New Capacity Analysis Procedure for Ramp-freeway Terminals, Proceedings of the Second International Symposium on Highway Capacity, 1994, Akcelik, R. (ed.),Volume 2, pp. 503-522, Sydney, Australia.
Shawky, M. and Nakamura, H. (2007). Characteristics of Breakdown Phenomenon in Merging Sections of Urban Expressways in Japan.Transportation Research Record: Journal of the Transportation Research Board, No. 2012, Transportation Research Board of the National Academies, Washington, D.C., pp. 11–19.
Transportation Research Board (2000). Highway Capacity Manual, National Research Council, Washington, D.C., U.S.A.
Appendix
PROBLEM STATEMENT
LITERATURE STUDY
Identifying existing research
Justification for study area
Identify potential improvements with regards to Malaysian condition
DEVELOP CONCEPTUAL RESEARCH FRAMEWORK
Define scope and limitation
Identify study location
DEVELOP DATA COLLECTION PROCEDURE
Development of data collection system
Video recording andspeed detector
PRELIMINARY DATA COLLECTION & ANALYSIS
DATA COLLECTION
PROCEDURE ESTABLISHED
No
Overall Methodology
BREAKDOWN PROBABILITY FUNCTIONS
TIME SERIES OF SPEED AND FLOW
SPEED-FLOW RELATIONSHIP
RECOMMENDATION FOR FUTURE
RESEARCH DATA ANALYSIS
Data extraction and reduction
Statistical analysis; descriptive statistics, exploratory data analysis, ANOVA
DISCUSSION AND CONCLUSION
Current breakdown phenomenon