Data Transfer Rate, Central Processing Unit
Usage and Read Access Memory Usage in
Networked Control System via Industrial
Ethernet
Handy Ali Munir
1,2, Nordin Saad
1, Syed Alwee Aljunid Syed Junid
3, Ahmad Mujahid Ahmad Zaidi
4, Mohd
Zuki Yusoff
1and Asmarashid Ponniran
51Electrical & Electronic Engineering Department, Universiti Teknologi PETRONAS Email: [email protected]
2PPKMt, 3PPKKP,Universiti Malaysia Perlis
4Faculty of Engineering, National Defence University of Malaysia
5Faculty of Electrical and Electronic Engineering, Universiti Tun Hussein Onn Malaysia
Abstract— Data transfer rate is the amount of data that can be transferred at a time. Network Control System (NCS) based communication system Industrial Ethernet (IE) is becoming very popular for automation system. The Fast Ethernet system with data rate transfer 100Mb/s is used in this project. Star topology with the hub connected to a computer and two Programmable Logic Controller (PLC) are analysis for the data transfer rate performance. Real-time communication for the system is very good without no disconnected between the computer and PLCs. Data transfer rate, packets speed (#/s), packets volume, sum volume (KByte), Central Processing Unit (CPU) usage in percentage, percentage available Read Access Memory (RAM), available memory RAM(MByte) are analysed. It is shown that the data flow for traffic out (speed) is greater than traffic in (speed) for the data transfer rate between the computer and PLCs.
Keywords—Data Transfer Rate, Networked Control System (NCS), Industrial Ethernet and Programmable Logic Controller (PLC).
I. INTRODUCTION
Advanced of the network technology and convergence of communications, control and computer enabled the Networked Control System (NCS) can be achieved [1]. All signal in the NCS is transmitted through shared communication channels used with the other users. Industrial Ethernet (IE) is the applications of IEEE 802.3 standards with requirements of factory equipment and network protocols [2]. The Programmable Logic Controller (PLC) is a microprocessor based control system that can be programmed to sense, activate and control an industrial equipment which has been made possible with the incorporation of a number of input/output (I/O) terminals for interfacing to an industrial process. A control routine stored in the PLC memory determines the communication between the input and output of the PLC [3].
Real-time are usually reactive systems that are in continual interaction with their environments. Control systems for real-time applications are characterized by their ability to support strong time constraints. Since the processing element (controller) is close to the devices,
[image:1.595.316.542.383.491.2]real-time constraints can significantly be improved by appropriately configuring the devices. Besides the room for accommodating control code at the local level, nodes has memory space (buffers) to store temporary real-time data for subsequent use. Storage facility at the local level, in this context, is highly desirable to meet the need for improving real-time performance [4].
Fig. 1. Bits, frames, packets and segments [5].
Fig. 1 shows the data passes from layer to layer that is called Protocol Data Units (PDU). At the physical layer these are the bits, at the data link layer these are the frames, at the network layer these are the packets and at the transport layer these are the segments.
The amount of the data can transfer at time is normally defined either in bits per second (b/s) or bytes per second (B/s). Typically, serial busses are defined in b/s and parallel busses in B/s. The more the bits that can be transferred and the faster of transfer will be.
Data rate transfer is defined [5]:
f is clock frequency (Hz) T is clock period (s)
data rate transfer (b/s)
= number of bits transmitted per operation (bits) X
clocking rate,f (Hz)
II. EXPERIMENTAL SETUP
The specifications of the computer used for this project are:
* Processor: Dual CPU 2.00 GHz. * Read Access Memory (RAM): 3.00 GB
[image:2.595.58.296.76.351.2]* Fast Ethernet 100Mb/s local area network (LAN) card.
Fig. 2. Local Area Network of Fast Ethernet with maximum Link Speed to 1 Mbps.
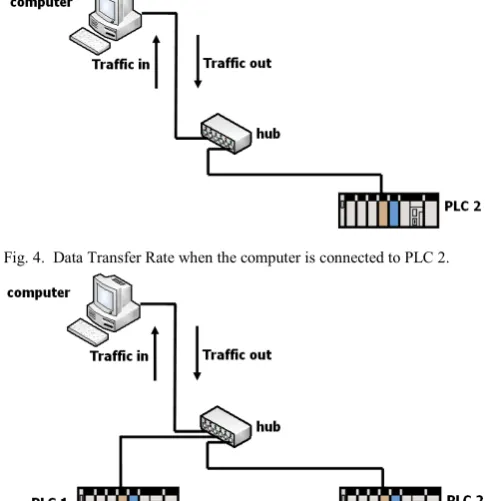
There are three type of the connection done for the real-time communication between computer and PLC as shown in Fig. 3, Fig. 4 and Fig. 5. Star topology used for each connections and hub are centered for the networking between computer and PLC.
The types of the PLC used for this project are OMRON SYSMAC CS1D-CPU65P with Fast Ethernet. RJ45 (RJ stands for registered jack) Unshielded Twisted-Pair (UTP) cable used to connect between the computer, PLC and hub. IP address are set unique for each computer, PLC 1 and PLC 2 to avoid data conflict and this is as shown in the TABLE I.
Hub is the simplest method of redistributing data on Ethernet. The hub has several ports and an incoming signal is rebuild and then transmitted on all the remaining ports [6]. The hub also does not make any decisions about the Ethernet frame or its contents.
Ladder diagram for the PLC 1 have 7 rungs and PLC 2 have 32 rungs. The software interface between computer and PLC is CX-Programmer version 6.11 2005 from OMRON.
TABLEI IPADDRESS(CLASSC)
node IP Adresss
Computer PLC 1 PLC 2
[image:2.595.353.488.84.206.2]192.168.0.10 192.168.0.2 192.168.0.5
[image:2.595.311.554.224.351.2]Fig. 3. Data Transfer Rate when the computer is connected to PLC 1.
Fig. 4. Data Transfer Rate when the computer is connected to PLC 2.
Fig. 5. Data Transfer Rate when the computer is connected to PLC 1 & 2.
III. RESULT &DISCUSSION
[image:2.595.309.552.234.485.2] [image:2.595.314.552.362.510.2] [image:2.595.306.553.513.694.2]TABLEII
DATASTATISTICSFORFIG.6. kbit/s Sum (speed) Traffic in
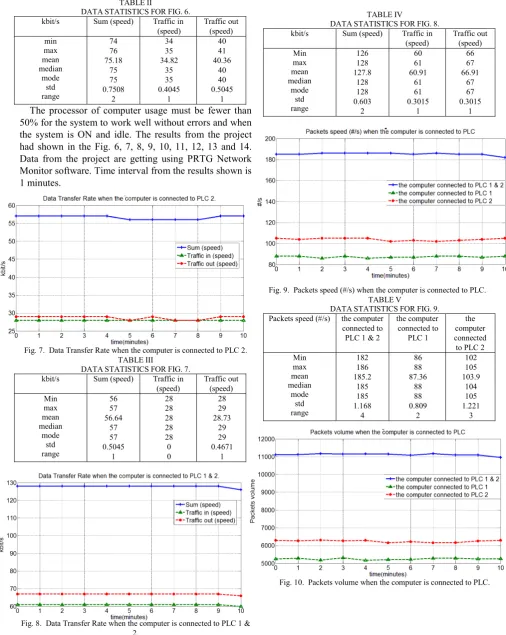
(speed) Traffic out (speed) min max mean median mode std range 74 76 75.18 75 75 0.7508 2 34 35 34.82 35 35 0.4045 1 40 41 40.36 40 40 0.5045 1 The processor of computer usage must be fewer than 50% for the system to work well without errors and when the system is ON and idle. The results from the project had shown in the Fig. 6, 7, 8, 9, 10, 11, 12, 13 and 14. Data from the project are getting using PRTG Network Monitor software. Time interval from the results shown is 1 minutes.
Fig. 7. Data Transfer Rate when the computer is connected to PLC 2. TABLEIII
DATASTATISTICSFORFIG.7. kbit/s Sum (speed) Traffic in
(speed) Traffic out (speed) Min max mean median mode std range 56 57 56.64 57 57 0.5045 1 28 28 28 28 28 0 0 28 29 28.73 29 29 0.4671 1
Fig. 8. Data Transfer Rate when the computer is connected to PLC 1 & 2.
TABLEIV
DATASTATISTICSFORFIG.8. kbit/s Sum (speed) Traffic in
(speed) Traffic out (speed) Min max mean median mode std range 126 128 127.8 128 128 0.603 2 60 61 60.91 61 61 0.3015 1 66 67 66.91 67 67 0.3015 1
Fig. 9. Packets speed (#/s) when the computer is connected to PLC. TABLEV
DATASTATISTICSFORFIG.9. Packets speed (#/s) the computer
connected to PLC 1 & 2
the computer connected to PLC 1 the computer connected
[image:3.595.53.284.71.178.2]to PLC 2 Min max mean median mode std range 182 186 185.2 185 185 1.168 4 86 88 87.36 88 88 0.809 2 102 105 103.9 104 105 1.221 3
[image:3.595.37.544.73.709.2]TABLEVI
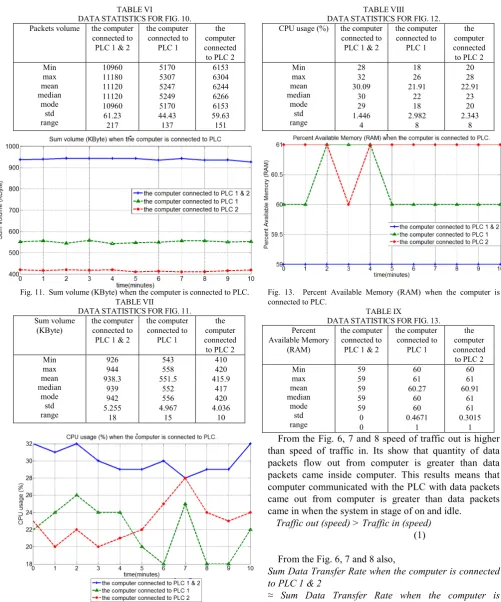
DATASTATISTICSFORFIG.10. Packets volume the computer
connected to PLC 1 & 2
the computer connected to PLC 1 the computer connected
to PLC 2 Min max mean median mode std range 10960 11180 11120 11120 10960 61.23 217 5170 5307 5247 5249 5170 44.43 137 6153 6304 6244 6266 6153 59.63 151
Fig. 11. Sum volume (KByte) when the computer is connected to PLC. TABLEVII
DATASTATISTICSFORFIG.11. Sum volume
(KByte)
the computer connected to PLC 1 & 2
the computer connected to PLC 1 the computer connected
to PLC 2 Min max mean median mode std range 926 944 938.3 939 942 5.255 18 543 558 551.5 552 556 4.967 15 410 420 415.9 417 420 4.036 10
Fig. 12. CPU usage (%) when the computer is connected to PLC.
TABLEVIII
DATASTATISTICSFORFIG.12. CPU usage (%) the computer
connected to PLC 1 & 2
the computer connected to PLC 1 the computer connected
to PLC 2 Min max mean median mode std range 28 32 30.09 30 29 1.446 4 18 26 21.91 22 18 2.982 8 20 28 22.91 23 20 2.343 8
Fig. 13. Percent Available Memory (RAM) when the computer is connected to PLC.
TABLEIX
DATASTATISTICSFORFIG.13. Percent
Available Memory (RAM)
the computer connected to PLC 1 & 2
the computer connected to PLC 1 the computer connected
to PLC 2 Min max mean median mode std range 59 59 59 59 59 0 0 60 61 60.27 60 60 0.4671 1 60 61 60.91 61 61 0.3015 1 From the Fig. 6, 7 and 8 speed of traffic out is higher than speed of traffic in. Its show that quantity of data packets flow out from computer is greater than data packets came inside computer. This results means that computer communicated with the PLC with data packets came out from computer is greater than data packets came in when the system in stage of on and idle.
Traffic out (speed) > Traffic in (speed)
(1)
From the Fig. 6, 7 and 8 also,
Sum Data Transfer Rate when the computer is connected to PLC 1 & 2
≈ Sum Data Transfer Rate when the computer is
connected to PLC 1 + Sum Data Transfer Rate when the
computer is connected to PLC 2 (2)
Sum Data Transfer Rate PLC2 < Data Transfer Rate PLC1 <
Data Transfer Rate PLC1 & 2 (3)
From the results for Packets speed (#/s),
[image:4.595.38.540.66.669.2]PLC 1 & 2
≈ Packets speed (#/s) when the computer is connected to
PLC 1 + Packets speed (#/s) when the computer is
connected to PLC 2 (4)
Packets speed (#/s)PLC1 < Packets speed (#/s)PLC2 <
Packets speed (#/s)PLC1 & 2 (5)
About Packets volume,
Packets volume when the computer is connected to PLC 1 & 2
≈ Packets volume when the computer is connected to PLC
1 + Packets volume when the computer is connected to
PLC 2 (6)
Packets volumePLC1 < Packets volume PLC2 < Packets
volume PLC1 & 2 (7)
For Sum volume (KByte),
Sum volume (KByte) when the computer is connected to PLC 1 & 2
≈ Sum volume (KByte) when the computer is connected to
PLC 1 + Sum volume (KByte) when the computer is
connected to PLC 2 (8)
Sum volume (KByte)PLC2 < Sum volume (KByte) PLC1 <
Sum volume (KByte) PLC1 & 2 (9)
But for CPU usage (%),
CPU usage (%) when the computer is connected to PLC 1 & 2
≠ CPU usage (%) when the computer is connected to
PLC 1 + CPU usage (%) when the computer is connected
to PLC 2 (10)
CPU usage (%)PLC1 < CPU usage (%) PLC2 < CPU usage
(%) PLC1 & 2 (11)
and Available Memory RAM(MByte),
Available Memory RAM(MByte) when the computer is connected to PLC 1 & 2
≠ Available Memory RAM(MByte) when the computer is
connected to PLC 1 + Available Memory RAM(MByte)when the computer is connected to PLC 2
(12)
Available Memory RAM(MByte)PLC1 & 2 < Available
Memory RAM(MByte) PLC1 < Available Memory
RAM(MByte) PLC2 (13)
Percent Available Memory (RAM)PLC1 & 2 < Percent
Available Memory (RAM) PLC1 < Percent Available
Memory (RAM) PLC2 (14)
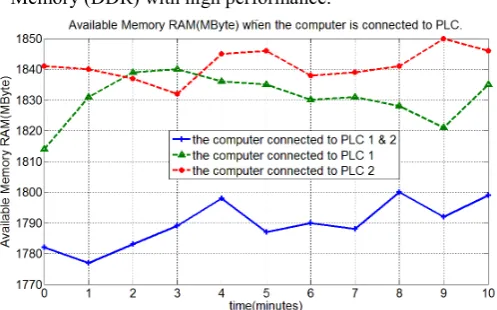
The CPU usage is not approximately sum because of the duo core technology processor with high performance are during these experiments. The Read Access Memory (RAM) is used for this experimental is Double Data Rate
[image:5.595.301.550.78.233.2]Memory (DDR) with high performance.
Fig. 14. Available Memory RAM(MByte) when the computer is connected to PLC.
TABLEX
DATASTATISTICSFORFIG.14. Available
Memory RAM(MByte)
the computer connected to PLC 1 & 2
the computer connected to
PLC 1
the computer connected to PLC 2 Min
max mean median
mode std range
1777 1800 1790 1789 1777 7.367 23
1814 1840 1831 1831 1831 7.752 26
1832 1850 1841 1841 1841 5.065 18 TABLEXI
* < < * < * Sum Data Transfer
Rate
PLC2 PLC1 PLC1& 2 Packets speed (#/s) PLC1 PLC2 PLC1&
2 Packets volume PLC1 PLC2 PLC1&
2 Sum volume
(KByte)
PLC2 PLC1 PLC1& 2 From the TABLE XI, if the Sum Data Transfer Rate is higher, the consequence is that the Sum volume (KByte) also would become higher. From TABLE XI also, the packet size operating in PLC 1 is larger as compared to PLC 2.
IV. CONCLUSION
From the project, equations (2), (4), (6), (8), (10) and (12) are obtained by the experimental setup already done. The characteristics of data transfer rate, central processing unit usage and read access memory usage of NCS via Industrial Ethernet are investigated to get the optimum results.
ACKNOWLEDGMENT
REFERENCES
[1] Huajing Fang, Hao Ye, Maiying Zhong;” Fault diagnosis of networked control systems” Annual Reviews in Control 31 (2007) 55–68.
[2] Perry S. Marshall and John S. Rinaldi, Industrial Ethernet: How to Plan, Install and Maintain TCP/IP Ethernet Networks, The Basic Reference Guide for Automation and Process Control Engineers,
2nd Edition. United States of America: ISA-The Instrumentation, Systems and Automations Society, 2005.
[3] Kleines, H.; Sarkadi, J.; Suxdorf, F.; Zwoll, K.;” Measurement of real-time aspects of Simatic® PLC operation in the context of
physics experiments” IEEE Transactions on Nuclear Science
Volume 51, Issue 3, Part 1, June 2004 Page(s):489 – 494
[4] Nitaigour Premchand Mahalik, Mechatronics, Principles, Concepts and Applications, Mc-Graw Hill, Singapore, 2003. [5] William Buchanan, Distributed Systems and Networks. Singapore:
McGraw-Hill, 2002.
![Fig. 1. Bits, frames, packets and segments [5].](https://thumb-us.123doks.com/thumbv2/123dok_us/8779050.903144/1.595.316.542.383.491/fig-bits-frames-packets-and-segments.webp)