Development and Application of Chronic Disease Risk
Prediction Models
Sun Min Oh,
1,2Katherine M. Stefani,
3and Hyeon Chang Kim
1,4 1Department of Preventive Medicine, Yonsei University College of Medicine, Seoul;2Medical Affairs, Novartis Korea Oncology, Seoul;
3Department of Research Affairs, Yonsei University College of Medicine, Seoul;
4Cardiovascular and Metabolic Diseases Etiology Research Center, Yonsei University College of Medicine, Seoul, Korea.
Received: April 3, 2014
Corresponding author: Dr. Hyeon Chang Kim, Department of Preventive Medicine, Yonsei University College of Medicine, 50-1 Yonsei-ro, Seodaemun-gu, Seoul 120-752, Korea.
Tel: 82-2-2228-1873, Fax: 82-2-392-8133 E-mail: [email protected]
∙ The authors have no financial conflicts of interest.
© Copyright:
Yonsei University College of Medicine 2014
This is an Open Access article distributed under the terms of the Creative Commons Attribution Non-Commercial License (http://creativecommons.org/ licenses/by-nc/3.0) which permits unrestricted non-commercial use, distribution, and reproduction in any medium, provided the original work is properly cited.
Currently, non-communicable chronic diseases are a major cause of morbidity and mortality worldwide, and a large proportion of chronic diseases are preventable through risk factor management. However, the prevention efficacy at the individu-al level is not yet satisfactory. Chronic disease prediction models have been devel-oped to assist physicians and individuals in clinical decision-making. A chronic disease prediction model assesses multiple risk factors together and estimates an absolute disease risk for the individual. Accurate prediction of an individual’s fu-ture risk for a certain disease enables the comparison of benefits and risks of treat-ment, the costs of alternative prevention strategies, and selection of the most effi-cient strategy for the individual. A large number of chronic disease prediction models, especially targeting cardiovascular diseases and cancers, have been sug-gested, and some of them have been adopted in the clinical practice guidelines and recommendations of many countries. Although few chronic disease prediction tools have been suggested in the Korean population, their clinical utility is not as high as expected. This article reviews methodologies that are commonly used for developing and evaluating a chronic disease prediction model and discusses the current status of chronic disease prediction in Korea.
Key Words: Non-communicable diseases, chronic diseases, risk prediction, dis-ease prediction, health risk appraisal, Korea
INTRODUCTION
Annually, 36 million deaths (more than two-thirds of total deaths in the world) are caused by non-communicable chronic diseases (NCDs) including cardiovas-cular diseases (17.3 million deaths), cancers (7.6 million), chronic respiratory dis-eases (4.2 million), and diabetes (1.3 million).1 In high-income countries, the
health care burden of NCDs remains high; however, the death rates of NCDs have been decreasing over the last few decades.2 For example, the age-adjusted
con-HOW TO DEVELOP CHRONIC DISEASE
RISK PREDICTION MODELS
Identifying risk predictors
Chronic disease risk prediction models use multiple covari-ates to estimate the probability of having or developing a certain chronic disease within a specific time period.8-10
Re-liable data must be secured to develop the risk prediction model so that potential risk factors (or predictors), disease outcomes, and their associations may also be evaluated. The most reliable data comes from prospective cohort stud-ies since the risk factors and their contributions to the dis-ease incidence can be evaluated. Data from retrospective cohort studies are also frequently used to develop risk pre-diction models.10 Retrospective cohort data can save time
and decrease costs, but these data are documented usually for health screening or administrative purposes. Therefore, limited information on covariates and disease outcomes might affect the performance of the prediction model. Data from case-control studies are generally not reliable for pre-diction model development, but data from nested case-con-trol or case-cohort designs within an established cohort can be successfully used.10 Moreover, suspected outcomes such
as disease events or deaths should be ascertained using med-ical records and/or death certificates. Candidate risk predic-tors may include variables related to demographics, medical history, family history, physical examinations, and bio-markers. These variables should be measured by standard-ized methods, and the validity and reliability of the mea-surements should be evaluated regularly over the study period. Among the evaluated variables, potential risk pre-dictors could be selected based on the literature and statisti-cal investigation of the study dataset.
Developing candidate risk prediction models
Multiple linear regression, multiple logistic regression, and Cox’s proportional hazard regression models are employed frequently to quantify the contribution of each covariate (predictor) on the development of a new event (the disease of interest). After potential risk predictors and disease out-comes are selected, the strength of the association (regres-sion coefficients) between the covariates at baseline and the incident event is estimated using an appropriate statistical model. If risk factors were measured repeatedly during the follow-up period, the predictive performance may be im-proved by including updated values or considering time-tributed to a 44% reduction in coronary heart disease
mor-tality, while treatments contributed 47% to the reduced mortality.4 Smoking cessation is the largest contributing
factor to the reduced lung cancer mortality;5 however, the
prevalence of smoking has substantially decreased in most high-income countries.2 In most low- and middle-income
countries, NDCs are now the leading causes of death, and the burden of NCD is increasing rapidly in low-income populations.1 Annually, 80% of NCD deaths and 90% of
premature NCD deaths (before the age of 60) occur in low- and middle-income countries.1 In Korea, cancer,
cardiovas-cular diseases, chronic respiratory diseases and diabetes are the four main NCDs that are among the top 10 causes of death, and these NCDs account for more than 60% of all deaths in 2012.6 In Korea, unlike other high-income
coun-tries, the death rates of most NCDs have been increasing or plateauing over the past few decades.6 Moreover, the health
care burden of NCDs is expected to steeply increase with a rapidly aging Korean population. Thus far, efforts to pre-vent NCDs have been mainly invested at the population level, such as through mass health screenings and cam-paigns for smoking cessation, reducing alcohol abuse, en-couraging a healthy diet, and exercise. Although this kind of population-based approach has greatly improved NCD prevention, personalized medical care is also important to assess disease risk and preventive strategies at an individual level.
Epidemiological research contributed much to NCD pre-vention by identifying major risk factors and by evaluating the performance of screening, diagnosis, and treatment mo-dalities. Traditional epidemiologic studies measure the im-pact of a risk factor on a certain disease by calculating rela-tive risk and odds ratios.7 However, these measures of risk
are difficult to apply at an individual level because an indi-vidual may have a disease without any exposure to risk fac-tors or may be exposed to multiple risk facfac-tors at various exposure levels.7 Therefore, in the clinical decision-making
process, absolute disease risk should be estimated for each individual.7 Disease risk prediction (or health risk appraisal)
models have been developed to assess the impact of multi-ple risk factors together for the estimation of an individual’s absolute disease risk.7 The development of risk prediction
if adding a new predictor or replacing an existing model with a new one improves an individual’s risk stratification. Additionally, reclassification tables are constructed sepa-rately for participants with and without events to calculate the net reclassification improvement (NRI), an index of im-trend of the risk factors. Moreover, competing risks of
de-veloping other diseases may also be considered, especially for models that predict long-term or lifetime disease risk.11,12
Once regression coefficients are calculated, they can be mul-tiplied and rounded off as integers to simplify the model.
Evaluating the performance of the risk prediction model
To find the most effective risk prediction model, multiple candidate models that include a different combination of the selected risk factors should be evaluated in diverse as-pects: global model fitness, discrimination, calibration, and reclassification.10,13 First, global model fitness is measured
to find the best-fit model with the least number of covari-ates. Among the various measures of global model fitness, the Akaike Information Criterion and the Bayes Informa-tion Criterion are the two commonly used methods.13,14
Second, discrimination refers to the ability to separates those with events from those without events. Receiver op-erating characteristics (ROC) curves are commonly used for evaluating discrimination performance.15,16 The ROC
curve is a plot of sensitivity on the y-axis and 1-specificity on the x-axis for all possible cut-off values. The values of area under the ROC curve (AUC) and C-statistic should fall between 0.5 and 1.0 with a high score indicating a high power of discrimination (Fig. 1). AUC scores of 0.70 to 0.80 are considered an acceptable range of discriminative power, and a score of 0.80 or higher is considered to indi-cate excellent model discrimination.17
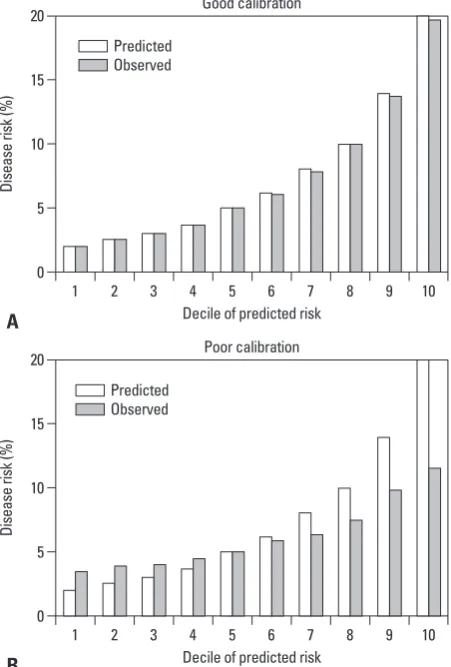
Third, calibration is a measure of how accurately the pre-dicted probabilities of developing a disease match the subse-quently observed event rate. The most common approach is comparing predicted and observed disease rates across dis-ease different risk groups. The study population is then di-vided into multiple risk categories (often deciles) according to the predicted risk. Then, the predicted and observed event rates in each category are graphically compared. Fig. 2 shows an example of a good and poor calibration perfor-mance. Smaller differences between predicted and observed rates indicate better model calibration. The statistical signif-icance of the difference between predicted and observed rates is often assessed by the Hosmer-Lemeshow’s chi-square test.17 The Brier score, which is the sum of the squared
differ-ence between the observed outcome and fitted probability, is a measure of fit that considers both calibration and discrim-ination.14
Fourth, reclassification tables are commonly used to compare a new model with an existing model to determine
100%-Specificity% 0
20 40 60 80 100
Se
ns
iti
vit
y%
[image:3.595.315.540.146.322.2]0 20 40 60 80 100
Fig. 1. Simluated receiver operating characteristics curves for two predic-tion models. AUC, area under the receiver operating characteristics curve.
Fig. 2. Simulated calibration charts for two prediction models: one with good calibration performance (A) and the other with poor calibration per-formance (B).
AUC of a new model=0.746 AUC of an old model=0.631 AUC improved by 0.115 (p<0.001)
Decile of predicted risk
Decile of predicted risk Good calibration
Poor calibration 0
0 5
5 10
10 15
15 20
20
Di
se
as
e
ris
k (
%
)
Di
se
as
e
ris
k (
%
)
1
1 2
2 3
3 4
4 5
5 6
6 7
7 8
8 9
9 10
10
A
B
Predicted Observed
[image:3.595.314.540.362.696.2]two models predict disease risk for each individual. With adding lines indicating cut-off points for risk classification, the plot can show who are to be reclassified into a different category when we replace the old prediction model with a new one.7,13
Validating the risk prediction model
When a new risk prediction model is developed, it needs to be validated in a dataset independent of the dataset that has been used to develop the model. Validating and updating (if needed) the developed model are important because, with-proved risk stratification. These tables quantify the correct
and incorrect movements of participants into specific cate-gories after applying the new prediction model.18 Any
par-ticipants with an event who moved upward (reclassified into higher risk categories) or without an event who moved downward (reclassified into lower risk categories) indicate that a correct reclassification has been made. On the con-trary, any downward movement for participants with an event or upward movement for participants without an event implies that an incorrect reclassification was made. The NRI is calculated as the difference of the proportion of patients correctly classified minus that of those incorrectly classified (Table 1).18
NRI=[p(up|D=1)-p(down|D=1)]-[p(up|D=0)-p(down|D=0)] (D represents an event; 1 for event, 0 for non-event) The integrated discrimination improvement (IDI) index is another reclassification tool that calculates the new mod-el’s ability to improve integrated sensitivity without sacri-ficing integrated specificity.18
IDI=(ISnew-ISold)-(IPnew-IPold)
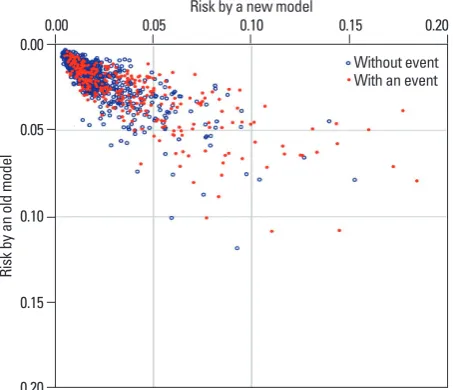
(IS; integrated sensitivity, IP; integrated specificity) Moreover, bar graphs and scatter plots can be employed to depict the predictive performance of the developed mod-el in diverse aspects.7 Fig. 3 is a simulated scatter plot
[image:4.595.58.528.81.262.2]com-paring the performance of two prediction models. Vertical and horizontal axes indicate the risks predicted by an old model and a new model, respectively. The red dots are those with an event of interest, and the blue open circles are those without event. This plot visually displays how closely the
Table 1. Simulated Reclassification Tables Comparing Two Prediction Models
New risk category
Low Intermediate High Total
Participants with an event Old risk category
Low 30 50* 0* 80
Intermediate 5† 130 70* 205
High 0†
5†
110 115
Total 35 185 180 400
Participants without an event Old risk category
Low 390 130† 0† 520
Intermediate 20* 190 40† 250
High 0* 10* 20 30
Total 410 330 60 800
Net reclassification improvement for those with the event: (50+70-5-5)/400=27.5%. Net reclassification improvement for those without the event: (20+10-130-40)/800=-17.5%. Overall net reclassification improvement: (27.5%)+(-17.5%)=10.0%.
*People who are correctly reclassified when applying the new prediction model. †People who are incorrectly reclassified when applying the new prediction model.
Fig. 3. Simulated scatter plot comparing the performance of two prediction models. Vertical axis indicates the risk predicted by an old model. Horizontal axis indicates the risk predicted by a new model. The red dots are those with an event of interest, and the blue open circles are those without event.
Risk by a new model
0.20 0.15 0.10 0.05 0.00
Ri
sk
b
y a
n
ol
d
m
od
el
[image:4.595.300.527.325.520.2]heart disease, brain infarction, intermittent claudication, and hypertensive heart failure.22 In this model, a multiple
logis-tic regression model was applied to obtain regression coef-ficients of each risk factor, and a risk function score was de-veloped with the coefficients of an efficient set of risk factors. Using this model, health care professionals identified per-sons at a high CVD risk who need preventive treatment.22
The Framingham Risk Score has been continuously devel-oped and modified based on updated evidence. For exam-ple, Cox’s proportional hazards regression analysis has been used to estimate an individuals’ 10-year total CVD risk as well as a specific CVD risk (for atrial fibrillation, coronary heart disease, congestive heart failure, diabetes mellitus, hypertension, and intermittent claudication).21,23
Furthermore, a 30-year risk and lifetime risk of developing various CVDs have been suggested using advance statisti-cal techniques to avoid bias in the assessment of true abso-lute risk.12
Even though the Framingham Heart Study results are fundamental evidence for the prediction of CVD risk, risk factors and the effect of risk factors on developing CVDs may differ by population. In fact, a study tested the Fram-ingham Risk Score using the 2001 Korea National Health and Nutrition Examination Survey data, which is linked to the Korea National Health Insurance Corporation and is a representative population of non-institutionalized Kore-ans.24 They reported that the Framingham model
overesti-mated the risk of ischemic heart disease (IHD) by 150% to 320%.24 Thus, even a well-established risk prediction
mod-el such as the Framingham Risk Score requires frequent re-calibration or adjustment for use in other populations in-cluding the Korean population. More preferably, a CVD risk prediction model should be developed and validated using cohort data from the Korean population. One group of researchers in Korea has developed an IHD prediction model based on health screening and national health insur-ance data, which is a representative population of Kore-ans.25 Data are from biennial health screening tests between
1992 and 1995 of civil servants, school teachers, and their spouses insured by the National Health Insurance Corpora-tion.25 For outcome variables, deaths from IHD between
1993 and 2002 were detected by linking the Cause of Death Statistics database from the Korea National Statistical Of-fice, and hospital admissions for IHD between 1998 and 2002 were identified using the National Health Insurance Corporation claim database.25 Among a total of 931467
par-ticipants, a random sample of half of the population was out generalizability, the model may perform poorly in a real
clinical setting. For validation, an internal or external datas-et can be used. For internal validation, a study datasdatas-et is randomly divided into two subsets; one for developing and the other for validating the suggested model.19
Bootstrap-ping, which repeatedly tests the model in the different ran-dom subsets of the total dataset, is a preferred method for internal validation, especially when the study dataset is too small to be divided into development and validation sub-sets.20 However, validating a model in an external dataset is
desirable because by testing the new model in a more gen-eralized population, the reliability of its performance can also be tested.19 Additionally, testing for temporal validation
(using data from a different time period), geographical vali-dation (using data from another geographic area), and do-main validation (using data collected in a different setting) also provide information on the generalizability of the mod-el.9,20 As was true for the development of the model, global
model fitness, discrimination, calibration, and/or reclassifi-cation analyses also need to be evaluated in the validation dataset.19
EXAMPLES OF CHRONIC DISEASE
RISK PREDICTION MODELS
Cardiovascular disease risk prediction models
The Framingham Risk Score is the most well-known ex-ample of a health risk assessment model that assesses an in-dividuals’ cardiovascular disease (CVD) risk and suggests lifestyle changes and/or early pharmacologic treatment for individuals. The Framingham Heart Study started with 5209 Framingham residents between the ages of 30 and 62 in 1948. The major aim of the original cohort was to secure epidemiological data on arteriosclerotic and hypertensive CVD, and successfully followed up these participants.21
From 1960, major CVD risk factors including cigarette smoking, cholesterol level, blood pressure, physical inactiv-ity, left ventricular hypertrophy, and glucose intolerance have been specified based on this cohort.21 The
Framing-ham Heart Study was expanded to the Offspring Cohort in 1971, the Ommi cohort in 1994, the Third Generation Co-hort in 2002, and the New Offspring Spouse CoCo-hort and Second Generation Ommi Cohort in 2003 to reflect the di-verse community in Framingham.21 After the 18 years of
of breast biopsies showing atypical hyperplasia, and race or ethnicity.28
Recently, a Korean breast cancer risk assessment tool was developed based on the modified Gail’s equation.29
The study included 3789 sets of cases and controls from the Seoul Breast Cancer Study. In this population, the identified risk factors for women under the age of 50 were a family history of breast cancer in first-degree relatives, age at men-arche, age at first full-term pregnancy, menopausal status, breastfeeding duration, oral contraceptive usage, and exer-cise. Breast cancer incidence and mortality was calculated from the Korean National Cancer Registry and the Cause of Death Statistics from the Korea National Statistical Of-fice, respectively. Individual probabilities of developing breast cancer were projected by combining information on an individual’s relative risk, baseline hazard rate, and com-peting risk. The developed model was validated in two sep-arate Korean cohorts; the AUC values were 0.61 in the Ko-rean Multicenter Cancer Cohort and 0.89 in the National Cancer Center Cohort. This breast cancer risk assessment tool used the modified Gail model; however, the original Gail model was developed for women who participated in annual mammographic screening program, therefore fur-ther adjustment in the Korean model is needed. Additional-ly, because the study participants were Korean women who visited three teaching hospitals in Seoul for either breast cancer treatment or a community health screening, they may not represent the total population of Korean women. Therefore, this modified Gail model should be further vali-dated in a representative, epidemiological cohort of Korean women.
CLINICAL APPLICATION
The health care burden of NCDs has been rapidly increas-ing, but fortunately NCDs are preventable by managing risk factors.4,5 However, each individual is concomitantly
exposed to multiple risk factors and at various exposure levels; therefore, tailored medical decisions are required to identify an individual’s disease risk and to provide person-alized care. Validated, reliable NCD prediction models as-sist healthcare professionals in the decision-making process by selecting candidates for intensive preventive interven-tions or additional tests.30,31 For individuals, knowing their
predicted risk increases their awareness of their chronic dis-ease and the importance of prevention, helps to communi-used to develop an IHD prediction model incorporating risk
predictors of age, total cholesterol, systolic blood pressure, smoking, and diabetes.25 After development, the model was
validated in the other half of the population by dividing risk of IHD into percentiles of 10 for predicted risk.25 The
C-sta-tistic, which shows the discriminatory power of the model, was 0.75 for men and 0.80 in women.25 This is the first IHD
risk prediction model that was developed based on Korean data, but several limitations exist. Although the three datas-ets employed to develop the model (data from health screen-ings, cause of death statistics, and insurance claims) were collected nationwide, they were not originally constructed for research purposes. Therefore, available risk predictors were limited and the measurements were not fully stan-dardized. Moreover, the causes of death and hospitalization records were not centrally adjudicated. Last, the clinical usefulness of this model in Korea is limited because most of the assessed individuals will fall into low-risk categories; therefore, individual preventative strategies cannot be de-termined clinically.
Breast cancer prediction models
Another example of a health risk assessment model is the Breast Cancer Risk Assessment Tool (Gail model) that helps to identify high-risk individuals among screened women. As a part of the Breast Cancer Detection Demonstration Proj-ect, data from 2852 Caucasian women who were first diag-nosed with breast cancer between 1973 and 1980 and 3146 controls were used to calculate the relative risk for each risk factor and estimate probabilities of developing breast can-cer.26 In this model, variables related to a family history of
breast cancer in a first-degree relative, a late age at first childbirth, early menarche, and multiple previous benign breast biopsies were included.26 Ten years later, this model
was validated in 5969 Caucasian women who were fol-lowed up for 48.4 months and was found to provide useful information for women who plan to participate in regular mammographic screenings.27 Since its validation, it has
been updated for atypical hyperplasia and to include Afri-can AmeriAfri-cans and Asian AmeriAfri-cans using the Contracep-tive and ReproducContracep-tive Experiences Study and the Asian American Breast Cancer Study, respectively.28 The current
breast cancer, and colorectal cancer are among the most fre-quently predicted chronic diseases in Western countries; however these diseases are relatively uncommon in the Ko-rean population. Although the incidence of these diseases is rapidly increasing in Korea, the currently measured inci-dences are still lower than that of Western populations. Therefore, a majority of individuals fall into the low-risk group when their disease risk is assessed with a prediction model. Even with a disease prediction model that is validat-ed in a Korean population, high-risk individuals who merit aggressive preventive treatment are difficult to identify. Fi-nally, clinical practice guidelines and recommendations are not widely accepted in Korea as a method for disease pre-vention.7 Assessing an individual’s disease risk has only
limited clinical value because the predicted disease risk has little influence on the clinical decision-making process for chronic disease prevention.
FUTURE OF CHRONIC DISEASE
PREDICTION
A large number of disease prediction, risk assessment, and health risk appraisal tools have been developed and recom-mended for general clinical use. However, their prediction accuracy and clinical utility vary widely. Moreover, there is little evidence supporting the idea that existing chronic dis-ease prediction tools can improve clinical outcomes. Chron-ic disease predChron-iction models deemed relevant to the Korean population should be continuously developed, validated, up-dated, and modified using prospective epidemiologic data. Newly suggested prediction models should be assessed ex-tensively for their predictive power and clinical utility, and independent datasets should be employed when possible. These approaches require diverse community-based cohort studies with adequate sample size, follow-up length, and outcome adjudication. In the meantime, substantial efforts are required to improve risk communication, motivate phy-sicians and individuals to execute preventative strategies, and develop clinical decision-making algorithms.
ACKNOWLEDGEMENTS
This work was supported by a grant of the Korean Health Technology R&D Project, Ministry of Health & Welfare, Republic of Korea (HI13C0715).
cate their risk levels with others and their physicians, and motivates lifestyle modifications or adherence to treatment.30
In the field of NCD prediction, developing an accurate and reliable prediction model is fundamental, yet other characteristics are required before the model can be deemed clinically useful. First, to use a NCD prediction model in broad range of populations with confidence, intensive mod-el validation and continuous updates are required. Second, the model’s ease of use is also important. Physicians and in-dividuals should have easy access to the model and be able to easily calculate disease risk as well as interpret the re-sults to encourage widespread use. Finally, the rere-sults of the prediction model should be linked to clinical practice. The Gail model is a good example of a clinically useful NCD prediction tool, and the modified Gail model has been ex-tensively validated and updated worldwide. Both models are easily accessible to physicians and their patients to cal-culate breast cancer risk. For example, when a five-year breast cancer risk of 1.66 percent or higher is calculated by the modified Gail model, the patient is advised to begin preventive chemotherapy to reduce breast cancer risk.32
Thus, the modified Gail model continues to be widely used in daily clinical practice.
The clinical utility of a disease prediction model can be population specific because the baseline disease risk, sub-type distribution of the disease, and exposure levels to risk factors differ by region and ethnicity. Several chronic dis-ease risk prediction models have been suggested for use in the Korean population,29,32-36 but have not been employed as
20. Moons KG, Kengne AP, Grobbee DE, Royston P, Vergouwe Y, Altman DG, et al. Risk prediction models: II. External validation, model updating, and impact assessment. Heart 2012;98:691-8. 21. Mahmood SS, Levy D, Vasan RS, Wang TJ. The Framingham
Heart Study and the epidemiology of cardiovascular disease: a historical perspective. Lancet 2014;383:999-1008.
22. Kannel WB, McGee D, Gordon T. A general cardiovascular risk profile: the Framingham Study. Am J Cardiol 1976;38:46-51. 23. Grundy SM, Pasternak R, Greenland P, Smith S Jr, Fuster V.
As-sessment of cardiovascular risk by use of multiple-risk-factor as-sessment equations: a statement for healthcare professionals from the American Heart Association and the American College of Car-diology. Circulation 1999;100:1481-92.
24. Ahn KA, Yun JE, Cho ER, Nam CM, Jang Y, Jee SH. Framing-ham equation model overestimates risk of ischemic heart disease in Korean men and women. Korean J Epidemiol 2006;28:162-70. 25. Jee SH, Song JW, Cho HK, Kim SY, Jang YS, Kim JH. Develop-ment of the individualized health risk appraisal model of ischemic heart disease risk in Korea. Korean J Lipidol 2004;14:153-68. 26. Gail MH, Brinton LA, Byar DP, Corle DK, Green SB, Schairer C,
et al. Projecting individualized probabilities of developing breast cancer for white females who are being examined annually. J Natl Cancer Inst 1989;81:1879-86.
27. Costantino JP, Gail MH, Pee D, Anderson S, Redmond CK, Beni-chou J, et al. Validation studies for models projecting the risk of invasive and total breast cancer incidence. J Natl Cancer Inst 1999;91:1541-8.
28. Park S, Nam BH, Yang HR, Lee JA, Lim H, Han JT, et al. Indi-vidualized risk prediction model for lung cancer in Korean men. PLoS One 2013;8:e54823.
29. Park B, Ma SH, Shin A, Chang MC, Choi JY, Kim S, et al. Kore-an risk assessment model for breast cKore-ancer risk prediction. PLoS One 2013;8:e76736.
30. Lloyd-Jones DM. Cardiovascular risk prediction: basic concepts, current status, and future directions. Circulation 2010;121:1768-77. 31. Cui J. Overview of risk prediction models in cardiovascular
dis-ease research. Ann Epidemiol 2009;19:711-7.
32. Visvanathan K, Hurley P, Bantug E, Brown P, Col NF, Cuzick J, et al. Use of pharmacologic interventions for breast cancer risk re-duction: American Society of Clinical Oncology clinical practice guideline. J Clin Oncol 2013;31:2942-62.
33. Shin A, Joo J, Yang HR, Bak J, Park Y, Kim J, et al. Risk predic-tion model for colorectal cancer: Napredic-tional Health Insurance Cor-poration study, Korea. PLoS One 2014;9:e88079.
34. Jo J, Nam CM, Sull JW, Yun JE, Kim SY, Lee SJ, et al. Prediction of Colorectal Cancer Risk Using a Genetic Risk Score: The Kore-an CKore-ancer Prevention Study-II (KCPS-II). Genomics Inform 2012;10:175-83.
35. Asia Pacific Cohort Studies Collaboration, Barzi F, Patel A, Gu D, Sritara P, Lam TH, et al. Cardiovascular risk prediction tools for populations in Asia. J Epidemiol Community Health 2007;61:115-21.
36. Jee SH, Park JW, Lee SY, Nam BH, Ryu HG, Kim SY, et al. Stroke risk prediction model: a risk profile from the Korean study. Atherosclerosis 2008;197:318-25.
REFERENCES
1. Noncommunicable diseases. 2013. [accessed on 2013 Dec. 26]. Available at: http://www.who.int/mediacentre/factsheets/fs355/en/. 2. Ezzati M, Riboli E. Can noncommunicable diseases be prevented?
Lessons from studies of populations and individuals. Science 2012;337:1482-7.
3. Rosamond W, Flegal K, Friday G, Furie K, Go A, Greenlund K, et al. Heart disease and stroke statistics--2007 update: a report from the American Heart Association Statistics Committee and Stroke Statistics Subcommittee. Circulation 2007;115:e69-171. 4. Ford ES, Ajani UA, Croft JB, Critchley JA, Labarthe DR, Kottke
TE, et al. Explaining the decrease in U.S. deaths from coronary disease, 1980-2000. N Engl J Med 2007;356:2388-98.
5. Doll R, Peto R, Boreham J, Sutherland I. Mortality in relation to smoking: 50 years’ observations on male British doctors. BMJ 2004;328:1519.
6. Statistics Korea. 2012 Annual report on the cause of death statis-tics. Daejeon, Korea: Statistics Korea; 2013.
7. Kim HC. Clinical utility of novel biomarkers in the prediction of coronary heart disease. Korean Circ J 2012;42:223-8.
8. Laupacis A, Sekar N, Stiell IG. Clinical prediction rules. A review and suggested modifications of methodological standards. JAMA 1997;277:488-94.
9. Toll DB, Janssen KJ, Vergouwe Y, Moons KG. Validation, updat-ing and impact of clinical prediction rules: a review. J Clin Epide-miol 2008;61:1085-94.
10. Moons KG, Kengne AP, Woodward M, Royston P, Vergouwe Y, Altman DG, et al. Risk prediction models: I. Development, inter-nal validation, and assessing the incremental value of a new (bio) marker. Heart 2012;98:683-90.
11. Putter H, Fiocco M, Geskus RB. Tutorial in biostatistics: compet-ing risks and multi-state models. Stat Med 2007;26:2389-430. 12. Pencina MJ, D’Agostino RB Sr, Larson MG, Massaro JM, Vasan
RS. Predicting the 30-year risk of cardiovascular disease: the framingham heart study. Circulation 2009;119:3078-84.
13. McGeechan K, Macaskill P, Irwig L, Liew G, Wong TY. Assess-ing new biomarkers and predictive models for use in clinical prac-tice: a clinician’s guide. Arch Intern Med 2008;168:2304-10. 14. Harrell FE. Regression Modeling Strategies: With Applications to
Linear Models, Logistic Regression, and Survival Analysis. New York: Springer; 2001.
15. Harrell FE Jr, Califf RM, Pryor DB, Lee KL, Rosati RA. Evaluat-ing the yield of medical tests. JAMA 1982;247:2543-6.
16. Pencina MJ, D’Agostino RB. Overall C as a measure of discrimi-nation in survival analysis: model specific population value and confidence interval estimation. Stat Med 2004;23:2109-23. 17. Hosmer DW, Lemeshow S. Applied logistic regression. New
York: Wiley; 2000.
18. Pencina MJ, D’Agostino RB Sr, D’Agostino RB Jr, Vasan RS. Evaluating the added predictive ability of a new marker: from area under the ROC curve to reclassification and beyond. Stat Med 2008;27:157-72.