COMPETENCE TO ENERGY CONSEQUENCE
WITH SELF-POWER-DRIVEN SENSOR FOR ASSESSING AIR
PARAMETERS
1G.Ramachandran, 2
T.MuthuManickam, 3
N.Manikanda Devarajan 4
S.kannan 5
V.Manikandan 6
S.Deepika
ABSTRACT
Assessing air parameters are important in many applications. This project monitors the air
parameters like temperature, velocity and humidity with the help of electromechanical generator
scavenging e n e r g y f r o m t h e airflow. It periodically transmits the measured air parameters
to a receiving unit.
The system basically consists of two macro blocks, respectively: solar cell along with the
self-power wireless sensor and the receiving unit. The self-self-powered sensor has a section devoted to
the energy harvesting, exploiting the movement of an airscrew shaft keyed to a dc motor when
the airflow is greater than 4m/s. The solar cell helps to power the transmitter continuously even
when the airflow is less than 4m/s. The data transmission is with radio-frequency transmitter at
433 MHz, allowing covering a distance between the sensor and the reader on the order of 4–5
m, depending on the power supplied in transmission.
The air velocity is measured through the rotor frequency of the electromechanical generator
whereas, for the temperature, a commercial thermistor is used, and for humidity, a low power
sensor is used. The system can be used for real-time monitoring of air parameters. The sensor
module placed into the duct does not require any batteries which reduces size, weight and
unwanted maintenance burden of replacement.
Keywords: Temperature Transmitter, Receiver, Sensor, Velocity.
1-6 Assistant Professor, Dept of Electronics& communication Engineering
1,-5 V.M.K.V Engineering College, Salem Tamil Nadu, India
1. INTRODUCTION
1.1. An Outlook
Airflow measurements contribute to determine the indoor air quality and to provide healthy environments for the occupants of the buildings. The commercial airflow measurement system commonly requires a battery, but, recently, in the literature, alternative systems supplied by power-harvesting modules are proposed. However, there are many reasons to eliminate the battery adoption: the size and weight of the devices and the unwanted maintenance burdens of replacement. Moreover, the disposal of the increasing number of batteries is creating an important environmental impact as they contain toxic chemicals.
This project describes a self-powered sensor that, without any battery, autonomously performs the measuring functions and transmits data to an external receiving unit. The proposed sensor is powered by a harvesting system that exploits the mechanical energy coming from the velocity of airflow. Since particular power supply is not required, the self-powered sensor can easily be installed at any point of a building. In the literature, airflow harvesters are evaluated for their potential utilization in autonomous measurements.
1.2 Objective
This project monitors the air parameters like temperature, velocity, and humidity using electromechanical generator scavenging energy from t h e airflow has been designed and tested. It periodically transmits the measured air parameters to a receiving unit. The system basically consists of two macro blocks, respectively: solar cell along with the self-power wireless sensor and the receiving unit.
In general, it is necessary for the power consumption of the harvesting electronics to be less than the available power for harvest, which varies as a function of airflow velocity. In recent years, several groups have demonstrated small airflow harvesters based on the wind turbine principle. For this purpose, a properly sized small airflow turbine is required to exploit the available airflow potential for producing electrical energy. An airflow measurement system for velocity higher and lower than 5 m/s with power- harvesting capability is proposed for short-range application for monitoring purposes.
slower flows, the sensor is off, and the data is transmitted with the help of solar power. The measurement data are acquired every 2 s. The receiving unit is always on and ready. The system allows real-time measurement.
1.3 Self-Power-Driven Sensor
In self-powered wireless sensor a commercial airscrew is connected to an electromagnetic generator. The harvested power, using the air motion energy, supplies an electronic circuit for the measurements of air temperature and velocity. The microcontroller, which coordinates the operation of the self-powered wireless sensor, initially is in an idle state. Every 2 s, it wakes up and switches on the sensor modules to execute temperature and velocity measurements.
Subsequently, the microcontroller turns on the transmitter module and sends the package; after the transmission, it returns to the idle state. On the other hand, when the transmission power consumption is high, the energy storage system is recharged during the interval in which the sensor module is off. The interval of 2 s was considered sufficient to allow proper operation of the system since the measured quantities (temperature, humidity and velocity) have a slow dynamic. Finally, the microcontroller switches off the transmitter and returns to the idle state. Since the self-powered sensor is a wireless device, it encounters the typical problems of a wireless network.
In this application, a point-to-point communication has been implemented. Point-to-point communication avoids managing the complexity of a network protocol, saving power, and making the system compatible with the available low energy. For these reasons, the self-powered sensor implements a simple communication at 433 MHz; other wireless protocols such as Bluetooth or Wi-Fi are more expensive in terms of power consumption.
1.3.1 Airflow Power
The number of blades of an airscrew is related to the efficiency at low velocity; geometry with a low number of blades ensures a higher efficiency at low velocity. The available theoretical airflow power can be calculated with the kinetic energy, according to the following expression:
observation time, and m is the mass. The kinetic energy can be easily converted into the airflow power
This power is a function of area A, airflow velocity v, and air density ρ, which can be assumed to be of 1.2 kg/m3 in civil and industrial contests. However, the theoretical maximum quantity of energy for a standard area of 55 cm2 and an air velocity of 4.5 m/s is about 300 mW. A generator module cannot extract all of this power since the relatively high viscous drag on the blades, the bearing losses, and other factors. The formula is corrected with a power coefficient that is less than unity Cp. Large-scale airflow harvesters can be highly efficient, with power coefficients greater than 0.5; for small-scale airflow harvesters, the performance is less good, i.e., about 0.1. This large variation in efficiency is caused by friction in the generator, internal electric resistance, and other nonidealities in the transduction between mechanical and electrical energy. The power extracted by a practical turbine is thus
Assuming that the turbine is coupled to an energy transmission with efficiency ηm that drives a generator of efficiency ηg, the electrical power Pe available can be written as
The energy harvester efficiency is defined as the power extracted from the airflow over the kinetic power available for the area covered by the airscrew.
1.3.2 Sensor Activities
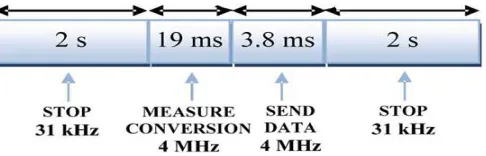
The entire device has a low-power configuration: all the unused peripherals are switched off. To maintain the power consumption low, the clock of the microcontroller is 4 MHz during measurement and transmission activities, whereas the clock is 31 kHz during stop mode.
[image:4.612.184.427.597.675.2]
In Fig. 1.1, the time interval of each activity is given; the stop mode is 2 s long: in this state, the microprocessor clock is set to 31 kHz. Subsequently, the system wakes up and measures the temperature, humidity and velocity in about 19 ms, sends these data to the receiving unit in 3.8 ms, and then switches off. The transmission packet consists of 60 bits: two nibble for the start and end transmission synchronization and three measurement data, each of 16 bits.
1.3.3 Wake-Up Signals Of Sensor
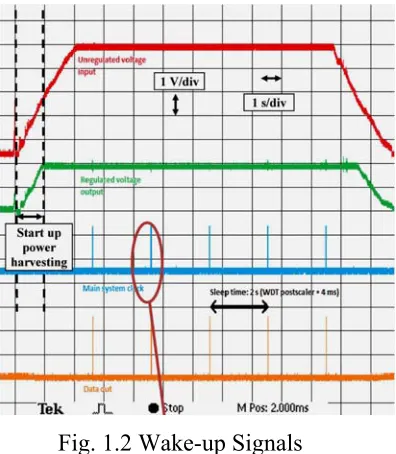
The unregulated voltage of the generator, the regulated voltage of the self-powered wireless sensor, the main system clock, and the data sent to the transmitter are reported in Fig. 1.2
[image:5.612.219.417.277.504.2]
Fig. 1.2 Wake-up Signals
In the time interval labeled as “Start-up power harvesting,” the airflow generator is turned on, and the power-harvesting module begins to power the sensor. The start-up time is about 1 s. From this moment, the system is powered, and it continuously works, as long as the airflow velocity is maintained.
2.
SYSTEM ANALYSIS
2.1 Existing System
The self-powered sensor that, without any battery, autonomously performs the measuring functions. The sensor is powered by a harvesting system. It exploits the mechanical energy coming from the velocity higher than 4m/s of airflow for short range applications.
below the threshold. It measures only the air temperature and velocity.The parameters cannot monitored whenever the wind speed is < 5m/s. This speed of airflow will not be sufficient to harvest energy and to power the electronic circuit. Real-time monitoring is not possible when the wind speed is low.
Fig 2.1 wind speed measurements (From reference [6])
From Fig 2.1 the wind speed was above 5m/s for more than 90% of the period, a value that justifies kinetic energy harvesting by a small wind turbine.
2.1.1 Drawbacks
1. The parameters cannot monitor whenever the wind speed is < 5m/s.
2. This speed of airflow will not be sufficient to harvest energy and to power the electronic circuit.
3. Real-time monitoring is not possible when the wind speed is low.
4. The number of blades of an airscrew is related to the efficiency at low velocity. 5. This system only measures two air parameter i.e., temperature and velocity. 6. The receiver not receives any data when the sensor is off in the transmitter.
2.2 Proposed System
The self power-driven sensor is powered by a harvesting system. It exploits the mechanical energy coming from the velocity higher than 5m/s of airflow for short range applications. A self-powered sensor is powered by the servomotor to harvest energy from the airflow when it is > 5m/s.
measurement system for velocity higher and lower than 5m/s with power- harvesting capability is proposed.
The sensor continuously operates for airflow greater than 5 m/s. For slower flows, the sensor is off, and the data is transmitted with the help of solar power. The measurement data are acquired every 2 s. The receiving unit is always on and ready. The real time monitoring of air
parameters is possible for any wind speed. Proposed system not only measures the parameter like temperature and
[image:7.612.167.446.257.387.2]velocity but also it measures humidity range in air.
Fig 2.2 Wind speed Vs Power (From reference [6])
Fig 2.2 shows the wind speed verses voltage and power. Wind speed sensor transfer function (solid line) and extracted electrical power (dashed line) obtained from the prototype of small wind turbine evaluated.
2.2.1 Advantages
1. The solar cell helps to power the transmitter continuously even when the airflow is less than 5m/s.
2. The real time monitoring of air parameters is possible for any wind speed.
3. Proposed system not only measures the parameter like temperature and velocity but also it measures humidity range in air.
4. Point-to-point communication avoids managing the complexity of a network protocol, saving power, and making the system compatible with the available low energy.
3.
PROJECT DESCRIPTION
3.1 Problem Definition
magnetic airflow harvester to harvest the energy for the power supply. The harvested power, using the air motion energy, supplies an electronic circuit for the measurements of air temperature, humidity and velocity.
The air velocity is measured through the rotor frequency of the electromechanical generator, whereas, for the temperature and humidity, a commercial low-power sensor is used. The sensor is powered by a harvesting system. It exploits the mechanical energy coming from the velocity higher than 4m/s of airflow for short range applications. For slower flows, the sensor is off, and the receiver assumes that the velocity of air is below the threshold. It measures only the air temperature and velocity. The parameters cannot monitor whenever the wind speed is < 5m/s. The parameters cannot be monitored when the wind speed is low; therefore the real time monitoring is not possible.
To overcome the above condition, one more renewable source is used other than the wind i.e., solar energy. With the help of solar energy the electronic circuit in the transmitter is powered to monitor the data whenever the wind speed is less than the threshold level.
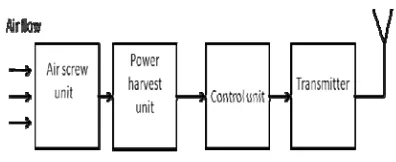
[image:8.612.262.460.385.466.2]3.2 Transmitter Module
Fig. 3.2.1 Simple block diagram of Transmitter
The efficiency of the air screw unit depends upon the number of blades. The air screw unit harvest power according to the wind flow. The power harvest unit gets the power either through the air screw unit or through the solar cell. The control unit and the transmitter are powered via the harvesting unit. No battery is used. It transmits the measured data to the receiving unit from the harvested power.
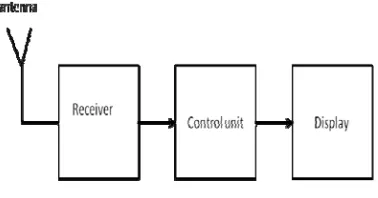
Fig. 3.3.1 Simple block diagram of Receiver
The receiver module is always ready and on to receive the measured data. The data here is air temperature, humidity range in air and air velocity. The receiver is placed is 4-5m apart from the transmitter. It just displays the measured data from the remote location. This system helps to monitor the weather of a remote area. The received data is either displayed in LCD or in PC for further comparison with the standard levels or can also be used to perform a controlling action or to control the next stage in industrial application.
3.4 Block Diagram: 3.4.1 Transmitter
[image:9.612.223.435.373.547.2]
3.4.2 Receiver
Fig. 3.4.2 Block diagram of Receiver
3.4.3Transmitter VCC U3 lcd 1 2 3
4 5 6
7 8 9 10 11 12 13 14 gnd vcc -5 RS R/ W CL O C K D0 D1 D2 D3 D4 D5 D6 D7 hum 1 3 2 VCC VCC U4 AT89C52 9 18 19 20 29 30 31 40 1 2 3 4 5 6 7 8 21 22 23 24 25 26 27 28 10 11 12 13 14 15 16 17 39 38 37 36 35 34 33 32 RST XT A L 2 XT A L 1 GN D PS EN ALE/PROG EA/ V PP VC C P1.0 P1.1 P1.2 P1.3 P1.4 P1.5 P1.6 P1.7 P2.0/A8 P2.1/A9 P 2 .2/A 10 P2.3/A11 P2.4/A12 P2.5/A13 P2.6/A14 P2.7/A15 P3.0/RXD P3.1/TXD P3.2/INTO P3.3/INT1 P3.4/TO P3.5/T1 P3.6/WR P3.7/RD P0.0/AD0 P0.1/AD1 P0.2/AD2 P0.3/AD3 P0.4/AD4 P0.5/AD5 P0.6/AD6 P0.7/AD7 Velocity 1 3 2 TX U4 1 2 3 4 ANT DATA GN D V C C VCC VCC Y1 12MHZ C7 22PF R3 10K 1 3 2 C 10K 1 2 3 4 5 6 7 8 9 VCC U5 ADC0809 26 27 28 1 2 3 4 5 12 16 10 9 7 17 14 15 8 18 19 20 21 25 24 23 6 22 11 13 IN0 IN1 IN2 IN3 IN4 IN5 IN6 IN7 RE F + RE F -CL K OE EOC D0 D1 D2 D3 D4 D5 D6 D7 A0 A1 A2 START ALE VC C GN D C8 22PF E2 ANTENNA 1
[image:10.612.182.441.341.634.2]U3
lcd
1
2 3
4 5 6
7 8 9 10 11 12 13 14 gn d vc c -5
RS R/W CL
[image:11.612.154.414.91.302.2]O C K D0 D1 D2 D3 D4 D5 D6 D7 C8 22PF U4 AT89C52 9 18 19 20 29 30 31 40 1 2 3 4 5 6 7 8 21 22 23 24 25 26 27 28 10 11 12 13 14 15 16 17 39 38 37 36 35 34 33 32 RST XT AL 2 XT AL 1 GN D PS E N ALE/PROG EA /V P P VC C P1.0 P1.1 P1.2 P1.3 P1.4 P1.5 P1.6 P1.7 P2.0/A8 P2.1/A9 P 2 .2 /A 1 0 P2.3/A11 P2.4/A12 P2.5/A13 P2.6/A14 P2.7/A15 P3.0/RXD P3.1/TXD P3.2/INTO P3.3/INT1 P3.4/TO P3.5/T1 P3.6/WR P3.7/RD P0.0/AD0 P0.1/AD1 P0.2/AD2 P0.3/AD3 P0.4/AD4 P0.5/AD5 P0.6/AD6 P0.7/AD7 VCC E2 ANTENNA 1 RX U4 1 2 3 4 ANT DATA GN D V C C C7 22PF Y 1 12MHZ VCC VCC R3 10K 1 3 2 3.4.4 RECEIVER
Fig. 3.4.4.1 Circuit diagram of Receiver
4 CIRCUIT DESCRIPTIONS
The complete circuit diagram (Fig 4.10-TX Module & Fig 4.11-RX Module) of the remote monitoring of power parameters is shown in the figure. The power supply is provided in the circuit, the capacitor connected to Pin No.9 (RST) provides the power on reset of the micro controller.
4.1 Potential Transformer
It is energized by the input. Theoretically the potential transformer convert in its input of 250V which as 12V. The output of the potential transformer is led to the potential divider to reduce the voltage further. To move further the output of the potential divider has to be given to a rectifier for producing direct voltage. But specifically we have to use full wave precision rectifier
4.2Current Transformer
but it obvious that current will be step down. The current transformer has primary to secondary current ratio of 100:5. Then it will up the voltage twenty timing whereas it steps down the current to 1/20 of its actual value. Hence if we know current ratio 1/12 of the transformer and the reading of the AC ammeter, the line current can be calculated. In fact the current transformer
gives the current at sense ratio times on the ammeter. Since the ammeter resistance
is very low.
4.3Clock and Reset circuit
The clock and reset circuit is functioning both the transmitter side and receiver side. Two no. of 22 pf capacitors, are connected to pin 18 and 19 of the micro controller respectively, with a 12 MHz Piezo electric crystal across them. The clock frequency of the micro controller is depends upon the frequency of the crystal, oscillator used. Typically maximum and minimum are 1 MHz and 16 MHz respectively. So we should use the Piezo electric with this frequency range.
The circuit has two parts 1) Transmission end 2) Receiving end.
4.4Transmitter
The complete circuit diagram of the transmitter part is shown in the figure. If the power supply is provided in the circuit, the capacitor connected to Pin No.9 (RST) provides the power on reset of the micro controller. LCD directly connected to micro controller port 1. Control lines are connected to port 3. ADC line directly connected to port 0. ADC addresses and control lines are directly connected to port 2. Transmitter lines are connected to port 3.
4.5Receiver
5.OUTPUT
The power required by the self-powered wireless sensor in the activities is reported in Table 7.1. As can be seen from the table, the power consumption during measurement activity and stop mode is low, whereas the RF transmission requests about 28 mW of power supply, with a current consumption of about 13 mA and a voltage level of about 2.2 V. The time interval for transmission is still very short, the energy required is greater than the instantaneous power
produced by the harvester, and it is extracted from that stored into the capacitors. Furthermore, since the voltage level generated by the motor is variable and no more than 2.2 V is required by the electronic circuit,the choice of using low power linear regulator is the simplest
5.1Table 7.1 Power Consumption
6.REFERENCES
[1] Emilio Sardini, Mauro Serpelloni (2011) “Self-Powered Wireless Sensor f or Air temperature and Velocity Measurements With Energy Harvesting Capability” IEEE Transactions On Instrumentation And Measurement, Vol. 60, No. 5.
[2] C. C. Federspiel and J. Chen, (2003) “Air-powered sensor,” in Proc. IEEE Sens.,vol. 1, pp. 22–25.
[3] Jivan S.Parab, Santhosh A.Shinde, Vinod G.Shelake, Rajanish K.Kamat, Gourish M.Naik. (1999), “Practical
aspects of Embedded System Design using Microcontrollers”.
[5] D. Marioli, A. Flammini, E. Sardini, and M. Serpelloni,(2010) “An autonomous sensor with energy harvesting capability for airflow speed measurements,”in Proc. I2MTC.
[6] R.Morais,S.G. Matos, M. A. Fernandes, A. L. G. Valente,S. F. S. P. Soares, P. J. S. G. Ferreira, and M. J. C. S. Reis, (2008) “Sun, wind and water flow as energy supply for small stationary data acquisition platforms,” Comput. Electron. Agric., vol. 64, no. 2.
[7] R. Myers, M. Vickers, and H. Kim, (2007) “Small scale windmill,” Appl. Phys. Lett., vol. 90, no. 5, p. 054 106, Jan.
[8] T.S.Rappaport (1996), “Wireless Communications - Principles and Practice”, Prentice Hall PTR.
[9] http://www.atmel.com/
![Fig 2.1 wind speed measurements (From reference [6])](https://thumb-us.123doks.com/thumbv2/123dok_us/46894.1008009/6.612.176.441.153.306/fig-wind-speed-measurements-reference.webp)
![Fig 2.2 Wind speed Vs Power (From reference [6])](https://thumb-us.123doks.com/thumbv2/123dok_us/46894.1008009/7.612.167.446.257.387/fig-wind-speed-vs-power-reference.webp)