0022
Link to Leeds Beckett Repository record:
http://eprints.leedsbeckett.ac.uk/4224/
Document Version: Article
Creative Commons: Attribution 4.0
The aim of the Leeds Beckett Repository is to provide open access to our research, as required by funder policies and permitted by publishers and copyright law.
The Leeds Beckett repository holds a wide range of publications, each of which has been checked for copyright and the relevant embargo period has been applied by the Research Services team.
We operate on a standard take-down policy. If you are the author or publisher of an output and you would like it removed from the repository, please contact us and we will investigate on a case-by-case basis.
* Corresponding author. School of Accounting, Finance and Economics, Faculty of Business & Law, Leeds Beckett University, UK. Email: m.a.nasir@leedsbeckett.ac.uk, ** Faculty of Business & Law, Leeds Beckett University, UK
Journal of Central Banking Theory and Practice, 2017, 3, pp. 95-126 Received: 23 December 2016; accepted: 3 May 2017
UDK: 336.051(420)
DOI: 10.1515/jcbtp-2017-0022
Muhammad Ali Nasir
*, Milton Yagob
**,
Alaa Solimanc
**, Junjie Wud
**Institutional Design,
Macroeconomic Policy
Coordination and Implications for
the Financial Sector in the UK
Abstract: This study has analysed the implications of institutional design of macroeconomic policy making institutions for the macro-economic policy interaction and financial sector in the United King-dom. Employing a Vector Error Correction (VEC) model and using monthly data from January 1985 to August 2008 we found that the changes in institutional arrangement and design of policy making authorities appeared to be a major contributing factor in dynamics of association between policy coordination/combination and finan-cial sector. It was also found that the independence of the Bank of England (BoE) and withdrawal from the Exchange Rate Mechanism led to the increase in macroeconomic policy maker’s ability to coor-dinate and restore financial stability. The results imply that although institutional autonomy in the form of instrument independence (monetary policy decisions) could bring financial stability, there is a strong necessity for coordination, even in Post-MPC (Monetary Policy Committee) and the BoE independence.
Keywords: Macroeconomic Policy Interaction, Institutional Design, Financial Markets, Policy Coordination, Central Bank Independ-ence.
JEL Classification: E02, E44, E52, E58, E61, E63.
1. INTRODUCTION
Macroeconomic policies have significant effects which are not limited to the real economy and a number of studies, for instance, Bredin et al. (2005), Ardagna (2009) and Arnold et al. (2010) reported their significant influence contributing to dynamics of financial sector. In comparison with monetary policy, although less attention has been paid to investigate the association between fiscal policy and the financial sector (Ardagna, 2009; Blanchard et al., 2010) there is sufficiently enough evidence to support the notion of financial stability being also influenced by fiscal stance (see Blanchard et al. 2010; Zigman and Cota, 2011; Benigno et al; 2013). Nevertheless, beside the individual analysis of macroeconomic policies, there is an emerging consensus in recent literature which suggests considering interaction of macroeconomic policies rather than implication of a single policy stance for financial sector (see Jansen et al., 2008; Nasir and Soliman, 2014) which is also the theme of this study.
An important aspect of macroeconomic policies is the structure and design of their parental institutions. The organization structure involves the formal division of organization in subunits, location of decision making responsibilities within that structure and establishment of integrating mechanism to coordinate the activities of subunit of origination (Hill, 2014). Institutional design is an important aspect to be kept under consideration while studying the subject of macroeconomic poli-cies as any change in the framework of policy making institutions could affect the effectiveness of policies they formulate (see Lu and In, 2006; Osborn and Sensier, 2009). Specific to the policy framework in the UK, we can acknowledge some major changes in the past few decades, for instance the membership and departure from Exchange Rate Mechanism (ERM), which was a fixed exchange rate system (with margin of fluctuations) in 1992 or independence of the Bank of England (BoE) in 1997 that resulted in a major shift in institutional design and major changes in the Bank’s traditional responsibilities. Certain responsibilities related to financial stability e.g. banking sector supervision and management of sovereign debt, were all transferred to the Financial Service Authority (FSA) and the Debt Management Office (DMO). In this regard, studies like on New Zealand by Lu and In (2006) and on Britain Osborn and Sensier (2009) indicated variability in the effective-ness of monetary policy after any institutional framework changes. Although there are also some voices declaring these institutional changes for instance the Bank of England’s independence in 1997 as overrated institutional changes for price stabil-ity (see Mariscal and Howells, 2007). Concomitantly refereeing back to the debate on the influence of macroeconomic policy interaction on financial sector, in the context of the UK, it is imperative to analyse the dynamics of macroeconomic pol-icy interactions and coordination in the light of said institutional changes.
This study analyses the implications of structural changes in the design of pol-icy making institutions on the association between polpol-icy interaction and the
financial sector. Specifically, we focused on stock and bond market, the choice of
these two markets as proxy for financial sector because of their Wealth Effects on the real economy (see Malikane and Semmler, 2008; Funke et al., 2011; Airaudo, 2015). Nevertheless, the context in which we are analysing the interaction of mac-roeconomic policies is the financial stability. In this regard, we also refer to
Kon-tonikas et al. (2006) who argue that optimal1 monetary policy should positively
affect stock market and house prices due to Wealth Effects of these assets. Hence
it is not either the stock or bond market we need to positively influence per se, these are their Wealth Effects which justify a macroeconomic policy role. The difference this study is making is by taking it further by taking fiscal policy, bond market and institutional design changes on board. Putting it rather simple, the main aim of this research is to evaluate how the institutional designs influence the associa-tion between policy interacassocia-tion and financial stability. This could be achieved by investigating implications of changes in the institutional design in Britain for policy interaction and financial sector. There are several reasons for the choice of UK financial sector (a) size and significance of subject financial sector for British economy as well as international financial system (b) availability of reliable data from credible sources (c) well established policy making intuitions which have
been leaders in reforms2.
A particular feature of the subject study makes it very pragmatic, as we will be able to see how institutional design defines the ability of policies and the context in which they are formulated. In the context of recent developments to restore fi-nancial stability, it is important to mention here that the BoE has recently
formu-lated Financial Policy Committee (FPC)3. As cited earlier, it is the major change
in functioning of the BoE since May 1997. Since then the official mandate of the
1 Our definition of optimal policy combination for financial stability is to some degree unique
as mostly optimal policy has been seen as a single policy in context of real economy. To pro-vide some support from existing epro-vidence, we refer to Kontonikas et al. (2006) and Khorasgani (2010) which declared a monetary policy as optimal which positively affects Stock and Forex markets.
2 The Britain is leading the world and The Bank of England has been the main source of fresh
thinking, see an interesting account by John Kay (2003). Available at http://www.ft.com/cms/ s/0/40231e4a-dcdc-11e2-b52b-00144feab7de.html#axzz3EDkmBJGK, (accessed 6.6.14).
3 Headed by Governor of the Bank of England this committee would monitor UK financial
BoE was price stability by targeting inflation at 2% Consumer Price Index (CPI)4.
However in the context of these changes it could be well anticipated that in the future, influence on financial sector would also be considered in macroeconomic policy formulation; yet, existing literature does not provide any evidence of it. Neither has it provided great details on the aspect of previous changes nor their implications for under analysis factors of policy interaction and financial sector.
Recent studies also consider it preferable to use both macroeconomics policies si-multaneously while analysing their impact on real economy (Porqueras and Alva, 2010; Sims, 2011). Therefore in this study we would take both fiscal and monetary policies on board. Despite the acknowledged importance of joint policy analysis, most of the studies in the existing literature have been only focused on single policy. Even the limited number of studies which investigated the effects of policy interaction or combination have only considered real economy; financial sector could not gain adequate attention (Jansen et al., 2008; Nasir and Soliman, 2014). As we have acknowledged in previous paragraphs that the impact of monetary policy is contingent on institutional design. It implies that there is a prospect that the aspect of policy coordination and combination of macroeconomic policies may also be influenced by changes in the institutional design and hence their im-plications for the financial sector. However, in existing body of literature on the subject, we could not evident a study which has analysed impact of these factors on macroeconomic policy interaction, neither for financial sector. It would help to understand the implication for optimal policy mix in the light of institutional changes.
2. DEBATE ON INSTITUTIONAL DESIGN
The importance of institutional design and arrangement in the light of various studies has also been briefly acknowledged in the previous section, however we would revisit and debate a few more evidences to establish its relevance with sub-ject study. The addition of institutional arrangement aspects is motivated by the arguments by Srinivasan et al. (2009) that the institutions must be designed so that the central bank’s commitment to its objectives is not in doubt. In this con-text, the financial stability has not been a prime objective of any central bank, at least not explicitly, to best of our knowledge, however if institutional design
4 Since October 2003, CPI (Consumer Price Index) also named as HICP (Harmonised Index of
affects the outcome of macroeconomic policy, it raises question about its implica-tions for financial sector.
One of the major institutional arrangements made during the time of study was independence of the BoE. This may sound a simple case of giving autonomy to monetary authority to achieve its prime objective for price stability; perhaps it was the explicit good intention. Nevertheless, it was rather more complex and vital change in functioning of the BoE. Specifically, subject decision resulted in a big shift in institutional design and certain responsibilities related with financial stability e.g. banking sector supervision and management of sovereign debt were transferred to FSA and DMO (i.e. the supervision of banking sector was ferred to FSA and the responsibility of Sovereign debt stabilization was trans-ferred to DMO). These are the major shifts in responsibilities and authorities with an intention to increase the efficiency of policy formulation; however these changes may have important implication for financial sector. Perhaps the recent or post financial crises development and revival of the BoE role in financial sta-bility is something that requires plentiful attention. The Financial Services Act (2012) lead to major reform in the form of formulation of FPC. The prime objec-tive of the Committee is to identify, monitor and take action to reduce systemic risk for the protection and resilience of the British financial sector, in addition, the Prudential Regulation Authority (PRA), as a part of the BoE, also started functioning from April 2013 with the objection of banking sector supervision. Specific to effectiveness of macroeconomic policies and financial stability these institutional changes raised a question whether the withdrawal of earlier cited responsibilities of financial supervision from the BoE influenced macroeconomic policy role.
associate the study by Dixit and Lambertini (2001) as they argued that in the case of disagreement the outcome can be influenced by institution design.
Despite the fact that we could not evidence many studies on policy coordination in the light of institutional design, yet there is some remarkable work done by Arby and Hanif (2010) in context of Pakistani experience. They found that the monetary policy stance has shown a poor coordination with fiscal policy in Pa-kistan and the institutional arrangements to increase coordination i.e. establish-ment of Monetary and Fiscal Policies Coordination Board could not contribute towards coordination. This finding would be interesting in the context of UK as the Monetary Policy Committee (MPC) of the BoE which is responsible for the formulation of monetary policy has a representative of fiscal authority (HM Treasury) in its meetings, our empirical findings in this study would give us fur-ther insight if this arrangement has been successful for policy coordination.
In addition to the independence of the BoE a major change in institutional frame-work of the BoE was an explicit target of price stability by keeping inflation to 2% of CPI or Target 2.0. In this aspect, Haldane and Read (2000) investigated the role of monetary policy under the influence of inflation targeting and its effects on bond market (yield curve) and found that introduction of inflation targeting in the UK has significantly decreased the effects of monetary policy surprises on yield curve. They associated it with the increased transparency of monetary policy due to inflation targeting. Yet, we are seeing this shift in association with addition of interaction with fiscal policy stock market.
By analysing institutional changes Osborn and Sensier (2009) found that there was a strong evidence that structural break coincides with the introduction of inflation targeting. They declared that the inflation targeting is a more impor-tant change than the independence of BoE. Similarly, Lildholdt and Wetherilt (2004) concluded that the ability of market participants to predict monetary policy stance by the BoE has been improved. Later, analysing economic and structural changes in the UK economy (output, inflation, Forex) under different monetary regimes Baumeister and Mumtaz (2010) found that there had been a shift in response of monetary policy from economic growth and exchange rates fluctuation to inflation. They also acknowledged that economic fluctuation was less frequent after 1992 until recent past, though they did not associated it with any institutional aspect. The subject study would see their assertions in the light of comprehensive and alternative empirical frameworks and its implications in financial sector.
Considering the impact of institutional design on the association among under-lying variable, we refer to Chow (1960) who argued that the association between variables in two different subperiods should be the same if the relationship has not been changed during an event. Putting it simple and being specific to our case, a shift in the relationship between monetary and fiscal policy and financial sector post structural changes in the institutional design would attribute to such a change.
3. EMPIRICAL FRAMEWORK
We would analyse the association between under consideration aspects of finan-cial sector and macroeconomic policy interaction by using a Vector Autoregres-sive model to accomplish our research objectives. The statistical inference would lead to creation and testing of hypothesis and acquirement of empirical findings. It is worthwhile mentioning here that the VAR model would be estimated us-ing Frequentist or traditional econometric approach i.e. Ordinary Least Square (OLS) method.
Re-quirements (PSBR) as a percentage of GDP. It represents the fiscal deficit and is used as the monthly proxy for fiscal policy representing the fiscal stance. The monthly averages of real Yield on UK Government bonds (Gilts) are used as a proxy for bond market’s response. The stock market is proxied by monthly aver-age prices of FTSE-100 index. Stock market data is dividend adjusted so it in-corporates the earning effects. All data are collected from the Office of National Statistics, FTSE Group and BoE database. A Vector Auto Regression framework is used for the analysis of structural breaks and their implication. The model is presented as below:
lnBondt = α + βi lnBondt-i + βiFiscalt-i + βi lnMonetaryt-i + βi lnStockt-i + εt (1)
lnStockt = α+ βi lnStockt-i + βiFiscalt-i + βi lnMonetaryt-i + βi lnBondt-i + εt (2)
εt ˜ N(0, σ2)
[Note: Optimal lag selection is on the basis of lag selection criteria, preliminary lags (t-i) in above model are for presentation.]
Chow test is used to find out if there is a structural break coinciding with the breakdown of the ERM or the independence of BoE. According to Chow (1960), if we split the sample into before and after period of focus, according to the Null hypothesis the coefficient of regression analysis in both sub periods should be equal to coefficients of total period. For instance, if we split Equation (1) into
lnBond1t = α1 + βi lnBond1t-i + βiFiscal1t-i + βi lnMonetary1t-i + βi lnStock1t-i + εt & lnBond2t = α2 + βi lnBond2t-i + βiFiscal2t-i + βi lnMonetary2t-i + βi lnStock2t-i + εt
In the absence of a structural break, α1 = α2, βi lnBond1t-i= βi lnBond2t-i , βiFiscal1t-i=
βiFiscal2t-i , βi lnMonetary1t-i = βi lnMonetary2t-i and βi lnStock1t-i = βi lnStock2t-i .
of Vector Auto-regression model. The basic feature of VEC model is that it
in-cludes an error correction term (Ut-1) which is a one-period lagged residual term
and guides or restores the system to equilibrium. The Johansen Co-integration method then is used.
The estimation results often show that various values of lagged explanatory vari-ables have different sign and size of impact on response varivari-ables. Therefore, we will perform the Wald test to see the joint impact of response variable in the com-ing section. We will also see it further in the Diagnostic test which includes Het-eroskedasticity, Autocorrelation and Exogeneity tests. Nevertheless, to get some further insight and to view a big picture of association among variables we will perform an Impulse Response Function (IRF) Analysis.
4. FINDINGS AND ANALYSES
We started with the analysis of the implications of institutional design and ar-rangements for macroeconomic policy interaction in the financial sector in the UK. The first major episode was the membership and departure from ERM which was a fixed exchange rate system (with margin of fluctuations) of its European member countries.
4.1 Exchange Rate Mechanism (ERM) & Inflation Targeting
The first major episode was the membership and departure from ERM which was a fixed exchange rate system (with margin of fluctuations) of its European members. The decision to join was not very constructive for the UK economy and financial sector and led to enormous pressure on its currency and ended up in the departure after massive foreign exchange fluctuation in one day called “Black Wednesday”. However, due to limited scope of this study we would nei-ther go into the history of the ERM, nor its impact on the financial sector, ranei-ther we would see whether the dynamics of relationship among our under analysis variables i.e. macroeconomic policy interaction in the financial sector has been changed due to ERM experience.
set by HM Treasury. In the context of monetary policy framework it was a major change as an explicit target (inflation) and tool (interests) were set up.
At this stage we have limited the time horizon of study from January 1985 to April 1997 (N = 148) just before the occurrence of second episode of major insti-tutional changes (independence of BoE) in macroeconomic policy framework of the UK. All the data series were transformed by taking natural log expect fiscal policy (deficit/GDP) as it is a ratio which does not require transformation. In ad-dition, it has negative values which cannot be logged. The notion of transforma-tion is supported by Nevill and Holder (1995) with the reason that it overcomes the issue of Non-normality and Heteroskedasticity and could lead to obtaining
best estimates from the model. We moved straight to our most important Chow
test to find out if there is a structural break coincides with the breakdown of the
[image:11.482.56.411.291.421.2]ERM. The results are presented as below:
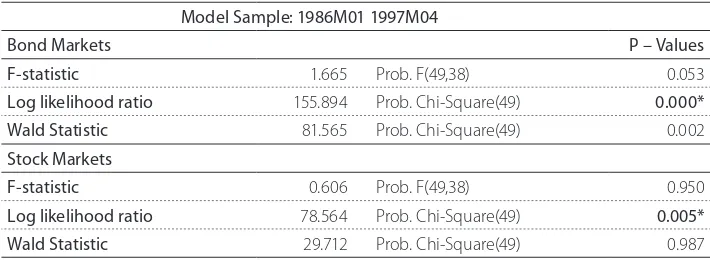
Table 1: Chow Break Point Test-1992M09
Model Sample: 1986M01 1997M04
Bond Markets P – Values
F-statistic 1.665 Prob. F(49,38) 0.053
Log likelihood ratio 155.894 Prob. Chi-Square(49) 0.000*
Wald Statistic 81.565 Prob. Chi-Square(49) 0.002
Stock Markets
F-statistic 0.606 Prob. F(49,38) 0.950
Log likelihood ratio 78.564 Prob. Chi-Square(49) 0.005*
Wald Statistic 29.712 Prob. Chi-Square(49) 0.987
*1% level of Significance.
As we can witness in Table 1, the null of No structural break was rejected at the highest level of significance (1%). It implied that the association between macro-economic policy interaction and financial sector has been significantly changed after this structural break. To further investigate the impact of these institutional changes for macroeconomic policy interaction, we followed the method pre-scribed by Politis et al. (1999) and Wong et al. (2006) and divided the analysis into pre and post ERM periods. The rationale of doing so is that it will enable us to make a comparison between the pre and post ERM scenarios and its implica-tions for macroeconomic policy interaction.
gave us sufficient evidence of stationarity in the data5, however, we also
acknowl-edged a structural break in earlier mentioned Chow test which may pose a ques-tion on the robustness of our findings in the ADF test. On this aspect, Perron (1989) cautioned that ADF test could give biased results. On theoretical grounds, a very important point we must elaborate here is that financial assets for example stock or bond prices data series exhibit a structural change from their usual trend due to various reasons for instance macroeconomic policy decisions or financial and economic events. Making this point as a base, some studies like Rangana-than and Ananthakumar (2010) criticised that ADF test is biased towards null of random walk in presence of such a structural break in a series. The reason was given that in case of not accounting for structural break, the random shocks are assumed to have a permanent effect on the system. However, one special feature of this paper is that we are considering the structural breaks; hence it would help us test whether these shocks are just transitory around a stable trend path. To overcome this potential flaw in ADF test and its theoretical and practical im-plications, we used Ng-Perron (2001) test of stationarity which propose the fol-lowing tests: MZa and MZt that are the modified versions of Phillips’ (1987) and Phillips and Perron’s (1988) Za and Zt tests; the MSB that is related to Bhargava’s (1986) R1 test; and finally, the MPT test that is a modified version of Elliot, Roth-enberg and Stock’s (1996) Point Optimal Test. We also used Modified Akaike Information Criteria (MAIC) and GLS de-trended data for lag length selection and construction of unit root test. The results are presented in Table 2:
5 We also performed the Augmented Dickey and Fuller (ADF) test and the results indicated that
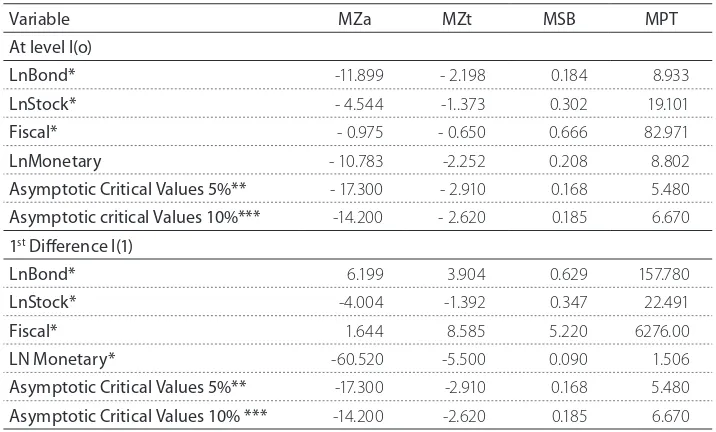
Table 2 : Ng – Perron Modified Unit Root Test
Variable MZa MZt MSB MPT
At level I(o)
LnBond* -11.899 - 2.198 0.184 8.933
LnStock* - 4.544 -1..373 0.302 19.101
Fiscal* - 0.975 - 0.650 0.666 82.971
LnMonetary - 10.783 -2.252 0.208 8.802
Asymptotic Critical Values 5%** - 17.300 - 2.910 0.168 5.480
Asymptotic critical Values 10%*** -14.200 - 2.620 0.185 6.670
1st Difference I(1)
LnBond* 6.199 3.904 0.629 157.780
LnStock* -4.004 -1.392 0.347 22.491
Fiscal* 1.644 8.585 5.220 6276.00
LN Monetary* -60.520 -5.500 0.090 1.506
Asymptotic Critical Values 5%** -17.300 -2.910 0.168 5.480
Asymptotic Critical Values 10% *** -14.200 -2.620 0.185 6.670
* Ng-Perron test statistics of LnBond, LnStock, Fiscal and LnMonetary. ** Critical value at 5% level of significance. *** Critical value at 10% level of significance.
As shown above the results of Ng-Perron (NP) test indicates that in all cases, our test statistics taking the first difference were greater than the benchmark critical values at 5% or at least 10% level, which implied that all the data series were sta-tionary. The null hypothesis of unit root existence was rejected at first differences I (1). It is often the case with economic and financial data and quite satisfactory level of stationarity.
Thereafter, we performed an optimal lag selection test using various criteria6. It
indicated that SC, HQ, FPE criteria indicated one as optimal lag while the AIC and LR indicated 12 as optimal lag order. We followed the advice by AIC test. The rational for this choice is supported by Liew (2004) when they compared several lag selection criteria, they found it most appropriate. However, in par-ticular to our study the alternative suggestion of one lag was not given best es-timates, hence for robustness of our analysis we considered and incorporated 12 lags into our analysis. As the next step we move toward the co-integration analysis to find whether the variables are co-integrated i.e. if they have long-run association among them. In the case that a co-integration or long-run
associa-6 Sequential modified LR test statistic. FPE: Final prediction error. AIC: Akaike information
tion among variables is found, we use a Vector Error Correction Model (VECM) which is a restricted form of Vector Auto-regression model. The basic feature of
VECM model is that it includes an error correction term (Ut-1) which is a
[image:14.482.71.426.311.379.2]one-period lagged residual term and guides or restores the system to equilibrium. The Johansen Co-integration method was used and results of our co-integration test are presented below in Table 3. Our results of Johansen Co-integration test which included the assumption of linear deterministic trend suggested that there was a co-integrating relationship considering 12=lag periods.
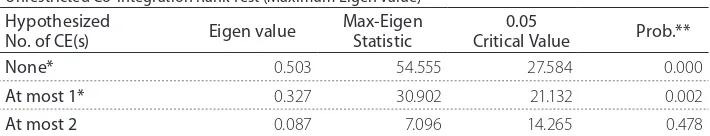
Table 3: Johansen Co-integration Test
Unrestricted Co-integration Rank Test (Trace)
Hypothesized
No. of CE(s) Eigen value StatisticTrace Critical Value0.05 Prob.**
None* 0.503 92.748 47.856 0.000
At most 1* 0.327 38.193 29.797 0.004
At most 2 0.087 7.291 15.495 0.544
Unrestricted Co-integration Rank Test (Maximum Eigen value)
Hypothesized
No. of CE(s) Eigen value Max-EigenStatistic Critical Value0.05 Prob.**
None* 0.503 54.555 27.584 0.000
At most 1* 0.327 30.902 21.132 0.002
At most 2 0.087 7.096 14.265 0.478
* Hypothesis of no co-integration was rejected by Trace & Max Eigen value test. ** MacKinnon-Haug-Michelis (1999) p-values.
Both of our Unrestricted Co-integration Rank tests (Trace & Max Eigen statis-tics) showed that the null of no co-integration was rejected at 5% level on the ba-sis of MacKinnon-Haug-Michelis (1999) p-values, there were two co-integrating equations found. It implied that long-term association exists among variables and there are at least more than two time series which are co-integrated or share the common stochastic drift. Hence we employed a restricted or Vector Error Correction Model by incorporating error corrections terms. The estimation re-sults of the model (Equations 1 & 2) for the Pre and Post-ERM periods by using
Ordinary Least Square (OLS) method are obtained7.It showed that for the model
specified in Equations (1 & 2) there are several values of coefficients ranging from positive to negative and significant to insignificant. The P-values < 0.05 indicated significant impact of explanatory variables at 95% level of confidence and vice versa. Interestingly the Error Correction terms are significant and negative
ues on the whole. It is an indication towards the stability of our model. However, we would perform the Wald test to see the joint impact of response variable in next section; it will also be further elaborated in the Diagnostic test. Hence, to test the validity of results and to check the robustness of our model against is-sues of Heteroskedasticity, Autocorrelation and Exogenity, a test diagnostic is performed, as presented in Table 4.
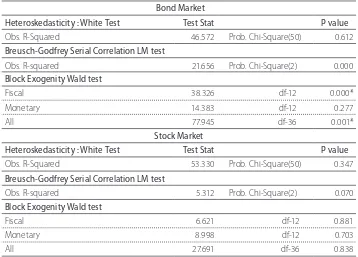
Table 4: Diagnostic Test (Heteroskedasticity, Autocorrelation & Exogeneity)
Exchange Rate Mechanism (ERM) Jan 1985 - July 1992 Bond Market
Heteroskedasticity : White Test Test Stat P value
Obs. R-Squared 46.572 Prob. Chi-Square(50) 0.612
Breusch-Godfrey Serial Correlation LM test
Obs. R-squared 21.656 Prob. Chi-Square(2) 0.000
Block Exogenity Wald test
Fiscal 38.326 df-12 0.000*
Monetary 14.383 df-12 0.277
All 77.945 df-36 0.001*
Stock Market
Heteroskedasticity : White Test Test Stat P value
Obs. R-Squared 53.330 Prob. Chi-Square(50) 0.347
Breusch-Godfrey Serial Correlation LM test
Obs. R-squared 5.312 Prob. Chi-Square(2) 0.070
Block Exogenity Wald test
Fiscal 6.621 df-12 0.881
Monetary 8.998 df-12 0.703
All 27.691 df-36 0.838
*Significant at 1% level, ** Significant at 5% level
exogenous impact on bond market while monetary policy could not reflect the same degree of association; however, for macroeconomic policy combination the results were significant. Interestingly, for stock market neither individual nor combination of macroeconomic policies showed much significant exogenous as-sociation. We would look into this factor in details in the Wald coefficient restric-tion test in the coming secrestric-tion. A diagnostic test for the Post-ERM estimarestric-tion of the VAR model was also performed and results are presented in Table 5.
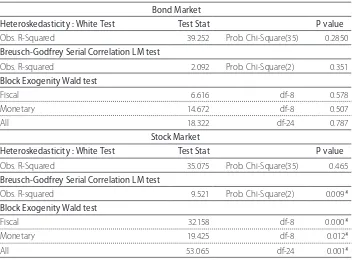
Table 5: Diagnostic Test (Heteroskedasticity, Autocorrelation & Exogeneity)
Post Exchange Rate Mechanism (ERM) October 1992 - April 1997
Bond Market
Heteroskedasticity : White Test Test Stat P value
Obs. R-Squared 39.252 Prob. Chi-Square(35) 0.2850
Breusch-Godfrey Serial Correlation LM test
Obs. R-squared 2.092 Prob. Chi-Square(2) 0.351
Block Exogenity Wald test
Fiscal 6.616 df-8 0.578
Monetary 14.672 df-8 0.507
All 18.322 df-24 0.787
Stock Market
Heteroskedasticity : White Test Test Stat P value
Obs. R-Squared 35.075 Prob. Chi-Square(35) 0.465
Breusch-Godfrey Serial Correlation LM test
Obs. R-squared 9.521 Prob. Chi-Square(2) 0.009*
Block Exogenity Wald test
Fiscal 32.158 df-8 0.000*
Monetary 19.425 df-8 0.012*
All 53.065 df-24 0.001*
*Significant at 1% level, ** Significant at 5% level
Homo-skedasticity (White test) could not be rejected yet we could not accept the null of No serial correlation. It is quite initiative and could be expected where stock return market behaviour is influenced by previous period scenario and most im-portantly we can still obtain unbiased and consistent estimates though not much efficient. Interestingly each macroeconomic policy as well as their combination showed highly significant exogenous impact on stock market.
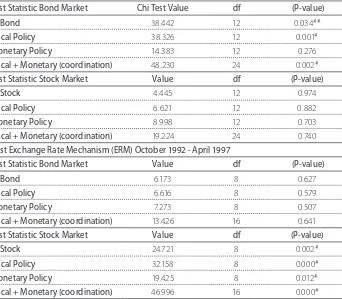
[image:17.482.69.411.255.554.2]A Wald coefficient restriction test was performed to check the significance of various parameters of policy variables individually as well as jointly. The results of comparative analysis are presented in Table 6:
Table 6: Wald Test Vector Auto regression Model Jan 1985 – April 1997
Exchange Rate Mechanism (ERM) Jan 1985 - July 1992
Test Statistic Bond Market Chi Test Value df (P-value)
LnBond 38.442 12 0.034**
Fiscal Policy 38.326 12 0.001*
Monetary Policy 14.383 12 0.276
Fiscal + Monetary (coordination) 48.230 24 0.002*
Test Statistic Stock Market Value df (P-value)
LnStock 4.445 12 0.974
Fiscal Policy 6.621 12 0.882
Monetary Policy 8.998 12 0.703
Fiscal + Monetary (coordination) 19.224 24 0.740
Post Exchange Rate Mechanism (ERM) October 1992 - April 1997
Test Statistic Bond Market Value df (P-value)
LnBond 6.173 8 0.627
Fiscal Policy 6.616 8 0.579
Monetary Policy 7.273 8 0.507
Fiscal + Monetary (coordination) 13.426 16 0.641
Test Statistic Stock Market Value df (P-value)
LnStock 24.721 8 0.002*
Fiscal Policy 32.158 8 0.000*
Monetary Policy 19.425 8 0.012*
Fiscal + Monetary (coordination) 46.996 16 0.000*
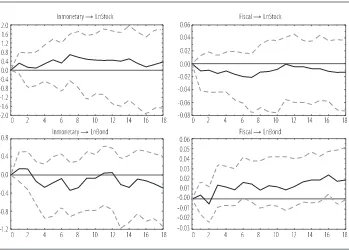
Figure 1: VECM Impulse Response Function (IRF): Period Jan 1985 - July 1992
Source: Author’s Calculations using JMulti-4.
Figure 2: VECM Impulse Response Function (IRF): Period Jan 1985 - July 1992
Source: Author’s Calculations using JMulti-4.*Response to Cholesky One S.D. Innovations ± 2 S.E
Period October 1992 - April 1997
Figure 3: VECM Impulse Response Function (IRF): Period October 1992 - April 1997
Source: Author’s Calculations using JMulti-4.*Response to Cholesky One S.D. Innovations ± 2 S.E.
and importance of macroeconomic policies coordination increases in the time of financial instability.
On the aspect of initiation of inflation targeting (2.5% RPI) in October 1992, we have also provided the empirical support to assertion by Libich et al. (2011) which suggested that the monetary policy should be made more explicit (inflation tar-geting) and show commitment towards price stability. Their argument was that this mechanism would work as a partial substitute of monetary independence and coordination from the fiscal authority. Although their arguments were on price stability and requires empirical validations, yet our empirical analysis here shows that these are quite valid in the case of financial sector. It could be wit-nessed that in the Post ERM period when the explicit inflation target was started that resulted in an increase in the influence of monetary policy (Table 6), though the Bank of England was not independent till May 1997.
The inter-relationship between monetary and fiscal policies also increased in the period before withdrawal from ERM. It implies that the policies also affect each other more in the time of financial volatility; we must acknowledge the study by Franta et al. (2011) who argued that legislative and explicit inflation target could help monetary policy to control excessive fiscal spending and also lead to fiscal discipline. Contextualizing it in our findings, we could suggest that the inflation targeting may increase the association between policies hence their coordination becomes rather vital and more desirable for any positive role in financial markets.
4.2 Independence of the Bank of England & Formulation of MPC
After analysing the impact of the ERM and the start of inflation targeting we moved towards our second major institutional change i.e. independence of the
Bank of England. On 6th May 1997 the BoE was delegated the authority to set up
the interest rates, the Act was however approved and signed by the HM Queen
in April 1998 to be enforced form the 1st of June 1998. As cited earlier with the
independence of instrument (interest rates) setting, certain responsibilities for instance supervision of banking sector were also transferred to FSA. To find the impact of these institutional changes and whether they lead to structural break we performed Chow test by considering sample period from October 1993 to
Au-gust 20088. The null hypothesis of no structural break has been rejected against
alternative of structural break at 95% confidence benchmark in the case of bond
8 To conserve the space the results of structural break, lag selection and co-integration tests are
and at 99% benchmark, as in the case of stock markets. It implied that the asso-ciation between our response and explanatory variables has been changed along with independence of the BoE, formulation of its Monetary Policy Committee and transfer of responsibilities to the FSA (Banking Sector Supervision) and the DMO (Sovereign Debt Management).
second equation – Equation (2) for the same period. The model estimated showed some values below 5% significance level (p >0.05). However, considering the fact that we have a system of equation where variables are treated endogenously, it is vital to see the model on the whole. The dummy variable CRASH showed a posi-tive, although not highly significant value of coefficient, which implied that the period of Dot Com bubble would have negative impact on the stock market as the period other than that for which we gave value of 1 to our binary dummy variable CRASH showed a positive sign. As mentioned earlier to decrease the number of insignificant lags we performed the Lag exclusion test. The results of the Wald Lag exclusion test showed that none of the lag was insignificant below the 5% level, hence we cannot drop and lag on the basis of its insignificance. Therefore, we accept the same numbers of lags suggested by lag selection test. Perhaps it is intuitive as it yields better estimates by following lag selection criteria. Hereafter, a diagnostic test is performed to check the robustness and validity of estimates and the results are presented in Table 7:
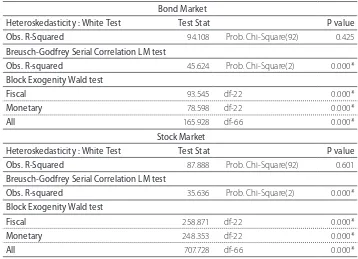
Table 7: Diagnostic Test (Heteroskedasticity, Autocorrelation & Exogeneity)
Post Formulation of MPC & Independence of BoE Sep 1998 – Aug 2008 Bond Market
Heteroskedasticity : White Test Test Stat P value
Obs. R-Squared 94.108 Prob. Chi-Square(92) 0.425
Breusch-Godfrey Serial Correlation LM test
Obs. R-squared 45.624 Prob. Chi-Square(2) 0.000*
Block Exogenity Wald test
Fiscal 93.545 df-22 0.000*
Monetary 78.598 df-22 0.000*
All 165.928 df-66 0.000*
Stock Market
Heteroskedasticity : White Test Test Stat P value
Obs. R-Squared 87.888 Prob. Chi-Square(92) 0.601
Breusch-Godfrey Serial Correlation LM test
Obs. R-squared 35.636 Prob. Chi-Square(2) 0.000*
Block Exogenity Wald test
Fiscal 258.871 df-22 0.000*
Monetary 248.353 df-22 0.000*
All 707.728 df-66 0.000*
The results of diagnostic test for the Post MPC formulation and the independence of the BoE period showed that for bond market the null hypothesis of No Serial Co-relation (Breusch Godfrey test) could not be accepted at the benchmarked level of statistical significance (5%). However, the null hypothesis of Homoske-dasticity (White test) could not be rejected at benchmarked level of significance. Therefore, we do not have the issue of Heteroskedasticity in our model so we can rely on our results to be unbiased and consistent. Nevertheless, the Exogeneity test showed very interesting findings. With comparison to the pre-independence of the BoE scenarios in Table 6 the significance of exogenous impact of fiscal pol-icy for bond market and monetary polpol-icy for stock market increased enormously. It implied that the independence of the BoE which included the changes in its structure and responsibilities increased the effectiveness of monetary authority on sovereign debt market and equity market. We would further discuss this phe-nomenon in the Wald test in the next section. Nevertheless, in the context of macroeconomic policy combination, between monetary and fiscal policies the former showed a greater exogenous impact on stock while later showed a greater exogenous impact on bond market. However, both policies showed significant exogenous impact, whereas in the case of macroeconomic policy combination, it showed a rather greater exogenous impact than on both stock and bond markets. It implied that the solo effort of a single policy may influence one market more; however the combination of two could bring fruitful results for both markets.
[image:25.482.57.413.437.581.2]Thereafter we performed a Wald coefficient restriction test to evaluate the indi-vidual and joint impact of macroeconomic policies on financial sector; the results are reported in Table 8.
Table 8: Wald Test Vector Auto regression Model Sep 1998 – Aug 2008
Test Statistic Value df (P-value)
LnBond 70.384 22 0.000*
Fiscal Policy 93.545 22 0.000*
Monetary Policy 78.598 22 0.000*
Fiscal + Monetary (coordination) 139.436 44 0.000*
Test Statistic Value df (P-value)
LnStock 234.606 22 0.000*
Fiscal Policy 258.871 22 0.000*
Monetary Policy 248.353 22 0.000*
Fiscal + Monetary (coordination) 476.296 44 0.000*
As we can see in the post Bank of England’s independence there is a significant shift in association between macroeconomic policies and financial sector. While making a comparison between the Pre-MPC and the BoE independence period as presented in Table 7 with the Post BoE independence and formulation of the MPC period depicted in Table 8 it is evident that the individual impact of mon-etary policy as well as fiscal policy increased to a large degree in its significance. The reason could be the transfer of sovereign debt supervision to Debt Manage-ment Office for the bond market. Moreover the impact of fiscal policy and mac-roeconomic policy combination on the bond market has been rather more sig-nificant and greater during the latter period. It implies that the independence of the Bank of England and the formulation of MPC have increased the influence of policy interaction on the bond market although monetary policy at its own did have significant impact. This finding further validated the importance of macro-economic policy coordination.
Furthermore, the stock market also showed a shift in its response to macroeco-nomic policy shocks. The impact of monetary policy remained highly significant. Moreover the fiscal policy also showed a significant long-run association with stock market. Concomitantly, this change towards rather more significant impact on stock market could be associated with the increase in effectiveness of macro-economic policies after these institutional changes. It implies that although the market participants may anticipate fiscal and monetary authorities’ actions in the light of rationale expectations and market efficiency arguments, macroeconomic policies still have impact on financial market. Being very specific to this scenario as with the independence of the Bank of England instrument (interest setting) setting from fiscal authority (HM Treasury) control, the fiscal policy remained significant for stock market. It is very much in line with intuition and institu-tional change. However, the joint impact of macroeconomic policy was also sig-nificant which authenticated the notion of policy coordination. In summary, on the basis of these findings we can argue that the independence of the BoE and the formulation of MPC have important and positive implications for influence of macroeconomic policies on financial sector. It also led to the increased necessity of macroeconomic policy combination, particularly for its capacity to influence bond market and stock markets, though the monetary and fiscal policies also af-fect bond and stock markets respectively.
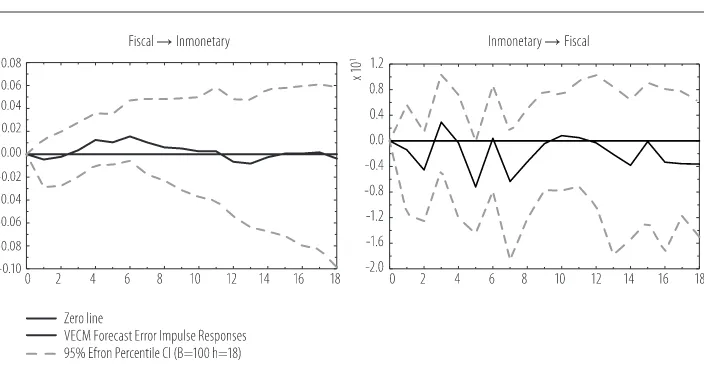
hun-dred bootstrap replications were carried out (B = 100). The results are presented in Figure 4.
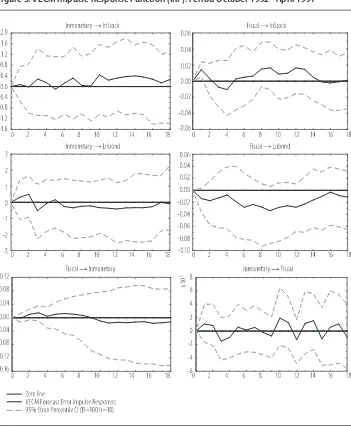
Figure 4: VECM Impulse Response Function (IRF): Period Sep 1998 – Aug 2008
As we can see in Figure 4, the bond yield showed a positive response to expan-sionary fiscal shocks implying a plunge in bond prices after fiscal expansion, however monetary contraction leads to a fall in real bond yield and a surge in the real price of bond which is not counter intuitive. As we are using the real yield on bonds a contractionary monetary policy effects show an increase in bond prices in real terms rather than nominal. It could be associated with the decrease in inflation due to the contractionary monetary stance. However, we will not go into details as it is beyond the scope of this study. Interestingly the interaction between policies showed that alternative shocks to monetary and fiscal policy did cause some volatility to each other implying interdependence even after the BoE independence. It is indeed a vital finding considering the fact that the MPC has representation of HM treasure on its board, although in non-voting observer sta-tus. The stock market did show a persistent response to fiscal expansion whereas a positive (contractionary) monetary policy shock led to surge in stock prices af-ter initial drop, implying that the monetary policy had short run impact on stock market in this period.
In the context of optimal policy combination, the contractionary monetary policy showed a negative impact on the stock market whereas the bond market showed positive response. The contractionary fiscal policy also led to negative response from stock as well as bond markets. The fiscal contractions led to mon-etary expansions and vice versa. Therefore, an appropriate policy combination in the light of these findings would be an expansionary fiscal stance while monetary policy could be passive considering the fact that it has heterogeneous response from the stock and bond markets, unless we are targeting a particular market in the short-run. It leads us to conclude.
5. CONCLUSIONS AND POLICY IMPLICATIONS
to withdraw from ERM is appreciable in this context. The most important lesson to learn from it was that joining currency union in any form could reduce the capability of local policy makers to influence domestic financial sector. Moreover, the markets also showed instability in the form of massive fluctuations. With the benefit of hindsight we can see that this is the case in the European Monetary Union. However, the subject study has brought this aspect into the limelight in the context of British macroeconomic policy framework and the financial sector.
REFERENCES
1. Airaudo, M.Nistico, S. Zanna, L.F. (2015).Learning Monetary Policy and Asset Prices, Journal of Money, Credit and Banking, Volume 47 (7) Pages 1273–1307.
2. Altissimo, F., Georgiou, E. Sastre, M. Valderrama, M.T. Stocker, G.S.M. Weth, M. Whelan, K. William, A. (2005). Wealth and Assets Price Effects on Economic Activity, Occasional Paper Series No 29 / June 2005
3. Arby, M.F and Hanif, M.N. (2010). Monetary and Fiscal Policies
Coordination: Pakistan’s Experience, SBP Research Bulletin Volume 6, No. 1, May
4. Ardagna, S., (2009). Financial markets behaviour around episodes of large changes in the fiscal stance, European Economic Review 53, pp. 37–55. 5. Arnold, I.J.M., Vrugt, E.B. (2010). Treasury Bond Volatility and Uncertainty
about Monetary Policy, the Financial Review, 45, 707–728
6. Basistha, A. Kurov, A. (2008). Macroeconomic cycles and the stock market’s reaction to monetary policy, Journal of Banking & Finance 32 , 2606–2616 7. Baumeister, C. Liu, P., Mumtaz, H. (2010). Changes in the transmission of
monetary policy: evidence from a time-varying factor-augmented VAR, Working Paper No. 401, Bank of England.
8. Benigno, G. Chen, H. Otrok, C. Rebucci, A. Young, E. R. (2013). Financial Crises and Macro-Prudential Policies, Journal of International Economics, Volume 89 (2), Pages 453-470.
9. Bhargava, A. (1986). “On the theory of testing for unit roots in observed time series”, Review of Economics Studies, 53, 369-384.
10. Bhundia, A. & O, Donnell, G. (2002). UK Policy Coordination: The
Importance of Institutional Design, Fiscal Studies, vol. 23, no. 1, pp. 135–164 11. Blanchard, O. Dell’Ariccia, G. Mauro, P. (2010). Rethinking Macroeconomic
Policy, IMF staff Position Note, SPN/10/03
12. Bredin, D., Hyde, S., Reilly, G. O. (2005). UK Stock Returns & the Impact of Domestic Monetary Policy Shocks, Department of Banking & Finance, Graduate School of Business, University College Dublin
13. Cameron, S. (2005). Econometrics, Maidenhead, England: McGraw-Hill Education.
14. Chen, M.H. (2012). State dependence in the influence of monetary policy regime shifts on hospitality index returns, International Journal of Hospitality Management 31, 1203– 1212
16. Dixit, A., Lambertini, L. (2001).Monetary- fiscal policy interactions and commitment versus discretion in a monetary union, European Economic Review 45, pp. 977-987.
17. Elliot, G., Rothenberg, T. J. Stock, J. H. (1996).”Efficient tests for an autoregressive unit root”, Econometrica, 64, 813-836.
18. Franta, M. Libich, J. Stehlik, P. (2011). The Big Picture of Monetary–Fiscal Interactions, Economic papers, Vol. 30, No. 1, March, 6–14
19. Funke, M. Paetz, M., Pytlarczyk, E. (2011). Stock market wealth effects in an estimated DSGE model for Hong Kong, Economic Modelling, Volume 28, (1–2), Pages 316-334.
20. Haldane, A. Read, V. (2000). Monetary policy surprises and the yield curve, Bank of England, ISSN 1368-5562
21. Hill, C. W. L. (2014). International Business: Competing in the Global Marketplace, 10th Edition, McGraw-Hill Education, Berkshire. 22. Jansen, D. W, Li, Q. Wang, Z., Yang, J., (2008). Fiscal policy and asset
markets: A semi-parametric analysis, Journal of Econometrics 147, pp.141 -150
23. Khorasgani, H.S. (2010). Financial Instability and Optimal Monetary Policy Rule, FIW Working Paper No 42
24. Kontonikas, A. Montagnoli, A. (2006). Optimal monetary policy and asset price misalignments, Scottish Journal of Political Economy, Vol. 53, No. 5, November
25. Kurov, A. (2010). Investor sentiment and the stock market’s reaction to monetary policy, Journal of Banking & Finance, 34, 139–149
26. Lildholdt, P. Wetherilt, A.V. (2004). Anticipation of monetary policy in UK financial markets, Bank of England
27. Liew, Venus Khim−Sen. (2004). “Which Lag Length Selection Criteria Should We Employ?.” Economics Bulletin, 3, pp.1−9
28. Lobo, B.J . (2000). Asymmetric Effects of Interest Rate Changes on Stock Prices, the Financial Review 35, 125-144
29. Lobo, B. J, Darrat, A.F and Ramchander, S. (2006). The Asymmetric Impact of Monetary Policy on Currency Markets, the Financial Review 41, 289–303 30. Lu, X & In, F. (2006). Monetary Policy, Open Market Operations and New
Zealand Interest-Rate and Exchange-Rate Markets, Journal of the Asia Pacific Economy ,Vol. 11, No. 4, 462–481
31. MacKinnon, James G., Alfred A. Haug, and Leo Michelis. (1999). “Numerical Distribution Functions of Likelihood Ratio Tests for Cointegration.” Journal of Applied Econometrics, 14, 563-577.
33. Mariscal, I.B. F. Howells, P. (2007). Monetary Policy Transparency in the UK: The Impact of Independence and Inflation Targeting, International Review of Applied Economics, Vol. 21, No. 5, 603–617.
34. Nasir, M.A. Soliman, A. M. (2014). Aspect of Policy Combination & Effects on Financial Markets” Economic Issues , 19, 92 – 118.
35. Nevill, A, M. Holder, R, L. (1995). Scaling, normalizing and per ratio standards: Scaling an Allometric modelling approach, The American Physiological Society. Available at: http://wlv.openrepository.com/wlv/ bitstream/2436/66082/1/JAP%20Scaling,%20Normalizing.pdf [Accessed at: 23 September 2014]
36. Ng, S. and P. Perron. (2001). Lag length selection and the construction of unit root tests with good size and power. Econometrica, 69, 1519-1554. 37. Osborn, D.R. Sensier, M . (2009). UK Inflation: Persistence, Seasonality
and Monetary Policy, Scottish Journal of Political Economy, Vol. 56, No. 1, February
38. Park, S, G. (2008). Monetary, Fiscal, and the Exchange rate Policy
Interactions with Central Bank Debt, Department of Economics, University of Indiana.
39. Perron, P. (1989). The great crash, the oil price shock and the unit root hypothesis, Econometrica, 57, 1361-1401.
40. Phillips, P. C. B. (1987). ”Time series regression with a unit root”, Econometrica, 55, 311-340.
41. Phillips, P.C. B. Perron, P. (1988).”Testing for a unit root in time series regression”, Biometrica, 75, 335-346.
42. Politis, D.N, Romano, J.P, Wolf, M. (1999). Sub-sampling, Springer Series in Statistics, Springer; edition
43. Porqueras, P.G and Alva, A.P. (2010). Optimal monetary and fiscal policies in a search theoretic model of monetary exchange, European Economic Review, 54, 331–344
44. Ranganathan, T., Ananthakumar, U. (2010). Unit Root Test: Give It A Break, The 30th International Symposium on Forecasting, International Institute of Forecasters
45. Sims, C.A. (2011). Stepping on a rake: The role of fiscal policy in the inflation of the 1970s, European Economic Review, 55, 48–56
46. Srinivasan, N. Jain, S. & Ramachandran, M . (2009). Monetary policy and the behaviour of inflation in India: Is there a need for institutional reform? Journal of Asian Economics 20, 13–24
48. Wong , W. K. , Khan, H. K. Du , J . (2006). Do the interest rates matter for stock prices? And economic study of Singapore & U.S.A, The Singapore Economic Review, 51, pp. 31-51