Citation:
Swan, W and Fitton, R and Gorse, C and Farmer, D and Benjaber, M (2017) The staged retrofit of
a solid wall property under controlled conditions. Energy and Buildings, 156. pp. 250-257. ISSN
0378-7788 DOI: https://doi.org/10.1016/j.enbuild.2017.09.033
Link to Leeds Beckett Repository record:
http://eprints.leedsbeckett.ac.uk/4517/
Document Version:
Article
The aim of the Leeds Beckett Repository is to provide open access to our research, as required by
funder policies and permitted by publishers and copyright law.
The Leeds Beckett repository holds a wide range of publications, each of which has been
checked for copyright and the relevant embargo period has been applied by the Research Services
team.
We operate on a standard take-down policy.
If you are the author or publisher of an output
and you would like it removed from the repository, please
contact us
and we will investigate on a
case-by-case basis.
Accepted Manuscript
Title: The Staged Retro
fi
t of a Solid Wall Property Under
Controlled Conditions
Authors: W. Swan, R. Fitton, C. Gorse, D. Farmer, M.
Benjaber
PII:
S0378-7788(17)31109-X
DOI:
https://doi.org/10.1016/j.enbuild.2017.09.033
Reference:
ENB 7952
To appear in:
ENB
Received date:
30-3-2017
Revised date:
13-9-2017
Accepted date:
13-9-2017
Please cite this article as: W.Swan, R.Fitton, C.Gorse, D.Farmer, M.Benjaber, The
Staged Retro
fi
t of a Solid Wall Property Under Controlled Conditions, Energy and
Buildings https://doi.org/10.1016/j.enbuild.2017.09.033
The Staged Retrofit of a Solid Wall Property Under Controlled Conditions
Swan, W.1
Fitton, R.1
Gorse, C.2
Farmer, D.2
Benjaber, M.1
1 Applied Buildings and Energy Research Group
School of Built Environment
University of Salford
Salford, M5 4WT
2 Leeds Sustainability Institute,
Leeds Beckett University,
Broadcasting Place,
Leeds, LS2 9EN
Corresponding Author
Professor Will Swan – [email protected]
Highlights
Staged retrofit of a Victorian solid wall property under controlled conditions in an environmental
chamber
63% saving on heating energy, with an annual saving of £348 per annum, made for a retrofit cost of
£15,860
Major contribution of solid wall insulation, which accounted for 72% of total saving
Abstract
Retrofit of hard to treat properties has been highlighted as a policy challenge to reduced energy consumption in
the UK. This study undertook an experimental staged retrofit of a pre-1919 UK solid wall property under
controlled conditions. The property is housed within an environmental chamber, where the conditions were held
at a constant 5ºC during the test to reflect UK average winter temperature, with all other boundary conditions
removed. The retrofit was undertaken using commercially available products and at each stage a number tests
were conducted to evaluate the performance, with the results for the coheating tests and in situ U values being
reported here. The results show that the deep retrofit undertaken led to a 63% of heat loss from the building,
with the technical feasibility of staged retrofit clearly demonstrated from a heating energy efficiency
perspective. The calculation of cost savings suggests that a whole house deep retrofit may not be financially
feasible if supported only by energy savings. The use of controlled conditions did allow each stage to be
measured and compared in a way that has not been achieved in the field, allowing for effective comparison of
each stage previously only fully explored in models. There are limitations of the methodology driven by the lack
of boundary conditions, specifically around air movement and longer term performance issues, which are best
addressed in the field.
Key Words
Retrofit, energy, U Values, co-heating, whole house, domestic, full-scale test facility
1.0 Introduction
The understanding of the energy efficiency impact of different domestic retrofit measures is an important part of
decision-making when designing and installing a retrofit. Here, we report the results for a staged energy
efficient retrofit of a solid wall property under controlled conditions in the Salford Energy House (SEH) facility.
The SEH is a whole house in a climate-controlled chamber. The purpose of the experiment was to evaluate a
staged retrofit, to understand the impact of individual retrofit measures, and to assess the underlying reasons for
performance, particularly where this may diverge from expected performance. Work within the context of an
environmental chamber gives a consistent test environment, which allowed controlled experiments to be
undertaken on each stage of the retrofit, to provide comparable test conditions at each stage, something that can
A set of commercially available products were used for the upgrade. To undertake the study, the research team,
which included the University of Salford, Saint Gobain, who provided funding for the research, and Leeds
Beckett University, used the Salford Energy House (Ji et al., 2014; Pelsmakers et al., 2017, Pandraud & Fitton,
2014). The SEH is a complete UK Victorian style property, including a “conditioning void” to recreate the
conditions found in a neighbouring property, built within an environmental chamber.
This work does share similarities with the work undertaken by the CALEBRE Project (Loveday and Vadodaria
2013), which also undertook a staged retrofit on a property. However, there are a number of key differences; the
first is the property was not coheated at each individual stage of the retrofit; secondly, the coheating for the
Salford Energy house project was carried out under controlled conditions; and finally the archetype for the
Salford Energy House experiment was a solid wall, rather than a cavity property, meaning different measures
were analysed. It should also be noted that this was the first major experiment conducted within the Salford
Energy House and as such there were a number of methodological issues that were addressed by the team,
however, these are reported elsewhere (Farmer et al 2017).
2.0 Background to Retrofit in the UK
At the time of the research (2013), the UK was engaged in a number of government-funded programmes to
support energy efficiency in the existing stock. Some of the earlier policy initiatives focused on the carbon
emissions of new build properties through the planning system and UK building regulations. The focus of these
actions was very much designed to address issues of climate change mitigation. However, with studies
indicating that some 65-80% of the stock currently standing would still be standing in 2050 (Kelly, 2009;
Ravetz, 2008; Power, 2008) and the UK’s target for an 80% reduction in emissions as stated in the Climate
Change Act 2008, the issue of retrofit was brought to the fore. The UK has greater issues with poorly
performing housing stock in terms of energy efficiency when compared other European countries (Meijer et al.,
2009). The existing stock had not been entirely ignored, as retrofit was funded through programmes such as
Warm Front (Critchley et al., 2007) and the previous version of the supplier obligation, the Energy Efficiency
Commitment (EEC 1 and 2; 2002-2008). The EEC has been viewed as the start of a supplier obligation that
considered climate change mitigation as a policy objective (Rosenow, et al., 2013, Rosenow, 2012). The EEC
was replaced by the Carbon Emissions Reduction Target (CERT) in 2009 (Jenkins, 2010), which was
(CESP), which was a policy focused on low income areas (Reeves et al.,2009). In 2013, these were replaced by
the Energy Company Obligation, which had three main components; one focused on carbon emissions, one on
area-based programmes and one on the fuel poor (Rosenow & Eyre, 2012; Tovar, 2012). These were supported
by a market led policy instrument, known as the Green Deal (Department of Energy & Climate Change, 2010;
Dowson, et al., 2012). The Green Deal was designed to allow people to fund retrofit without the need of paying
the upfront cost, with payment for the capital works being paid through a charge on the electricity meter. The
Green Deal and ECO were roundly criticised for their failure to deliver widespread retrofit (NAO 2016) in
comparison to previous programmes.
A clear understanding of the performance of potential of retrofit interventions is required for these policy tools
to function successfully. The Green Deal, in particular, relied on flows of energy savings to meet the ongoing
payment for capital works, which established a “Golden Rule”, whereby no install would cost more than it
saved over its life. However, the work around performance gap has established that, for a wide variety of
reasons, direct performance relationships between improvements and households can be difficult to establish on
a case by case basis (Johnston et al., 2014). These technical issues contributed to the suspension of a number of
policy initiatives, including the Green Deal and the establishment of a UK Government review, Each Home
Counts (Bonfield, 2016). This report raised a number of recommendations with regards to a better
understanding of performance and quality within the retrofit market, which have direct relevance to this study.
3.0 Evaluating the Performance of Retrofit Improvements
The energy efficiency impact of retrofit on a dwelling-by-dwelling basis is often measured at the whole system,
rather than at the specific improvement, level. This is because that staged retrofit studies are difficult to manage
in occupied properties. Projects monitor the overall performance of homes through long-term monitoring
campaigns, such as the work undertaken in Retrofit for the Future (Gupta et al. 2015) or Jones et al. (2017).
These monitoring campaigns consider the performance of occupied properties, usually using a range of tests,
such as air permeability, thermography or measured in situ U values, combined with measurement of external
and internal environments and measured energy consumption (Fitton 2013). These studies can suffer from
project management issues such as lack of pre-retrofit data, often resolved by modelling (Jones et al. 2017), loss
analysis to understand the impact of different retrofit elements. Chapman, Lowe and Everett’s (1985) Pennyland
Study highlight the issues of statistical significance in drawing strong conclusions from these kinds of studies
when establishing the impact of individual issues on the energy performance of a property.
Work has also been undertaken using high level stock models to assess the impact of retrofit measures. Work by
Jenkins (2010) and Palmer and Cooper (2013) use high level stock data and energy consumption data to identify
the potential impact of policy initiatives. The UK Government National Energy Efficiency Database (BEIS
2017) uses national data from energy suppliers, energy efficiency measure recording and property and occupant
characteristics to analyse the impact of individual measures based on large samples. These approaches are
focused to policy decision making rather than at an individual property level.
At property level, modelling approaches such as those undertaken by Simpson and Banfill, as part of the
CALEBRE Project (Loveday and Vadodaria 2013, Simpson et al., 2016), can provide insight into the impact of
individual retrofit measures and their order. However, with modelling, risks around assumptions of the
performance of building elements can lead to discrepancies, as found in Marshall et al., (2017). Interventions
can be undertaken on unoccupied houses and measured in detail, as seen in Gillott et al. (2016) and Hall et al.
(2013), both of which consider improvements to the E.ON House under the CALEBRE project. This study most
closely reflects the experiment under discussion. However, this property was a cavity archetype and, while the
results show this case can be defined as a deep retrofit, based on modelled Standard Assessment Procedure
(SAP) savings of 72%, different measures were applied and a different methodological approach was taken.
While field-based coheating tests are undertaken to assess the measured HTC of the property, these were not
specifically targeted at understanding the impact of individual measures, but rather comparing the pre and post
retrofit stages, as well as the impact of MVHR performance (White 2013).
The performance gap, the difference between modelled and actual energy performance, is an issue which has
been well established over the recent years in both new build and retrofit (Johnston et al., 2015). Work
establishing the performance gap in new build homes against the statutory models (Gupta & Gregg, 2016;
Roberts et al., 2005) and the performance of individual elements against their modelled performance (Energy
Saving Trust, 2010; Rye & Scott, 2012) leads to a number of possible conclusions as to the source of the
Carbon Hub Report on performance gap and might considered the classic definition of the term. This can be due
to issues such as changes to design, replacement of materials or poor workmanship (ZCH, 2013). Secondly, we
might consider that the assumptions within the model or the model itself are incorrect, such as the assumed U
values not reflecting in situ values (Wetherell & Hawkes, 2011, Marshall et al., 2017). Finally, we could also
identify that the process of measurement or analysis is itself incorrect (Swan et al., 2015). It can be seen that
both measurement and modelling present performance gap challenges in understanding the energy saving
impact of different retrofit measures.
The effective understanding of the performance of sustainable retrofit improvements has been a major challenge
for policy makers in this area. In the UK, the reliance on models to establish payments under Green Deal or the
Energy Company Obligation has meant their accuracy has had implications for homeowners who may make
decisions based on these models and businesses whose products performance is specified. However, as stated
previously, the development of robust experiments in the field can be problematic. The purpose of the Salford
Energy House was to make an attempt to control these variables and allow effective before and after monitoring
of retrofit improvements under identical conditions to provide benchmarks to help understand the level of
improvement made by retrofit technologies.
4.0 Methodology
Testing at a whole building level under controlled conditions is very much in its infancy. Many of the
techniques are the same as those that might be applied in building performance evaluation in the field, but the
nature of the facility creates a number of different types of decisions concerning research design than might be
found in the occupied properties. The series of tests that were applied are not reported in full here, but are shown
in Table 1, to give an overview of the wider study. A more detailed discussion of the methodological challenges
is highlighted in Farmer et al. (2017).
Here, will we focus mainly on the co-heating and u-value results, however, we touch on some of the other data
as it relates to high level findings.
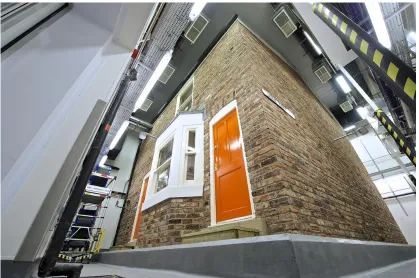
The Salford Energy House (Figure 1) has been constructed to replicate the geometry, materials and thermal
performance of a dwelling constructed in approximately 1910 in the UK. The structure consists of a 63m2 two
storey property, which is next to a conditioning void. This void shares the construction features of the main
house, but is reduced in size at 36m2 with a single room on each floor, as shown in the floor plans (Figure 2).
This conditioning void is used to assess the impact on and by a neighbouring property, as this archetype is not
found in a detached form in the UK. During this experiment the void was held at a constant 20ºC. The
construction of the house structure is shown in Table 2.
4.2 Environmental Chamber
The chamber is constructed around a reinforced concrete cube structure, the walls, floor and ceiling of the
chamber has been insulated and as such is isolated form extraneous thermal losses and gains. The chamber
itself is cooled and heated by an air handling unit that is supplied by 4 condenser units, with a total of 60 kW of
cooling (15 kW per unit) as well as 15kW heat pump facility. This is supplied to the chamber via a ducted
HVAC system. This system reacts to the heat load of the house in the chamber and maintains a set point.
The environmental chamber controls the following variables; temperature, wind, rain and humidity. For the
purposes of this test only temperature was controlled, with all other variables being held constant or not applied.
The temperature can be held at +/- 0.5ºC to target temperature.
4.3 Design of Retrofit Experiment
As stated previously, the retrofit of the property was undertaken using commercially available building
products. The cost of the total retrofit, including labour was estimated as £15,860 using 2013 materials and
labour costs from the suppliers and installers. The baseline of the Salford Energy House was raised from the
basic level used in other studies, such as Fitton et al. (2015), by improving the glazing from single to double and
increasing the loft insulation to 100mm. This was felt to better represent a baseline property that was more
reflective of a current level of houses in the field. Each of the stages are shown in Table 3, with the unimproved
state for each element in italics. The actual profile of the the experiment is the reverse of that which is presented
During the tests the chamber temperature was set to a constant 5°C to reflect the average temperature for the
north west of the UK mainland, where the building was designed to be used. This average temperature, taken
from the winter months December, January and February, is identified in the Standard Assessment Procedure as
4.53 °C (BRE, 2012). A decision was made by the team to round this to 5 °C, as this was more reflective of the
achievable level of control in the chamber. Floor surface and sub-floor void temperatures varied depending on
the retrofit stage, as no direct effort was made to control them, while heat flow from the slab, on which the
house is constructed, was monitored.
It was also decided to remove the impact of dynamic effects for this experiment, so a quasi-steady state was
attained for each test phase. ISO 8990 (BSI, 1996) lays out a procedure for steady state testing stating that air
temperature variation across a specimen surface should to not exceed 2% of the air-to-air ΔT. This is difficult to
achieve outside of a laboratory environment. Therefore, the researchers aimed for a quasi-steady state test
environment. Air temperature fluctuation resulting from the chamber HVAC, coupled with internal space
heating of a thermal envelope with differing rates of heat loss in each zone, means that varying heat flow rates
are expected. However, averaging the heat flow rate over a sufficient period of time to account for the variation,
enables comparisons to be made between successive averaging periods to determine whether the heat flow rate
can be considered constant, approximating to a quasi-steady state. To validate that these were quasi-steady state
measurements, a stabilization period was established. During this period, a controlled ΔT was present and the
power input to the SEH was monitored. The stabilization period ended once the average power input measured
over a 24 hour period differed by less than ± 5% from that measured during the previous 24 hour period. At this
point the heat flow rate was considered to be close to steady-state, so as defined in ISO 13790 “calculating the
heat balance over a sufficiently long time (typically one month or a whole season), which enables one to take
dynamic effects into account”, this becomes a quasi-steady state test.
5.0 Results
Table 4 shows the impact of the retrofit using the results of the co-heating tests (W/K). This indicates a 63%
reduction in heating loss due to the impact of the whole house retrofit (Stage 6 in Table 3). The major metric for
assessing the performance of each retrofit stage was the heat transfer coefficient (HTC). The HTC is defined as
from background ventilation per °C of temperature difference between inside and outside (expressed as W/K)
(Butler and Dengel, 2013). The use of the HTC in establishing a single value for the performance of a building
envelope, allowing for comparison, is particularly useful in this context (Sutton et al., 2012), where we are
comparing against a benchmark baseline property through staged changes. Recent work by Jack et al., (2017),
analyzed data from the initial report from Butler and Dengel to establish the reliability of the approach. The data
from coheating experiments conducted by 6 independent teams on a single dwelling were analyzed, with results
suggesting that the coheating method had a level of uncertainty of ± 8-10%. Control over the temperature
differential and a lack of solar gain suggest the data here is subject to less uncertainty.
When evaluating the stages, it can be seen that a significant proportion of this improvement in the heat loss
coefficient was driven by the solid wall insulation (72%), with the floors and glazing both providing a 11%
saving. Loft insulation provided a 6% saving. Using this performance data, we can establish the potential
energy, carbon and cost savings (Table 3). The impact of solid wall insulation when compared to glazing in the
test house could be considered a function of the proportion of wall surface to other elements.
Using the HTC and assuming a mean annual degree day value of 2297 based on measurements at Manchester
Airport, and using an assumed 82.5% efficient boiler and energy prices based on Government figures of 4.42p
per kWh for 2012 (DECC 2013) we can see the projected impact of the retrofit over a period of time in terms of
annual heating. The property is gas heated and we can see from a base energy consumption of 10340kWh there
is a 63% reduction in heating energy consumption overall. For each element this means a total heating energy
saving of; 45% for solid wall insulation, 7% for glazing, 7% for floors and 3.6% for loft insulation.
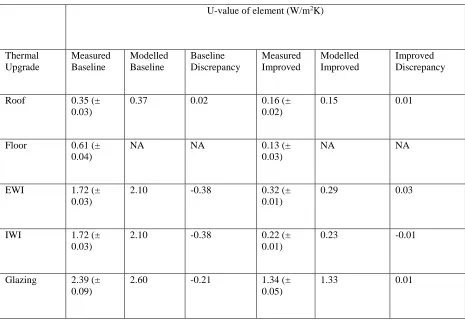
The measurement of U values was undertaken for two reasons. The first was to establish the improvement from
the baseline brought about by the retrofit intervention, the second was to identify the discrepancy between the
measured and modelled data, and any underlying performance gap. The calculation of the modelled U-values
was made using the procedure from BS EN ISO 6946 (British Standards Institution, 2007) which details a
standardised methodology for these calculations with assumptions for the environmental conditions. Material
thermal conductivity properties for the unimproved property are taken from CIBSE Guide A (CIBSE, 2015). All
All measurements were made in accordance with the ISO 9869 standard (ISO, 1994) which is an internationally
recognised standard for the estimation of U-values using in-situ measurements. This standard, generally, only
applies to opaque building features, it was used also on glass in this experiment as the chamber has no external
solar gains or heat input. The results of this are found in Table 4. Floors were not modelled as they were not
directly reflective of what might be found in the field and this may create misleading results.
To summarise Table 5, the measured elements are found to be in close proximity to the values calculated both
before and after retrofit. There is an exception to this in that the baseline solid wall U-value is found to have a
discrepancy of 0.38 W/m2K. The Energy House walls are constructed as solid walls, with no cavities are
present. Recent research on a large sample of properties (n=85) (BRE, 2016) has found that the assumption
made in SAP of a U-value of 2.1W/m2K and a value of 1.7 W/m2K has been suggested to be included in the
next version of SAP. This figure is more closely aligned to the baseline values found during the trials.
While it is not possible to address all of the detail of the study, the main findings for each of the improvements
is outlined, with some additional comments. The solid wall insulation made a major contribution to the overall
performance improvement. However, there was some variance between the expected and modelled performance
of the external wall insulation. This appears to have been driven by two issues. The first is connected to the
fixings. Due to the requirement to return the SEH back to its original state, only mechanical fixings were used
rather than applying the recommended combination of chemical and mechanical fixings to ensure an appropriate
interface. The problems created by not using the recommended method contributed to a small air gap behind the
insulation that led to a reduction in the wall system’s performance. Secondly, the detailing was undertaken
following the manufacturer’s instructions rather than using additional design work. This was done to reflect the
conditions of a site installation as closely as possible. This led to additional thermal bridging, particularly
around reveals. These issues are quantified in detail in Farmer et al. (2017). Additional design work of these
details could have further improved the efficiency. The internal wall insulation performed closely to the design
values. and this is attributed to good contact between the insulation and the wall surface. Loft insulation led to a
3.8% reduction in overall heat loss, higher than that identified in the UK’s National Energy Efficiency Database
(DECC 2013) which indicates a 2% saving. It should be noted, however, that this was a loft top-up, rather than a
full loft insulation installation. Additionally, the U value measurements indicated that the loft fill was
approximate 7% of heat loss reduction. What is marked, is the major contribution the floor system made to air
permeability leading to a 42% reduction from the full retrofit, when compared with the original timber floor in
its unimproved state. This is attributable to the membrane, which may have performed to a higher level if
changes had been applied to the fixing point of the membrane by fixing directly to walls rather than skirting
boards. This decision related to returning the test house back to its original state. An additional consideration
when considering the air infiltration impact of the floor is the lack of air movement in the chamber. As no
specific air movement was applied as part of the experiment, it is felt that the impact of the membrane may have
been slightly higher than may be seen in the field, although the exact impact is difficult to quantify on the basis
of the experiments conducted here. Glazing upgrades performed as expected, with the in situ measures very
close to those modelled (see Table 4).
6.0 Conclusions
The study shows that, from a thermal perspective, the retrofit performed very closely to the expected
performance. This does indicate that, from an energy efficiency perspective, deep retrofit is achievable, a
perspective also supported by the CALEBRE project, which demonstrated a similar order of savings against
modelled values. While there is a controlled element to the construction process, with close observation and
selection of a high quality team potentially strong influencing factors, there was no additional product
specification, design work or construction activity outside that which should be expected in the field. This
potentially suggests that manufacturers and their installers have moved on in terms of delivering design intent
and having this follow through to actual performance. When compared to the data presented in Retrofit for the
Future undertaken between 2009 - 2013, where much higher sums were spent, in many cases up to £100,000,
only 3 properties of the 34, where data was available, achieved the target of 80%. While this target is higher
than the 63% achieved here, does this, perhaps, demonstrate that learning has been improved over the two years
since the delivery of those projects?
The next issue that may be considered is the staging of the retrofit. Whilst Simpson and Banfill (2016)
demonstrate the principle in the context of a model, the realities of a construction project are different. Issues of
install quality are commonly not addressed in modelling exercises, so performance can be presented as an ideal.
However, what the physical staged retrofit does demonstrate is the principle outlined by Simpson and Banfill is
improvement. Each stage was supported by some additional works to ensure that improvements were correctly
installed as it would be if it has been done in isolation, but this does support a model whereby retrofit measures
might be undertaken in different stages. Due to the complexity of the project and the short time frame available
to carry it out, just over 4 months, it was not possible to explore alternative routes through a staged retrofit.
However, the experiment has provided useful data to explore this issue within a calibrated model, which is
initially explored in Marshall et. Al. (2017).
While the experiment conducted here does show the feasibility of deep retrofit in terms of improving thermal
performance, it also demonstrates the long payback times associated with such an approach. Energy efficiency
does not pay for the savings of a deep retrofit in this case. It is clear that, from a policy perspective, that if
retrofit still appeals as a long-term approach to reducing energy consumption, that a wider view view of retrofit
might need to be considered. Benefits, such as flows of income from PV and energy storage, costing of potential
health benefits and uplifts to asset values may all have to be integrated into calculations if deep retrofit is to be
considered viable for these types of properties.
While Farmer et al., (2017) identify many of the detailed methodological issues of working within a controlled
environment, the study was the first to reveal the main advantages and disadvantages of undertaking studies in
the SEH. The uncertainty with field trials is far higher than is found in the chamber, specifically around
coheating and U value testing. This is due to the fact the building can be brought into quasi steady state,
minimising errors associated with measurement. This also means that tests of this type are able to be undertaken
far quicker, for example, reducing the time for coheating tests from 10-14 days to 3 days. The control over the
environment also allows for repeatability of experiments, something that is clearly not possible in the field. This
has meant that further work on retrofit has been undertaken using the same house and conditions as a
benchmark. An example of this can also can be seen in the controls studies undertaken in the house (Fitton et
al., 2016). In terms of the measurement approach, the facility allows for more granularity, in that the capacity to
use the sensor array available, as well as adding additional sensors is far more detailed than possible even in
unoccupied properties.
The experiment is not without its limitations. The lack of real boundary conditions means that moisture and
study, it is clear that that moisture would have a role to play in the performance of the external wall insulation,
while airflow would clearly have impacted the performance of the floor membrane as well as wider air
permeability of the property. This does mean that while rapid evaluation and comparison of thermal upgrades is
greatly enhanced by the facility, longer term hygrothermal issues such as interstitial condensation can only be
addressed in the field. However, the approach can contribute to the development of calibrated models, such as
WUFI or Physibel, which may be used to explore these longer-term issues. Another limitation of the facility
relates to the archetype within the property. The house is a single case; the archetype represents approximately
20% of the UK stock (CLG 2016), but this covers a wide range of sizes, with the SHE representing the smallest
of these properties. While this is useful where benchmarking is concerned, it does create limitations. A further
limitation is the issue of the property having to be returned to its “virgin” state; with all evidence of previous
improvements removed. This issue can be clearly seen with the solid wall installation, where specified adhesive
fixing was not possible and the performance of the insulation was reduced.
There are a number of opportunities to explore retrofit beyond the approach taken in this study, which
predominately focused on the thermal performance of the retrofit upgrades. Issues such as heating loads,
occupant comfort and indoor air quality are all areas that might be explored in further retrofit studies. While it is
clear that the retrofit performed broadly as expected and, in terms of thermal performance, showed deep retrofit
to be possible, the focus should be extended to issues of the occupant experience to better understand the
performance of the retrofit across a wider range of metrics.
References
Air Tightness Testing and Measurement Association. (2010). Technical Standard L1 Measuring Air
Permeability of Building Envelopes (Dwellings). Northampton.
Baker, C., Smith, L. and Swan, W. (2013) "Make no assumptions: The selection of domestic retrofit
improvements." pp 99-112 in Swan, W and Brown, P (2013) Retrofitting the Built Environment Wiley:
Oxford (2013).
Bonfield, P. (2016) Each Homes Counts: An Independent Review of Consumer Advice, Protection, Standards
and Enforcement for Energy Efficiency and Renewable Energy, Department for Business Innovation and
Skills, London
BRE. (2016). Review of default U-values for existing buildings in SAP.
British Standards Institution. (2007). BS EN ISO 6946:2007. London.
Building Research Establishment. (2016) Solid wall heat losses and the potential for energy saving, BRE,
Watford.
Business, Energy and Industrial Strategy (2017) National Energy Efficiency Data Framework: Summary of
analysis using the National Energy Efficiency Data Framework (NEED), London, National Statistics
Butler, D. & Dengel, A., 2013. Review of co-heating test methodologies (NF54), NHBC Foundation, London.
Chapman, J.; Lowe, R. and Everett, R. (1985). The Pennyland Project. Energy Research Group, Open
University, Milton Keynes, UK.
Chartered Institute of Building Services Engineers (2015) CIBSE Guide A: Environmental Design, CIBSE,
Critchley, R., Gilbertson, J., Grimsley, M., & Green, G. (2007). Living in cold homes after heating
improvements: Evidence from Warm-Front, England’s Home Energy Efficiency Scheme. Applied Energy,
84(2), 147–158.
Communities and Local Government (2016) The English Housing Survey, CLG, London
Department of Energy and Climate Change. (2013). National Energy Efficiency Data Framework: Part II Impact
of Energy efficiency Measures in Homes, DECC, London.
Department of Energy & Climate Change. (2010). The Green Deal: A summary of the Government’s proposals.
Science and Environment Section, House of Commons …. Retrieved from
http://cumbriacc.gov.uk/elibrary/Content/Internet/535/6032/6039/40606111134.pdf
Dowson, M., Poole, A., Harrison, D., & Susman, G. (2012). Domestic UK retrofit challenge: Barriers,
incentives and current performance leading into the Green Deal. Energy Policy, 50, 294–305.
https://doi.org/10.1016/j.enpol.2012.07.019
Energy Saving Trust. (2010). Getting warmer: a field trial of heat pumps. London.
Energy Saving Trust. (2014). The assumptions Energy Saving Trust use to calculate our savings.
Erkoreka, A. Martin, K., Gorse, C. and Fletcher., M., (2016) Reliable building energy performance
characterization based on full scale dynamic measurement. Report of Subtask 2: Logic and use of the
Decision Tree for optimizing full scale dynamic testing. International Energy Agency EBC. 58 available:
http://www.iea-ebc.org/projects/completed-projects/ebc-annex-58/
Farmer, D., Gorse., C., Miles-Shenton, D., Brooke-Peate, M., and Cuttle, C. (2016) Off-the-Shelf solutions to
Engineering Design: Selected Proceedings for the International Conference of Sustainable Ecological
Engineering Design for Society (SEEDS), Springer, Switzerland. 73-94
Farmer, D., Gorse, C., Swan, W., Fitton, R., Brooke-Peat, M., Miles-Shenton, D. (2017) Measuring thermal
performance in steady-state conditions at each stage of a full fabric retrofit to a solid wall dwelling, Energy
and Buildings, (forthcoming)
Fitton, R. (2013) Energy monitoring in retrofit project: Strategies, tools and practices, in Retrofitting the Built
Environment, pp 141-154 in Swan, W. and Brown, P. eds, Wiley Blackwell, Chichester
Fitton, R., Swan, W., Hughes, T., Benjaber, M. and Todd, S., 2016. Assessing the performance of domestic
heating controls in a whole house test facility. Building Services Engineering Research and
Technology, 37(5), pp.539-554.
Galvin, R. and Sunikka-Blank, M., (2017). Ten questions concerning sustainable domestic thermal retrofit
policy research. Building and Environment. (in press)
Gillott, M. C., et al. "Improving the airtightness in an existing UK dwelling: The challenges, the measures and
their effectiveness." Building and Environment95 (2016): 227-239.
Gupta, R., & Gregg, M. (2016). Do deep low carbon domestic retrofits actually work? Energy and Buildings,
129, 330–343. https://doi.org/10.1016/j.enbuild.2016.08.010
Gupta, R., Gregg, M., Passmore, S., & Stevens, G. (2015). Intent and outcomes from the Retrofit for the Future
programme: key lessons. Building Research & Information, 43(4), 435–451.
https://doi.org/10.1080/09613218.2015.1024042
Hall, M.R., Casey, S.P., Loveday, D.L. and Gillott, M., 2013. Analysis of UK domestic building retrofit
scenarios based on the E. ON Retrofit Research House using energetic hygrothermics simulation–Energy
efficiency, indoor air quality, occupant comfort, and mould growth potential. Building and
Environment, 70, pp.48-59.
Hopper, J., Littlewood, J.R., Taylor, T., Counsell, J.A., Thomas, A.M., Karani, G., Geens, A. and Evans, N.I.,
(2012). Assessing retrofitted external wall insulation using infrared thermography. Structural Survey, 30(3),
pp.245-266
International Organization for Standardization (1987) ISO 7345: Thermal insulation –Physical quantities and
International Organization for Standardization. (1994). ISO 9869: 1994 Thermal Insulation - Building elements
- In-situ measurement of thermal resisitance and thermal transmittance. Geneve.
International Organization for Standardization. (2008). EN ISO 13790:2008 Energy performance of buildings -
Calculation of energy use for space heating and cooling.
International Organization for Standardization. (2014). ISO 9869-1:2014 Thermal insulation -- Building
elements -- In-situ measurement of thermal resistance and thermal transmittance -- Part 1: Heat flow meter
method.
Jack, R., Loveday, D., Allinson, D. and Lomas, K., 2017. First evidence for the reliability of building co-heating
tests. Building Research & Information, pp.1-19.
Janssens, A. (2016) Overview of methods to analyse dynamic data. Report of Subtask 1b: Logic and use of the
Decision Tree for optimizing full scale dynamic testing. International Energy Agency EBC. 58 available:
http://www.iea-ebc.org/projects/completed-projects/ebc-annex-58/
Jenkins, D. P. (2010). The value of retrofitting carbon-saving measures into fuel poor social housing. Energy
Policy, 38(2), 832–839. https://doi.org/10.1016/j.enpol.2009.10.030
Ji, Y., Fitton, R., Swan, W., & Webster, P. (2014). Assessing overheating of the UK existing dwellings – A case
study of replica Victorian end terrace house. Building and Environment, 77, 1–11.
https://doi.org/10.1016/j.buildenv.2014.03.012
Johnston, D., Farmer, D., Brooke-Peat, M. & Miles-Shenton, D. (2014) Bridging the domestic building
performance gap. Journal of Building Research & Information, 44, 2. 147-159.
Johnston, D. Miles-Shenton, D., and Farmer, D. (2015) Quantifying the domestic building fabric performance
gap. Building Services Engineering Research & Technology, 36, 5, 614-627.
Johnston, D., Miles-Shenton, D., Wingfield, J., Farmer, D., & Bell, M. (2012). Whole House Heat Loss Test
Method (Coheating). Leeds: CEBE.
Jones, P., Li, X., Perisoglou, E. and Patterson, J., 2017. Modelling and Monitoring Five Energy Retrofit Houses
in South Wales. Energy and Buildings.
Kelly, M. J. (2009). Forum Retrofitting the existing UK building stock. Building Research and Information,
37(908304030), 196–200. https://doi.org/10.1080/09613210802645924
Loveday, D.L. and Vadodaria, K. (2013) Project CALEBRE Consumer Appealing Low Energy technologies for
Marincioni, V., Altamirano-Medina, H., May, N., & Sanders, C. (2016). Estimating the impact of reveals on the
transmission heat transfer coefficient of internally insulated solid wall dwellings. Energy and Buildings,
128, 405–412. https://doi.org/10.1016/j.enbuild.2016.06.067
Marshall, A., et al. "Domestic building fabric performance: Closing the gap between the in situ measured and
modelled performance." Energy and Buildings, 150, pp. 307-317
Meijer, F., Itard, L., & Sunikka-Blank, M. (2009). Comparing European residential building stocks:
performance, renovation and policy opportunities. Building Research & Information, 37(5–6), 533–551.
https://doi.org/10.1080/09613210903189376
National Audit Office (2016) Green Deal and Energy Company Obligation, NAO, London
Ofgem (2012) Energy Company Obligation Measures Table Version 1.6, Ofgem, London
Palmer, J. and Cooper, I., (2013) Openness in household energy use: The new Housing Energy Fact File, in
Retrofitting the Built Environment, pp 20-35 in Swan, W. and Brown, P. eds, Wiley Blackwell, Chichester
Pandraud, G., & Fitton, R. (2014). QUB: Validation of a Rapid Energy Diagnosis Method for Buildings. In
International Energy Agency Annexe 58 (pp. 1–6). International Energy Agency.
Pearson, C. (2011) Thermal Imaging of Building Fabric. BG 39/2011. Bracknell,BSRIA.
Pelsmakers, S., Fitton, R., Biddulph, P., Swan, W., Croxford, B., Stamp, S., Elwell, C. A. (2017). Heat-flow
variability of suspended timber ground floors: Implications for in-situ heat-flux measuring. Energy and
Buildings, 138, 396–405. https://doi.org/10.1016/j.enbuild.2016.12.051
Power, Anne. "Does demolition or refurbishment of old and inefficient homes help to increase our
environmental, social and economic viability?." Energy Policy 36.12 (2008): 4487-4501.
Ravetz, J., 2008. State of the stock—What do we know about existing buildings and their future prospects?.
Energy Policy, 36(12), pp.4462-4470
Reeves, A., Taylor, S., & Fleming, P. (2009). Deep carbon emission reductions in existing UK social housing :
are they achievable , and how can they be funded ? Sustainable Development, 919–930.
Roberts, D., Lowe, R., & Bell, M. (2005). Stamford Brook progress report. The 2005 World Sustainable
Building Conference, Tokyo, 27-29 September 2005 (SB05Tokyo), 2005(September), 4489–4494.
Rosenow, J. (2012). Energy savings obligations in the UK—A history of change. Energy Policy, 49, 373–382.
Rosenow, J., & Eyre, N. (2012). The Green Deal and the Energy Company Obligation–will it work? 9th BIEE
Academic Conference - European Energy in a Challenging World: The Impact of Emerging Markets, 15.
https://doi.org/10.1680/ener.13.00001
Rosenow, J., Platt, R., & Flanagan, B. (2013). Fuel poverty and energy efficiency obligations – A critical
assessment of the supplier obligation in the UK. Energy Policy, 62, 1194–1203.
https://doi.org/10.1016/j.enpol.2013.07.103
Rye, C., & Scott, C. (2012). The SPAB Research Report 1 U-Value Report (Version 2). London: Society for the
Protection Ancient Buildings.
Simpson, S., Banfill, P., Haines, V., Mallaband, B. and Mitchell, V., 2016. Energy-led domestic retrofit: impact
of the intervention sequence. Building Research & Information, 44(1), pp.97-115.
Sutton, R., Stafford, A. and Gorse, C., 2012. The coheating test: the value of a number. International Energy
Agency, Annex 58, Reliable Building Energy Performance Characterisation Based on Full Scale Dynamic
Measurements, Bilbao, Spain.
Swan, W., Fitton, R., & Brown, P. (2015). A UK practitioner view of domestic energy performance
measurement. Proceedings of the Institution of Civil Engineers - Engineering Sustainability, 168(3), 140–
147. https://doi.org/10.1680/ensu.14.00056
Tovar, M.. (2012). The structure of energy efficiency investment in the UK households and its average
monetary and environmental savings. Energy Policy, 50, 723–735.
https://doi.org/10.1016/j.enpol.2012.08.019
Wetherell, S., & Hawkes, J. (2011). Are SAP based assessments an accurate way of predicting the energy
savings made through refurbishment? In “Buildings don”t use energy, people do?’ Research Students’
Conference on Domestic Energy Use and CO2 Emissions in Existing Dwellings (pp. 43–54). Bath: Centre
for Alternative Technology.
White, J., Gillott, M.C., Wood, C.J., Loveday, D.L. and Vadodaria, K., 2016. Performance evaluation of a
mechanically ventilated heat recovery (MVHR) system as part of a series of UK residential energy retrofit
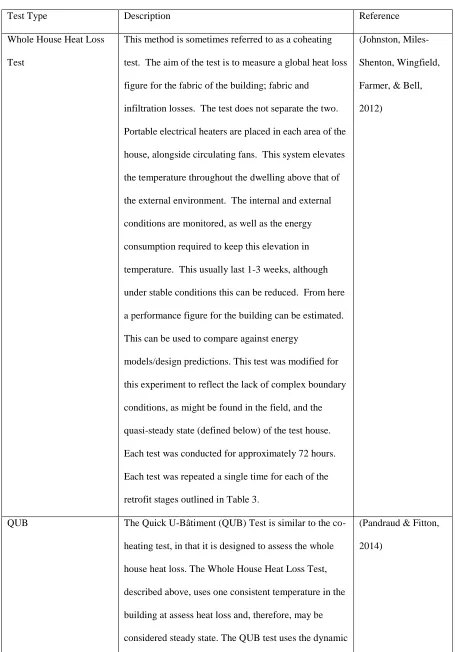
Table 1 – List of methods applied in whole study
Test Type Description Reference
Whole House Heat Loss
Test
This method is sometimes referred to as a coheating
[image:23.595.71.526.109.761.2]test. The aim of the test is to measure a global heat loss
figure for the fabric of the building; fabric and
infiltration losses. The test does not separate the two.
Portable electrical heaters are placed in each area of the
house, alongside circulating fans. This system elevates
the temperature throughout the dwelling above that of
the external environment. The internal and external
conditions are monitored, as well as the energy
consumption required to keep this elevation in
temperature. This usually last 1-3 weeks, although
under stable conditions this can be reduced. From here
a performance figure for the building can be estimated.
This can be used to compare against energy
models/design predictions. This test was modified for
this experiment to reflect the lack of complex boundary
conditions, as might be found in the field, and the
quasi-steady state (defined below) of the test house.
Each test was conducted for approximately 72 hours.
Each test was repeated a single time for each of the
retrofit stages outlined in Table 3.
(Johnston,
Miles-Shenton, Wingfield,
Farmer, & Bell,
2012)
QUB The Quick U-Bâtiment (QUB) Test is similar to the
co-heating test, in that it is designed to assess the whole
house heat loss. The Whole House Heat Loss Test,
described above, uses one consistent temperature in the
building at assess heat loss and, therefore, may be
considered steady state. The QUB test uses the dynamic
(Pandraud & Fitton,
heating and cooling characteristics of the building to
assess heat losses.
Surface Temperature
Measurements
The surface temperature measurement were taken at
junctions within both the test house and neighbouring
conditioning void (see below) to measure surface
resistances.
Air Permeability and
smoke test
The air permeability test is the process of measuring the
amount of conditioned air, in this case heated air,
through uncontrolled ventilation. A pressure
differential is created and the air flow out of or into the
property is assessed. This is measured in
m3.h.m2@50Pa, which indicates the volume of air per
hour for a given envelope area at 50 Pascals of
pressure. This can be done in concert with smoke tests
and thermography to indicate where air leakages are in
the fabric.
(ATTMA, 2010)
In Situ U-Values The thermal transmittance of a building element
(U-value) is defined in ISO 7345 as the “Heat flow rate in
the steady-state divided by area and by the temperature
difference between the surroundings on each side of a
system” (ISO, 1987, p.3). U-values are expressed in
W/m2K. In situ U-value measurements were
undertaken in accordance with ISO 9869 (ISO, 1994).
In situ measurements of heat flux density, from which
in situ U-values are derived, were taken at 75 locations
on the thermal elements of the test house using heat
flux plates (HFPs).
(ISO, 2014)
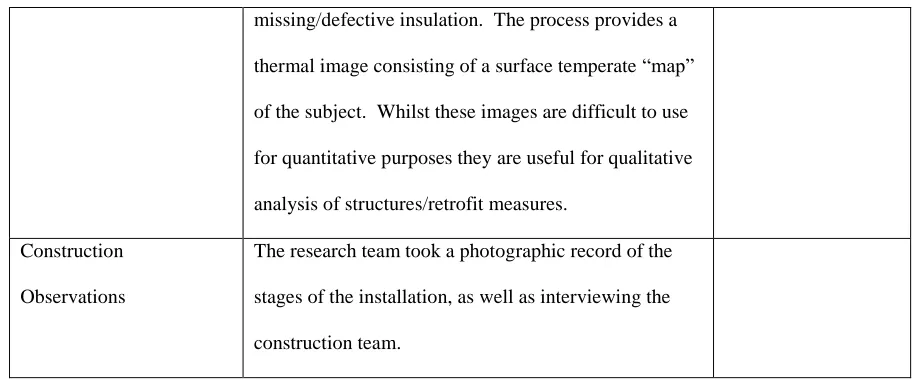
Thermography Thermal imaging can be used to detect, issues
concerning energy loss in buildings, such as
(BSRIA, 2011;
missing/defective insulation. The process provides a
thermal image consisting of a surface temperate “map”
of the subject. Whilst these images are difficult to use
for quantitative purposes they are useful for qualitative
analysis of structures/retrofit measures.
Construction
Observations
The research team took a photographic record of the
stages of the installation, as well as interviewing the
[image:25.595.68.526.69.259.2]construction team.
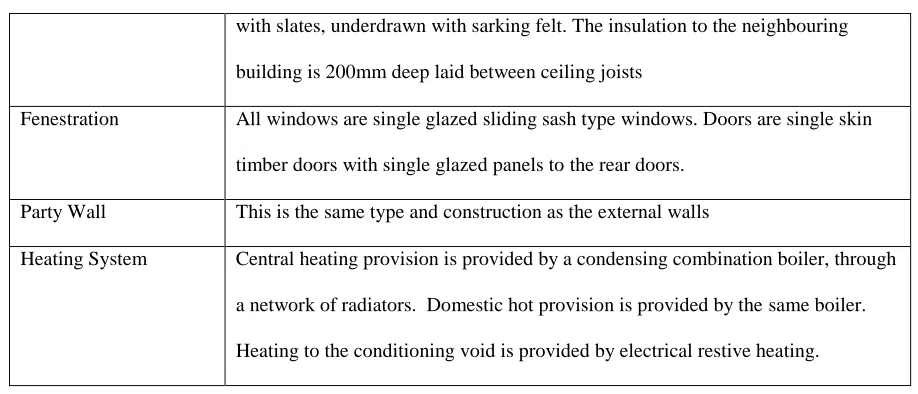
Table 2 - Energy House building description
Element Description
Walls Solid brick walls of a thickness of 225mm, 12.5mm gypsum plaster to inside face
and painted.
Floors The house is built on a reinforced concrete raft with no insulation added. A 200
mm gap exists between the ground floor finished level and this raft; this forms a
ventilated floor space allowing for a constant airflow beneath the house. The floor
is suspended on 200 mm timbers and is finished off with 22 mm thick floor boards
(non interlocking and non-sealed).
Roof/Ceilings The ceilings in the building are formed from lath and plaster. First floor ceiling
has 100mm depth of glass fibre insulation laid between the ceiling joists. The
with slates, underdrawn with sarking felt. The insulation to the neighbouring
building is 200mm deep laid between ceiling joists
Fenestration All windows are single glazed sliding sash type windows. Doors are single skin
timber doors with single glazed panels to the rear doors.
Party Wall This is the same type and construction as the external walls
Heating System Central heating provision is provided by a condensing combination boiler, through
a network of radiators. Domestic hot provision is provided by the same boiler.
[image:26.595.68.527.66.263.2]Heating to the conditioning void is provided by electrical restive heating.
Table 3 – Staged retrofit testing phases
Improvements
Evaluated
Wall Roof Floor Glazing
1 (Baseline) Uninsulated (solid wall) 100mm
mineral wool
Uninsulated
suspended
timber floor
Double glazing
2 (Loft Insulation
Only)
Uninsulated (solid wall) 270mm
mineral wool
Uninsulated
suspended
timber floor
Double glazing
3 (Glazing Only) Uninsulated (solid wall) 100mm
mineral wool
Uninsulated
suspended
timber floor
A+++ Glazing
Argon Fill, low
e
4 (Solid Wall
Insulation Only)
Gable and Rear 90mm EPS
External Wall Insulation,
Table 4 – Heat Loss Coefficient results, including energy, cost and carbon dioxide emissions savings
Improvements
Evaluated
HTC W/K Reduction
on baseline W/K Annual space heating energy reduction (kWh) Annual space heating cost reduction (£) Annual space
heating CO2
reduction (kg)
1 (Baseline) 187.5 n/a n/a n/a n/a
2 (Loft Insulation Only) 180.5 7.1 390 21 87
3 (Glazing Only) 174.2 13.4 737 39 164
4 (Solid Wall Insulation
Only)
101.2 86.4 4761 255 1062
5 (Floor Unimproved) 82.7 104.8 5777 310 1289 Front 80 mm PIR Internal
Wall Insulation
5 (Floor
Unimproved)
Gable and Rear 90mm EPS
External Wall Insulation,
Front 80 mm PIR Internal
Wall Insulation 270mm mineral wool Uninsulated suspended timber floor A+++ Glazing
Argon Fill, low
e
6 (Full Retrofit) Gable and Rear 90mm EPS
External Wall Insulation,
Front 80 mm PIR Internal
Wall Insulation 270mm mineral wool 200mm mineral wool and membrane A+++ Glazing
Argon Fill, low
6 (Full Retrofit) 69.7 117.8 6497 348 1449
Table 5 – Measured and modelled U Values for main building elements
U-value of element (W/m2K)
Thermal Upgrade Measured Baseline Modelled Baseline Baseline Discrepancy Measured Improved Modelled Improved Improved Discrepancy
Roof 0.35 (± 0.03)
0.37 0.02 0.16 (± 0.02)
0.15 0.01
Floor 0.61 (± 0.04)
NA NA 0.13 (± 0.03)
NA NA
EWI 1.72 (± 0.03)
2.10 -0.38 0.32 (± 0.01)
0.29 0.03
IWI 1.72 (± 0.03)
2.10 -0.38 0.22 (± 0.01)
0.23 -0.01
Glazing 2.39 (± 0.09)
2.60 -0.21 1.34 (± 0.05)