http://dx.doi.org/10.4236/opj.2016.65011
Image Processing of Corona Virus Using
Interferometry
Abdallah Mohamed Hamed
Physics Department, Faculty of Science, Ain Shams University, Cairo, Egypt
Received 4 February 2016; accepted 27 May 2016; published 30 May 2016
Copyright © 2016 by author and Scientific Research Publishing Inc.
This work is licensed under the Creative Commons Attribution International License (CC BY). http://creativecommons.org/licenses/by/4.0/
Abstract
A new method of image processing of corona virus based on two and multiple beam interference is suggested. The method is based on measuring the fringe shift with respect to the background in-terference pattern. The interested application of the corona virus image in confocal microscopy is getting depth information since it has the property of optical sectioning. An accurate measure-ment of the fringe shift is obtained using multiple beam interference since contrast is higher than that for two beam interference. The refractive index of the corona virus image is deduced from the fringe shift. A MATLAB code is used for the processing of all images.
Keywords
Interference, Image Processing, Refractive Index Distribution of Corona Virus
1. Introduction
Corona viruses are an important family of human and veterinary pathogens that can cause enteric and respiratory infections. Corona virus infection can lead to respiratory failure, gastroenteritis, nephritis, and hepatitis.
A novel methodology of single particle image analysis is applied to select virus features in order to obtain de-tailed model of oligomer state and spatial relationships among viral structural proteins [1].
The addition of electronics, computers, and software to interferometry has enabled enormous improvements to optical metrology. Phase-shifting interferometry is used for getting data into a computer so the data can be analyzed [2]-[9]. Image processing of uniform objects and modified apertures was outlined [10]-[14].
fringe spacing either using two or multiple beam interference.
2. Analysis
The complex amplitude of the corona virus as an object can be represented as follows:
(
, ;)
exp(
, ;)
obj
A x y z =a iΦ x y z (1)
where a—is the amplitude of the image, and Φ
(
x y z, ;)
is its phase for object depth z. Equation (1) can be written in a discrete matrix form as follows:(
)
(
)
1 1
, ; exp , ;
N M obj
n m
A x y z a i n x m y z
= =
=
∑∑
Φ ∆ ∆ (2)where a square matrix of dimensions N×N = 512 × 512 pixels (N = M) is assumed.
This work focuses on the main technique for phase evaluation of the corona virus image using the phase shifting method.
Coherent addition of a reference laser beam Ar=RexpiΨ
(
x y,)
to the above object beam is considered to fabricate the modeled interference pattern. The laser beam is spatially filtered using a pinhole located in the foc-al plane of a converging lens in order to get uniform illumination. In this case, a plane wave is obtained. The pinhole pass only the central peak from the whole diffraction pattern and suppress all the diffraction legs and then the converging lens which is placed a distance (f) from the pinhole passes parallel rays of uniform intensity which is considered as a plane wave.Then the intensity of the two beam interference obtained in the detector plane can be expressed as the mod-ulus square as follows:
(
, ;)
0{
1 cos(
, ;)
( )
,}
I x y z =I +M Φ x y z − Ψ x y (3) where I x y z
(
, ;)
is the intensity of the modulated interference field at the point I x y( )
, for object depth z,2 2
0
I = R + a , is the function that characterizes the mean intensity of the interference pattern and
(
)
2 22
M = aR R +a , is the function that determines the modulation of the interference signal. In this case, the obtained trigonometric function has straight line fringes modulated by the object phase information. The modulated intensity is rewritten in matrix form as follows:
(
)
0{
(
)
(
)
}
1 1
, ; 1 cos , ; ,
N M
n m
I x y z I M n x m y z n x m y
= =
=
∑∑
+ Φ ∆ ∆ − Ψ ∆ ∆ (4)Certainly, the d. c term in equation (3), I0 = a2+R2.
R is the amplitude of the coherent laser beam and that Ψ appeared in equation (3) its phase. The equation (4) is used in the fabrication of the phase-shifted images outlined in equation (5).
Since the distance between any two fringes = λ/2. Consequently, according to the phase shift technique [7] [9], the phase information of the image is governed by the following equation:
(
)
(
)
1 3(
(
)
)
2(
(
)
)
1 2
, ,
, , ; tan
, ,
I x y I x y n x m y n x m y z
I x y I x y
− −
Ψ ∆ ∆ = Φ ∆ ∆ −
−
(5)
where the range of the interference phase Φ ∆
(
n x m y, ∆)
extends from 0 up to 2π for a height z, I1 is theinten-sity given in equation (4) at a phase Ψ =π 2, I2 has Ψ =π, and I3 has phase Ψ =3π 2. Then, three
equa-tions are solved to get equation (5).
Once the phase is determined across the interference field, the corresponding height distribution h(x, y) on the surface of corona virus can be determined [2] as follows:
(
, ;)
(
, ;)
4π
h x y z = λ Φ ∆n x m y z∆ (6) We have assumed the surface measured at normal incidence. Almost all interferometers used to measure sur-face height variations use phase-shifting techniques.
Since the phase of the wave cumulates traveling a distance L in a medium is
( )
(
, ,)
, d d
L
x y z
x y k l l
c
µ
ω
Φ =
∫
=∫
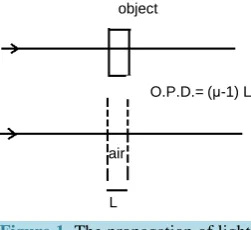
(7)Then, the same wave that propagates over two equivalent paths L in corona virus medium and in vacuum gives the phase difference as follows (Figure 1):
(
x y z, ;) (
k k0)
dl(
x y z, ,)
1 dl cµ ω
∆Φ =
∫
− =∫
− (8)where k = ω/c = 2π/λ is the propagation wave number in a medium of refractive index µ while k0 is the
propaga-tion constant in vacuum.
By differentiation w.r.t. the path l = z, the refractive index distribution of the corona virus image is computed as follows:
( )
d(
)
, 1 , ;
d c
x y x y z
z
ϖ
ω
= + ∆Φ (9)
Since the angular frequency is related to the wavelength as ω=2πc λ and
(
x y,)
2π(
O P D. . .)
λ
∆Φ =
then the above equation becomes:
( )
d[
]
, 1 . . .
d
x y O P D
z
µ = + (10)
The optical path difference represents the height variation of the image, namely h x y z
(
, ,)
then equation (10) becomes:( )
d(
)
, 1 , ,
d
x y h x y z
z
µ = + (11)
The differentiation of the height distribution h x y z
(
, ,)
with respect to z give the differential fringe shift and the amplitude of the planar image a(x, y). Consequently, we finally get equation (12).( )
x y, const x. 1 a x y( )
, z zµ
= +δ
(12)The fringe shift is δz with respect to inter-fringe spacing ∆z at constant x, the fringes are assumed located in the x-y plane and z is the axis normal to the fringe system which represents the height depth and a(x, y) represents the amplitude of the image. In equation (12), h x y z
(
, ,)
=a x y( )
, ⋅δ
z.Computation of the Contrast
Consider the visibility expression to represent the fringe contrast as follows:
max min
max min
I I
C
I I
− =
[image:3.595.250.376.579.694.2]+ . Substitute in equation (3), we get this result for the contrast:
Figure 1. The propagation of light in a medium of refractive index μ compared with air.
O.P.D.= (μ-1) L object
air
(
2)
2 1
C=M = R +R (13)
While the contrast given in case of multiple beam interference is extracted from the transmitted intensity dis-tribution [15]:
(
0)
(
)
2
1 sin , , 2
t
I I
F x y x y
=
+ Φ − Ψ (14)
The parameter F=4R
(
1−R)
2 and the corresponding contrast is given by the formula (11). The maximum and minimum intensities are obtained from equation (13) as:max 0
I =I for Φ
(
x y,)
− Ψ(
x y,)
=2mπ, m is integer.(
)
min 0 1
I =I +F for Φ
(
x y,)
− Ψ(
x y,)
=mπIt is known that the refractive index has a direct relation with the polychromatic spectral distribution of illu-minating light according to the Cauchy formula as follows:
2
a b
λ
µ
= +λ
where a, and b are constants. Then the fringe shift and the refractive index are affected by the change of the wa-velength.
3. Results and Discussion
The Corona virus image used in the processing is shown as in the Figure 2. It has dimensions of 512 × 512 pix-els. The fringe shift occurred within the corona virus w.r.t. the background shift is plotted as in the Figure 3 at frequency f = 1/32. This interferometer plotis obtained from equation (3) written in discrete form where M= N = 512 pixels. The yellow discontinuous horizontal lines are taken at 10, 80, 140, 200, 260, 320, 380, 440 pixels. Only 7 fringes are shown in this image. The shift of the corona virus cells are computed as compared with the inter-fringe spacing. The Mat Lab code is used for the computation of the modulation term cos (y-(1/32) A(i, j)). While the background two beam interference is only cos (y). It is represented by straight line fringes modulated by the object matrix A (M, N). From the Figure 3, eight plots are shown in the Figure 4 at 10, 80,140, and 200 pixels in the 1st column, and at 260, 320, 380, and 440 pixels in the 2nd column. The upper left plot at 10 pixels show uniform straight line fringes which is compared with the shifted fringes corresponding to the image geo-metry shown at the mentioned lines. Hence, we can get phase information about the image as plotted in the Fig-ure 5 using equation (8) and height information from equation (9).
[image:4.595.172.455.503.693.2]Four different modulated fringes shifts are shown in the Figure 6. Interferometry images of the corona virus
Figure 2. Corona virus image used in the processing. It has dimensions of
512 × 512 pixels.
0 100 200 300 400 500
50
100
150
200
250
300
350
400
450
500
pixels
pi
xel
Figure 3. Two beam interference of corona virus image of dimensions
512 × 512 pixels. The yellow discontinuous lines are taken at 10, 80, 140,
[image:5.595.179.449.83.277.2]200, 260, 320, 380, 440 pixels. 7 fringes are shown in this image. The shift of the corona virus cells are computed compared with the inter-fringe spacing.
Figure 4. Eight plots from theFigure 3 are shown at 10, 80,140, and 200 pixels in the 1st column in the left, and at 260, 320, 380, and 440 pixels in
the 2nd column.
using the cosine function to represent the phase at four different spatial frequencies at 1/32, 1/64, 1/96, and 1/128. The original image is multiplied by a factor of α = 1/32 in the interference modulated terms as follows: for a) cos (y-(1/32)A (i, j)), b) cos (2y-(1/32) A (i, j)), c) cos (3y-(1/32) A (i, j)), and d) cos (4y-(1/32) A (i, j)).
The multiple beam interferometry images of the corona virus using the Airy function to represent the phase at four different background frequencies is plotted as in the Figure 7. The original image is multiplied by a factor of α = 1/32 as in the Figure 6.
Finally, comparing the fringe shift in the corona virus image at different frequencies f = 1/32, 1/64, 1/96, and 1/128, it is shown that the fringe shift is not resolved at frequency greater than f = 1/128.
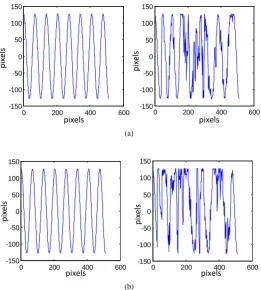
[image:5.595.192.437.346.531.2]The profile of the corona virus image taken at constant x = 150 pixels extracted from the image shown in the
Figure 3 is plotted as in the Figure 8(a) and the profile taken at x = 330 pixels is plotted in the Figure 8(b). In the left of both plots, seven fringes are shown. The profiles are affected by the fringe shift resulted from the phase change of the image under consideration.
pixels
pi
xel
s
0 100 200 300 400 500
50 100 150 200 250 300 350 400 450 500
0 200 400 600
-0.5 0 0.5
0 200 400 600
-0.5 0 0.5
0 200 400 600
-0.5 0 0.5
0 200 400 600
-0.5 0 0.5
0 200 400 600
-0.5 0 0.5
0 200 400 600
-0.5 0 0.5
0 200 400 600
-0.5 0 0.5
0 200 400 600
Figure 5. The Phase map of the corona virus of background spatial
fre-quency f = 5; where α = 1/32.
Figure 6. The interferometry images of the corona virus using the cosine function to represent the phase at four different spatial frequencies at 1/32,
1/64, 1/96, and 1/128. The original image is multiplied by a factor of α =
1/32.
Effect of mirror reflection coefficient upon the multiple beam interference images is shown as in the Figure 9. Refer to the derived equation from the Airy distribution (14); the contrast of the image is sharper for higher ref-lectivity, equation (13). The images shown in the Figure 9 are in good agreement with the theoretical results since higher contrast is attained at R = 80% as compared with that obtained at R = 40%.
The values of refractive index extracted from the Figure 10 are given in the Table 1 and plotted for horizon-tal line at 330 pixels as in the Figure 11. The modulated interference image of corona virus as in the Figure 12
where 32 fringes are plotted is used in the segmentation.
The upper cell segment selected from the image in the Figure 12is shown as in the Figure 13(a) and the cor-responding modulated fringe system of 11 fringes shown in the Figure 13(b) is investigated. The values of re-fractive index extracted from the Figure 13(b) for the cell are computed from equation (12) given in the Tables 2-4 and plotted for horizontal lines at 60, 80, and 100 pixels as in the Figure 14.
pixels
pi
xe
ls
0 100 200 300 400 500
50
100
150
200
250
300
350
400
450
500
pixels
pi
xe
ls
0 200 400
100
200
300
400
500
0 200 400
100
200
300
400
500
0 200 400
100
200
300
400
500
0 200 400
100
200
300
400
500
pixels
pi
xe
ls
pixels
pi
xe
ls
pixels
pi
xe
Figure 7. The multiple beam interferometry images of the corona virus using the Airy function to represent the phase at four different
back-ground frequencies as in theFigure 6. The original image is multiplied
by a factor of α = 1/32.
(a)
(b)
Figure 8. (a): The profile of the corona virus image taken at constant x
= 150 pixels extracted from the image shown in theFigure 3. Seven
fringes are shown; (b) the profile of the corona virus image taken at
constant x = 330 pixels extracted from the image shown in theFigure 3.
Seven fringes are given. a
0 200 400
100 200 300 400 500 b
0 200 400
100 200 300 400 500 c
0 200 400
100 200 300 400 500 d
0 200 400
100 200 300 400 500 pixels pi xe ls pixels pi xe ls pixels pi xe ls pixels pi xe ls pixels pi xe ls pixels pi xe ls
0 200 400 600
-150 -100 -50 0 50 100 150
0 200 400 600
-150 -100 -50 0 50 100 150
0 200 400 600
-150 -100 -50 0 50 100 150
0 200 400 600
[image:7.595.183.445.368.659.2]Figure 9. Effect of mirror reflection coefficient upon the multiple beam interference images is shown.
Figure 10. The corona virus image modulated by fourteen fringes used in the computation of the refractive index at 150 and 330 pixels
as in theTable 1.
R = 40%
pi
xel
s
pixels R = 40%
R = 80%
pi
xel
s
pixels R = 80%
0 100 200 300 400 500
50
100
150
200
250
300
350
400
450
500
pi
xel
s
[image:8.595.203.432.82.453.2] [image:8.595.185.440.490.681.2]Table 1. The refractive index values as a function of the Z coordinate at certain horizontal line at 330 pixels.
Z Zimage δZ = Z− Zimage µ (Z) = 1 + δZ/∆Z
34 2 32 1.94
68 49 19 1.56
102 99 3 1.09
136 131 5 1.15
170 158 12 1.35
204 180 24 1.71
272 272 0 1.00
306 291 15 1.44
340 319 21 1.62
374 354 20 1.59
408 384 24 1.71
443 441 2 1.06
[image:9.595.79.544.111.614.2]479 476 3 1.09
Figure 11. plot of the refractive index versus the horizontal distance at constant line x = 330 pixels. Three cells from the corona virus are
scanned in the image. Inter-fringe spacing ∆Z = 34 pixels.
Figure 12. The modulated interference image of corona virus where 32 fringes are shown.
0 100 200 300 400 500
1 1.1 1.2 1.3 1.4 1.5 1.6 1.7 1.8 1.9 2
Z in pixels
r
ef
rac
ti
v
e i
ndex
0 100 200 300 400 500
50
100
150
200
250
300
350
400
450
500
pi
xel
s
[image:9.595.186.439.510.694.2]Figure 13. In the left (a), a segment from the image shown in the
[image:10.595.86.540.274.404.2]Figure 12is taken at i = 220: 390 pixels and j = 10:180 pixels. The modulated two beam interference of the cell (segment) shown in (b) is investigated. Both segments in a, b have dimen-sions of 170 × 170 pixels.
Table 2. The refractive index values as a function of the Z coordinate at certain horizontal line at 60 pixels.
Z Zimage δZ = Zimage − Z µ (Z) = 1 + δZ/∆Z
51 63 12 1.80
69 80 11 1.73
84 96 12 1.80
100 111 11 1.73
118 126 8 1.53
132 141 9 1.60
149 152 3 1.20
166 167 1 1.07
Table 3. The refractive index values as a function of the Z coordinate at certain horizontal line at 80 pixels.
Z Zimage δZ = Zimage − Z µ (Z) = 1+ δZ/∆Z
51 62 11 1.73
69 76 7 1.47
84 92 8 1.53
100 108 8 1.53
118 126 8 1.53
132 141 9 1.60
149 153 4 1.27
166 170 4 1.27
Table 4. The refractive index values as a function of the Z coordinate at certain horizontal line at 100 pixels.
Z Zimage δZ = Zimage − Z µ (Z) = 1 + δZ/∆Z
51 60 9 1.60
69 75 6 1.40
84 91 7 1.47
100 107 7 1.47
118 128 10 1.67
132 144 12 1.80
149 154 5 1.33
166 171 5 1.33
pi
xel
s
pixels a
50 100 150
50
100
150
b
50 100 150
50
100
150
pixels
pi
xel
[image:10.595.87.538.432.563.2] [image:10.595.88.539.589.720.2]Figure 14. Three plots of the refractive index variation with Z at constant
ho-rizontal lines at x = 60, 80, 100 pixels computed from the Figure 13(b)
which has only one cell.
The map of the refractive index distribution computed from equation (10) is the final object of this work.
4. Conclusions
The phase shift of corona virus images deduced from the interferometer images. The interferometer images us-ing multiple beam interference gave better contrast than the correspondus-ing images with the two-beam interfe-rence as expected. The effect of mirror reflection coefficient upon the multiple beam interfeinterfe-rence images dis-cussed.
Useful information obtained from studying this virus using interferometry is extracted from the fringe shift of the modulated interference pattern namely the refractive index distribution of the whole image. Consequently, detailed and precise information about the virus may be extracted from the refractive index distribution. In addi-tion, since the refractive index has a direct relation with the polychromatic spectral distribution of illuminating light according to the Cauchy formula it allows observe the diameter of the virus cell accurately as it changes with the wavelength of light.
References
[1] Neuman, B.W., Adair, B.D. and Virology, J. (2006) Super Molecular Architecture of Severe Acute Respiratory
Syn-drome Corona Virus Revealed by Electron Cryo-Microscopy. Journal of Virology, 80, 7918-7928.
http://dx.doi.org/10.1128/JVI.00645-06
[2] Wyant, J.C. (2013) Computerized Interferometric Surface Measurements. Applied Optics, 52, 1-8.
http://dx.doi.org/10.1364/AO.52.000001
[3] Crane, R. (1969) Interference Phase Measurement. Applied Optics, 8, 538-542.
[4] Wyant, J.C. (1973) Double Frequency Grating Lateral Shear Interferometer. Applied Optics, 12, 2057-2060.
http://dx.doi.org/10.1364/AO.12.002057
[5] Bruning, J.H., Herriott, D.R., Gallagher, J.E., et al. (1974) Digital Wave-Front Measuring Interferometer for Testing
Optical Surfaces and Lenses. Applied Optics, 13, 2693-2703. http://dx.doi.org/10.1364/AO.13.002693
[6] Wyant, J.C. (1975) Use of an Ac Heterodyne Lateral Shear Interferometer with Real-Time Wave Front Correction
Systems. Applied Optics, 14, 2622-2626. http://dx.doi.org/10.1364/AO.14.002622
[7] Liu, J.P. and Poon, T.C. (2009) Two-Step-Only Quadrature Phase Shifting Digital Holography. Optics Letters, 34,
250-252. http://dx.doi.org/10.1364/OL.34.000250
[8] Yatagai, T. and Nakadate, S. (1982) Automatic Fringe Analysis Using Digital Image Processing Technique. Optical
Engineering, 21, 432-435.
[9] Hamed, A.M. and Saudy, M.A. (2015) Image Processing of Argon Glow Discharge Plasma Using Interferometry.
Journal of Plasma Physics, 81, 1-14. http://dx.doi.org/10.1017/S0022377815000550
[10] Hamed, A.M. (2009) Numerical Speckle Images Formed by Diffusers Using Modulated Conical and Linear Apertures.
Journal of Modern Optics, 56, 1174-1181. http://dx.doi.org/10.1080/09500340902985379
[11] Hamed, A.M. (2009) Formation of Speckle Images Formed for Diffusers Illuminated by Modulated Apertures
(Circu-lar Obstruction). Journal of Modern Optics, 56, 1633-1642. http://dx.doi.org/10.1080/09500340903277792
[12] Hamed, A.M. (2011) Discrimination between Speckle Images Using Diffusers Modulated by Some Deformed
Aper-tures: Simulation. Optical Engineering, 50, 1-7. http://dx.doi.org/10.1117/1.3530085
[13] Hamed, A.M. (2011) Computer Generated Quadratic and Higher Order Apertures and Its Application on Numerical
0 100 200
1 1.5 2
Z (pixels)at x=60 pixels
r
ef
rac
ti
v
e i
ndex
0 100 200
1 1.5 2
Z(pixels) at x=80 pixels
0 100 200
1 1.5 2
Speckle Images.Optics and Photonics Journal, 1, 43-51. http://dx.doi.org/10.4236/opj.2011.12007
[14] Hamed, A.M. (2014) Study of Graded Index and Truncated Apertures Using Speckle Images. Precision Instrument and
Mechanology (PIM), 3, 144-152.
[15] Born, M. and Wolf, E. (1964) Principles of Optics, Electromagnetic Theory of Propagation, Interference and